The final publication is available at Springer via 10.1007/s10682-‐014-‐9743-‐6 and
1
is published as: Morrell, LJ, Greenwood, L. & Ruxton GD (2015) Consequences of
2
variation in predator attack for the evolution of the selfish herd. Evolutionary
3
Ecology. 29: 107-‐121.
4
5
Consequences of variation in predator attack for the evolution of the selfish 6
herd 7
8
9
Lesley J. Morrell1, Lottie Greenwood1 & Graeme D. Ruxton2
10
1School of Biological, Biomedical and Environmental Sciences, University of Hull
11
2School of Biology, University of St Andrews
12 13
Correspondence: 14
Lesley J. Morrell 15
School of Biological, Biomedical and Environmental Sciences 16
University of Hull 17
Kingston-‐upon-‐Hull 18
HU6 7RX 19
Email: [email protected] 20
21
Running title: Evolution of selfish herd behaviour 22
Keywords: aggregation, group living, anti-‐predator behaviour, selfish herd 23
Abstract 25
There is a strong body of evidence that patterns of collective behaviour in 26
grouping animals are governed by interactions between small numbers of 27
individuals within the group. These findings contrast with study of the ‘selfish 28
herd’, where increasingly complex individual-‐level movement rules have been 29
proposed to explain the rapid increase in aggregation observed when prey 30
groups are startled by or detect a predator. While individuals using simple rules 31
take into account the position of only a few neighbours, those using complex 32
rules incorporate multiple neighbours, and their relative distance, to determine 33
their movement direction. Here, we simulate the evolution of selfish herd 34
behaviour to assess the conditions under which simple and complex movement 35
rules might evolve, explicitly testing predictions arising from previous work. We 36
find that complex rules outperform simple ones under a range of predator attack 37
strategies, but that simple rules can fix in populations particularly when they are 38
already in the majority, suggesting strong positive frequency dependence in rule 39
success. In addition, we explore whether a movement rule derived from studies 40
of collective behaviour (where individuals use the position of 7 neighbours to 41
determine movement direction) performs as successfully as more complex rules, 42
finding again positive frequency dependence in rule success, and a particular 43
role for predator attack strategy (from within or outside the group). 44
Introduction 46
Aggregation into groups is a widely observed natural-‐history trait, both 47
taxonomically and across different biomes. An understanding of the selective 48
pressures underlying animal grouping behaviours has been a dominant feature 49
throughout the study of behavioural ecology (all four editions of the seminal 50
textbook ‘An Introduction to Behavioural Ecology’ devote a whole chapter to the 51
phenomenon; e.g. Davies et al. 2012). Aggregation often considered to arise as a 52
response to predation (Krause and Ruxton 2002; Wood and Ackland 2007), as it 53
carries with it a number of anti-‐predator benefits, including increased vigilance 54
(e.g. Roberts 1996), dilution (reduced chance of being the individual attacked; 55
Foster and Treherne 1981), encounter-‐dilution (reduced encounter rate; Turner 56
and Pitcher 1986) and confusion effects (cognitive limitations reducing success; 57
Miller 1922; Krakauer 1995), which act to reduce individual risk to each group 58
member. 59
60
Individuals within groups also benefit from the mechanisms outlined by the 61
selfish herd hypothesis (Hamilton 1971), where individuals reduce their own 62
risk of predation at the expense of others in the group, effectively seeking cover 63
within the group and placing other group members at increased risk. Work on 64
selfish herds focuses primarily on the behavioural strategies (‘movement rules’) 65
of individuals that generate aggregations, to explain the oft-‐observed 66
phenomenon of facultative or increased aggregation in response perceived 67
threat (Hamilton 1971; Foster and Treherne 1981; Krause and Tegeder 1994; 68
Watt et al. 1997; Spieler and Linsenmair 1999; Viscido and Wethey 2002).
Perceived threat can also increase synchrony within groups (Bode et al. 2010).
71
The synchronous behaviour of large aggregations has been the focus of 72
significant research effort, in an attempt to understand how large-‐scale collective 73
behaviour can be brought about through interactions between individuals. 74
Theoretical (e.g. Huth and Wissel 1992; Huth and Wissel 1994; Couzin and 75
Krause 2003; Giardina 2008; Hildenbrandt et al. 2010; Bode et al. 2011a) and 76
empirical (e.g. Buhl et al. 2006; Ballerini et al. 2008a; Katz et al. 2011) evidence 77
suggests that patterns of collective behaviour in grouping animals are governed 78
by interactions between small numbers of individuals within the group. For 79
starling flocks, for example, each individual interacts with 6 or 7 neighbours on 80
average (Ballerini et al. 2008a); models incorporating interactions over similar 81
topological distances confirm collective behaviour as an emergent property of 82
the system (Hildenbrandt et al. 2010; Bode et al. 2011a; Bialek et al. 2012). Pair-‐ 83
wise interactions in fish shoals effectively capture spatial patterns in groups of 84
up to 30 individuals (Katz et al. 2011), and locust swarms are coordinated by 85
only by short-‐range local interactions within a range of 13.5cm (Buhl et al. 2006). 86
87
This focus on generating large scale patterns from interactions with small 88
numbers of neighbours contrasts sharply with the study of selfish herd 89
behaviour, where research has focused on identifying movement rules that 90
result from complex interactions between increasingly large numbers of 91
neighbours (Morton et al. 1994; Viscido et al. 2002; Reluga and Viscido 2005).
92
Evolutionary simulations of selfish herds suggest that populations become 93
dominated by individuals that account for the position of much larger numbers 94
movement rules is limited. Sticklebacks move towards a neighbour that can be 96
reached more quickly, rather than one that is geographically closer (Krause and 97
Tegeder 1994), and seals’ movement is consistent with attraction towards a 98
single neighbour (using simple rules) rather than multiple neighbours (De Vos 99
and O'Riain 2012). In contrast, sheep movement patterns in response to threat 100
from a sheepdog are consistent with the idea that they are moving towards the 101
group centre (King et al. 2012). 102
103
A key difference between these two areas of work is that while collective 104
behaviour represents a stable level of aggregation, the selfish herd is a process of 105
(increasing) aggregation levels. However, theoretical research on the selfish herd 106
focuses primarily on the point at which stable aggregations have formed, but 107
recent work suggests that timing of predator attacks in relation to the point at 108
which prey first detect the predator and initiate anti-‐predator behaviour is 109
crucial in determining the success of movement rules, and that simpler rules, 110
accounting for fewer neighbours, might evolve under a range of biologically-‐ 111
plausible conditions (Morrell and James 2008; Morrell et al. 2011a). While it is of 112
course feasible that the different situations of movement synchronisation and 113
increasing aggregation use different methods of processing information, the 114
discrepancy in research activity is worthy of further investigation. 115
116
In our previous work, we found that simpler mutant aggregation strategies 117
(rules) experienced a reduced share of the risk in populations of more complex 118
rules, when predators attacked during the process of aggregation (Morrell et al. 119
larger size (Morrell & James 2008). More complex rules are more effective at 121
reducing risk in larger and denser populations (Morrell & James 2008, Morrell et 122
al. 2011b) and when predators attack later in the movement sequence (Morrell 123
et al. 2011a). Complex rules are also more effective at moving individuals from 124
the periphery of a group to the centre (Morrell et al. 2011b), where they will be 125
protected from predators that attack from outside the group (for a discussion of 126
predator attack strategies, see Morrell and Romey 2008; Morrell et al. 2011a and 127
2011b). We use the terms ‘simple’ and ‘complex’ rules to reflect the terminology 128
used in previous papers in this field. There has been no investigation into 129
whether these rules are cognitively ‘simple’ or ‘complex’ for animals, and this 130
may differ between species (discussed in Morrell and James 2008; Morrell et al. 131
2011a; 2011b). Essentially more complex rules appear to require individuals to 132
obtain a greater amount of information from their environment in order to apply 133
them. 134
135
Our previous work (Morrell & James 2008, Morrell et al. 2011a, b) provides a 136
series of predictions, based on reduction of individual risk in a group, as to when 137
mutant individuals using simpler rules should be able to invade a population of 138
more complex rules. Here, we explicitly test those predictions in an evolutionary 139
simulation model, to explore whether the reduction in risk translates into 140
fixation in a population over evolutionary time. Our first aim, therefore, is to test 141
the following predictions arising from previous work: 142
1. Predators that attack from the periphery favour the evolution of complex 143
2. When predators attack early in the movement sequence (i.e. shortly after 145
they are detected, and when individuals have had little time to move in 146
response to detecting the predator), simple strategies are favoured, while 147
predators that attack later favour the evolution of more complex 148
strategies. 149
3. Variation in attack timing (i.e. when predators can attack both quickly and 150
more slowly after prey initiate aggregation) should favour the 151
maintenance of mixtures of strategies within the population (following 152
from prediction 2). 153
4. Simple rules are favoured in large, low-‐density populations, while 154
complex rules are favoured in small, compact populations. 155
Our second aim (which could be considered a special case of the more general 156
aim 1) is derived from the substantial body of work on collective behaviour (e.g. 157
Couzin and Krause 2003; Ballerini et al. 2008a; Giardina 2008; Hildenbrandt et 158
al. 2010; Buhl et al. 2011; Katz et al. 2011; Bode et al. 2011a; Bialek et al. 2012), 159
and is to specifically assess whether a rule whereby individuals move towards 7 160
neighbours might perform as effectively as more complex rules in reducing 161
individual risk. This leads to the prediction that: 162
5. A rule whereby individuals account for the position of 7 neighbours (i.e. a 163
relatively small number) is as likely to evolve as a more complex rule 164
whereby individuals account for the position of up to 20 individuals (the 165
“Local Crowded Horizon” rule; Viscido et al. 2002, table 1). 166
167
We used an agent-‐based modelling framework used in previous work on selfish 169
herd behaviour (James et al. 2004; Morrell and James 2008; Morrell et al. 2011b; 170
Morrell et al. 2011a) as the basis for our evolutionary simulation. In each 171
generation of the model, N point-‐like agents representing the prey individuals 172
are randomly placed (following a uniform random distribution) into a circular 173
arena of radius R m, giving a prey density d = N/πR2. We assume that the habitat
174
is homogeneous and provides no areas of cover that could be used to reduce 175
predation risk: in accordance with (Hamilton 1971), cover is provided by 176
position relative to other individuals only, and prey receive no directional 177
information regarding predatory threat (Hamilton 1971; Morton et al. 1994; 178
Viscido et al. 2002; James et al. 2004; Morrell and James 2008; Morrell et al. 179
2011b; Morrell et al. 2011a). We consider N = 20 and d = 4 as our ‘baseline’ 180
parameter values, and explore the independent effects of increasing group size 181
(N = 50) and increasing density (d = 10). 182
183
Each prey is allocated a movement rule, selected from those previous proposed. 184
We consider 4 movement rules here, following previous work on the topic. 185
Firstly, we consider the 3 rules investigated by Morrell et al. (2011a) and Morrell 186
et al. (2011b): nearest neighbour (NN), 3 nearest neighbours (3NN) and local 187
crowded horizon (LCH). These rules are described in table 1. To investigate 188
whether rules that account for 7 neighbours are competitive against those that 189
account for more (prediction 4), we also include a 7 nearest neighbour rule 190
(7NN) in our investigations. Although previous work has considered ‘random 191
movement’ as a potential rule, we do not include it here as it is well established 192
1994; Viscido et al. 2002; Morrell and James 2008). In each generation, Np 194
individuals are allocated a ‘population’ movement rule, and Nm are allocated a 195
‘mutant’ movement rule (Nm + Np = N). We explore 2 different starting 196
combinations: a single mutant in a population using a different rule (Nm = 1, Np = 197
N-‐1), and a situation where both rules begin at equal frequencies (Nm = Np = 198
N/2). These two scenarios represent two possible events: a mutant rule arising 199
by chance in an existing group, and a situation where two groups, using different 200
rules, meet. Throughout, we refer to the ‘simpler rule’ as the one that requires 201
information about the position fewer neighbours, and the ‘more complex rule’ as 202
one that require information about more neighbours (table 1). 203
204
As in previous work, the start of the simulation (timestep t = 0) represents the 205
point in time at which the prey first detect the predator and movement begins. 206
We assume that all individuals detect the predator simultaneously and begin 207
moving, following Hamilton (1971), Morton et al (1994), Viscido et al. (2002) 208
and Morrell and James (2008). The end of the simulation occurs at time T, which 209
is the point at which the predator attacks the prey. In each timestep t (t=0.1 s), 210
each prey individual identifies its target location, dependent on its allocated 211
movement rule and moves at a speed of 0.15 m s-‐1 towards the target location
212
(representing the movement speed of a three-‐spined stickleback, following 213
James et al. 2004). All individuals move simultaneously, and update their target 214
location in each timestep. At time T (T > 0) the predator appears, and attacks the 215
closest prey item. T takes either fixed values (T = 20, 50 and 100 are used here) 216
or is randomly drawn from a uniform distribution between 0 and Tmax (Tmax = 50, 217
219
We investigate two predation strategies P: the predator may appear within the 220
group (following Hamilton 1971) or may appear outside the group (empirical 221
evidence for these strategies is reviewed in Morrell and Romey (2008) and 222
discussed in Morrell and James (2008) and Morrell et al. (2011a, 2011b) in the 223
context of the selfish herd). If the predator appears within the group, we 224
calculate the mean group centre from the x and y coordinates of the prey at T, 225
and the maximum distance of all prey from the mean group centre. The predator 226
is placed at random within the circle described by these two parameters, 227
following a uniform distribution. Predators attacking from outside the group 228
appear at the edge of the circular arena (distance R from the arena centre), at a 229
location determined by an angle drawn from a random uniform distribution. 230
231
Once the predator location has been determined, the predator attacks the closest 232
prey item. We assume that an attack always occurs, and that all attacks result in 233
successful predation. The movement rule of the predated individual is recorded. 234
For simplicity, we assume that only one individual is predated, and that 235
individual is replaced in the next generation. To determine the movement rule of 236
the replacement individual, we calculate the proportion of surviving individuals 237
using each rule. If a random number drawn from a uniform distribution between 238
0 and 1 is less than Nm/N, the replacement individual follows the mutant 239
movement rule; otherwise it follows the population movement rule. Nm and Np 240
are updated in each generation for a total of 5000 generations, or until the 241
population fixes at a single movement rule (Nm or Np = N). This final movement 242
this fact is recorded. For each combination of movement rules, and for each set of 244
parameter values (see below), we ran 1000 replicates to give a final output of the 245
number of replicates ending in each of the three possible outcomes: mutant rule 246
fixes, population rule fixes, and mixture of rules remains. We standardised the 247
starting positions of both prey and predators for each combination of movement 248
rules and set of parameter values (Morrell et al. 2008), such that each set of 1000 249
replicates x 5000 generations was run with the same set of initial positions for 250
both predators and prey. 251
252
We compare the frequency at which each rule becomes fixed against random 253
expectation i.e. the proportion of simulations in which a rule is expected to fix if 254
predation is independent of movement rule (i.e. through drift). The probability of 255
such a ‘neutral’ mutant rule becoming fixed is equal to its frequency in the 256
population at the start of the simulation (i.e. Nm/N, Kimura 1962). Statistical 257
comparisons between model output and the expected frequency were made 258
using binomial tests (R v2.12.2, R Development Core Team 2011), corrected for 259
multiple testing (180 tests were run) using a Bonferroni correction. These 260
results are displayed on the figures. We found essentially similar results to those 261
represented here when we re-‐ran the model with different combinations of 262
parameter values caused by different discretization of strategy-‐space, so can be 263
relatively confident our results are robust in this regard. Our key findings are 264
summarised in table 2. 265
266
In contrast to previous work (Hamilton 1971; Morton et al. 1994; Viscido et al. 267
al. 2011a) we do not explicitly calculate the Domain of Danger (DOD; Hamilton 269
1971) or limited DOD (LDOD; James et al. 2004) for each individual. This is 270
implicitly captured in our assumption that predators target the nearest 271
individual, as the DOD describes the space around each individual that is closer 272
to it than to any other individual. Thus, when a predator attacks the closest 273
individual, it is by definition within the DOD of that individual. 274
275
Results 276
(a) Invasion success and predator attack strategy
277
Firstly, we investigated the effect of predator attack strategy (from within the 278
group or from outside it, prediction 1) and fixed attack time T of 20, 50 and 100 279
timesteps (equivalent to 2, 5 and 10 s, prediction 2) on the proportion of 280
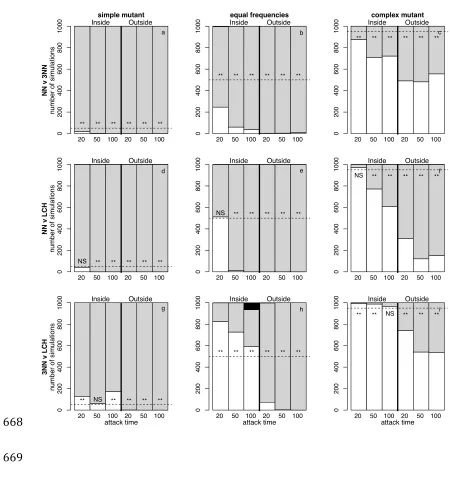
simulations ending with the fixation of each rule. We find that in general, 281
complex populations (groups where the field strategy is complex) are highly 282
stable against invasion by a single simpler mutant (figure 1a, d and g), with only 283
occasional instances of 3NN mutants becoming fixed in LCH populations (figure 284
1g). Otherwise, successful invasions by simpler rules are consistent with random 285
expectation, or worse. When both rules begin at equal frequencies (figure 1b, e 286
and h), the complex rule is likely to outcompete the simpler one and reach 287
fixation more often than expected by chance. The exception to this is at short 288
attack times when predators attack from within the group, when NN strategies 289
can reach fixation against LCH (figure 1e) at a rate consistent with chance, and 290
3NN reaches fixation at the expense of LCH (figure 1h). Logically, this is sensible: 291
in a short period of time, an individual moving towards a dense but more distant 292
(remaining isolated for longer), while an individual moving directly to that 294
neighbour reduces its risk rapidly (Morrell and James 2008). 295
296
More complex mutants can successfully reach fixation more often than expected 297
by chance in simpler populations (groups where the field strategy is simple) 298
(figure 1c, f and i), but they do not dominate the results, suggesting that simple 299
populations can be stable against single, more complex mutants. This is 300
particularly true when predators attack from the inside, when attack times are 301
shorter, and when the difference in rule complexity is smaller (i.e. NN v 3NN and 302
3NN v LCH, but less for NN v LCH). At fixed attack times, as expected, we see very 303
few situations where a mixture of rules is maintained in the population: the only 304
instance of this occurring is seen in figure 3h, at T = 100 and when predators 305
attack from within the group (see table 2 for a summary). 306
307
(b) Fixed versus variable attack timing
308
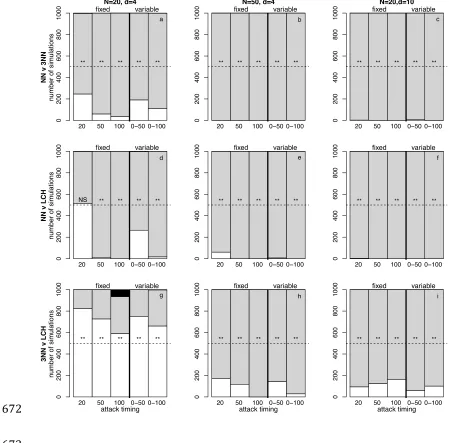
Next, we investigate the effect of variable attack timing (where attack timing is 309
drawn from a uniform distribution between 0 and Tmax) on the fixation of rules 310
(prediction 3). As we previously (figure 1) showed that mixtures might be 311
favoured particularly when groups start with equal frequencies of the two rules, 312
we explore this starting combination here. We find no evidence to suggest that 313
mixtures of rules are maintained in the population when attack time T is variable 314
(i.e. drawn from a random uniform distribution) for any pairwise combination of 315
movement rules at any of the three group size and density parameters we tested 316
(figure 2). 317
(c) Effects of population size and density
319
We did, however find that population size and density influenced the success of 320
different rules (prediction 4, figure 2). Increasing the size of the population 321
(comparing the left hand column of figure 2 where N = 20 to the central column 322
where N = 50) favours simpler rules at short attack times, for NN v LCH (at the 323
shortest attack time T = 20) and 3NN v LCH (at attack times T = 20, T = 50 and 324
both variable timings, but not at T = 100, where LCH is favoured by increasing 325
population size). Simple rules are not favoured by increasing population size for 326
NN v 3NN where 3NN is increasing favoured as group size increases (figure 2b), 327
or for NN v LCH, where LCH remains superior at attack times other than T = 20. 328
Increasing the density of the population (right hand column of figure 2) slightly 329
favours the fixation of more complex rules across all rule combinations. 330
331
(d) Effectiveness of 7NN
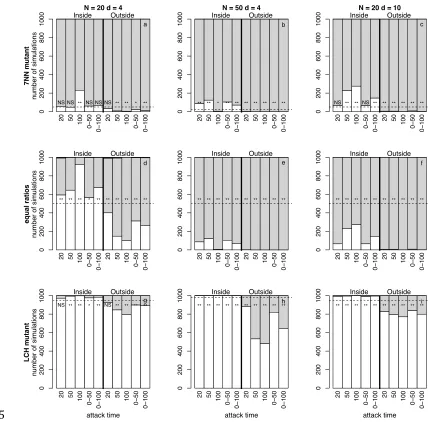
332
Both 7NN and LCH populations are generally stable against mutants using the 333
alternative rule (prediction 5, figure 3). In LCH populations, 7NN may come to 334
dominate in a small proportion of replicates, especially when predators attack 335
from within the group (figure 3a-‐c). 7NN populations, on the other hand, are 336
stable except when predators attack from outside the group, when LCH can 337
invade a small proportion of the time (figure 3g-‐i). Increasing density reduces 338
slightly population stability for both rules (figure 3c and i), but increasing 339
population size benefits only LCH mutants. When the rules begin at equal ratios 340
(figure 3d-‐f), 7NN fixes in a larger proportion of replicates when predators attack 341
from within the group, while LCH fixes in the majority of simulations when 342
population sizes (figure 3e) and differences are less marked in denser groups 344
(figure 3f). 345
346
Discussion 347
A key motivation for our study was a growing apparent incongruity in the 348
literature. On one hand, much of the theoretical literature on behaviours 349
underlying the selfish herd, including our results here, suggests that cognitively 350
more complex behavioural rules generally outperform simpler rules (Viscido et 351
al. 2002; Reluga and Viscido 2005; Morrell and James 2008; Morrell et al. 2011a). 352
On the other hand, empirically based works suggest that in most taxa studied the 353
behaviours that appear to underlie the formation and especially maintenance of 354
groups appear to be relatively simple, involving responsiveness to only a small 355
number of neighbouring individuals (Couzin and Krause 2003; Ballerini et al. 356
2008b; Ballerini et al. 2008a; Hildenbrandt et al. 2010; Katz et al. 2011; Bode et 357
al. 2011a; Bialek et al. 2012). Here we have been able to offer pointers towards a 358
resolution of this incongruity. In particular we show that the performance of 359
individuals with particular behaviours within a group is strongly positively 360
frequency dependent. Thus under a wide range of the situations explored in this 361
study we find that a mutant with a more complex movement rule can fail to 362
invade a population with a simpler rule, even in circumstances where the 363
complex rule would be evolutionarily stable to reinvasion by the simpler one if it 364
did reach numerical dominance in the population. Hence, if it is the case the 365
simple aggregation-‐linked movement rules are a common evolutionary 366
positive frequency dependence may mean that initial flourishing of simple rules 368
stops subsequent evolutionary spread of complex rules. 369
370
Although the idea that complex aggregation rules evolve from simpler ones is 371
highly plausible (Reluga and Viscido 2005), our results point to the considerable 372
benefit this field would gain from increasing our understanding of the evolution 373
the cognitive underpinning of such rules to test this conjecture. Little is known 374
about the relative costs of the different rules in relation to their apparent 375
complexity. Complex rules may carry cognitive costs associated with, for 376
example, information gathering either before or during a predation event, and 377
we suggest there is an urgent need for empirical investigation of the costs and 378
benefits of different movement rules, and for an evaluation of the effects of these 379
costs on the potential for different rules to evolve in nature. 380
381
Despite the pattern of strong positive frequency dependence in rule success, we 382
do find evidence that changing conditions (predator attack strategy, attack 383
timing and population size and density) shift the balance of rule success (Morrell 384
et al. 2011b; Morrell et al. 2011a). In line with our predictions we find some 385
evidence that peripheral attack strategies are more likely to favour the evolution 386
of complex rules (prediction 1, figure 1), and that those complex rules are more 387
likely to be favoured at later attack times (prediction 2, figure 1). We find no 388
evidence, however, that variation in attack timing supports the coexistence of 389
rules within a population (prediction 3, figure 2). We find that increased 390
success of simple rules, although this is not always the case (prediction 4, figure 392
2). 393
394
With respect to our prediction that 7NN and LCH are similarly successful, we find 395
partial support. The positive frequency dependence pattern is particularly strong 396
here, with successful invasions of single mutants occurring at low frequencies 397
under the majority of parameters assessed here. However, we see a particular 398
effect of predator attack strategy here in the equal ratios scenario: LCH 399
outperforms 7NN when predators attack from outside the group, while 7NN 400
succeeds when predators attack from within the group. This likely arises because 401
the more complex a rule is, the more effective it is in allowing individuals to 402
reach the centre of the group (Morrell et al. 2011b), where they are protected 403
from peripheral predators, while simpler rules allow for rapid reduction in 404
individual risk when predators attack from within the group (Morrell & James 405
2008, Morrell et al. 2011a). Thus, 7NN (as the simpler of the two) is favoured 406
when predators attack from within the group, and LCH (as the more complex) 407
when predators attack from outside. 408
409
Notice that our consideration of the relative fitness of different strategies 410
considers only within-‐group differences in expected fitness – and not between-‐ 411
group heterogeneity in predation risk. This is because a key assumption of the 412
selfish herd hypothesis is that there is no group-‐level variation in predation risk 413
(Hamilton 1971). Our simulations assumed that predators always attack and 414
attacks are always successful, thus any benefits that one individual in a group 415
increasing predation risk felt by one or more group-‐mates. This greatly simplifies 417
the scenarios that need to be explored in evaluating the likely evolutionary 418
trajectory of different behavioural rules. Specifically the per-‐capita average 419
predation risk of individuals in a group is independent of the distribution of 420
strategies played by individuals within that group, and so in considering whether 421
one strategy will prevail evolutionary, we need only consider the comparison of 422
strategies within a group without the added complicity of differential 423
performance of groups with different strategy mixes. Most importantly, if a 424
complex rule rose to numerical dominance within one group, we would not 425
expect this to allow that group to flourish differentially with respect to groups 426
using a simpler rule. 427
428
Our work also points to other ways in which the behaviours underlying group 429
formation through selfish herd effects might usefully be explored. In common 430
with all previous works we consider situationally-‐unresponsive rules (Hamilton 431
1971; Morton et al. 1994; Viscido et al. 2002; James et al. 2004; Reluga and 432
Viscido 2005; Morrell and James 2008; Morrell et al. 2011b; Morrell et al. 2011a). 433
That is, a given individual employs the same rule regardless of the situation it 434
finds itself in. However, it is easy to imagine that individuals could modify the 435
rule they use to drive their behaviour according to any number of factors: 436
including the size of the group they are in, population density, their position 437
relative to the group centre, time since the predator was first detected, 438
information transfer through the group (Bode et al. 2011b) and behaviours 439
observed in other individuals. As a simple example, an individual might utilise 440
and another rule if it perceives that it is one of the later-‐responders. It would be 442
interesting to explore whether a suite of simple situationally-‐responsive rules 443
can outperform a single more complex but situationally-‐unresponsive rule. 444
445
Another interesting issue worthy of further exploration is the ecological 446
robustness of rules. Different taxa will experience differences in the intensity and 447
nature of variation in predation scenarios encountered, but strict uniformity of 448
encounter of the type considered in most of our and previous theoretical 449
situations will not be the norm. That is, in the context of the scenario explored 450
here, a given individual may (over its lifetime) experience variation in the 451
number of individuals with which it might potentially form an aggregation, the 452
initial spatial density of those individuals, the time interval between first 453
detection of the predator and completed attack, and the position of the predator 454
relative to prey individuals at the point of first detection. One possible way to 455
cope with such environmental variability would be to have situationally-‐ 456
responsive rules of the type discussed above, and (for example) behave 457
differently when in a low-‐conspecific-‐density situation to a high-‐density one. 458
However, it may be that sometimes conspecific density (in this case) is difficult 459
for individuals to evaluate, and individuals do best of have a “robust” behavioural 460
rule which performs well when evaluated across the frequency distribution of 461
different environmental circumstances likely to be encountered by individuals. 462
Hence, another exciting avenue for the exploration of behavioural rules 463
underlying selfish herd aggregation behaviours is how environmental variation 464
in the types of predator-‐prey encounters experienced selects for either 465
strategies that would not be evolutionarily stable in a uniform environment of 467
one fixed type of predator-‐prey encounter but which offer good performance 468
when evaluated over a frequency distribution of different encounter types. 469
470
One last avenue worthy of exploration is error-‐tolerance. In common with 471
previous works, our evolutionary simulations assume that individuals utilising a 472
particular rule can gather all the information on conspecifics needed for the 473
implementation of that rule without error. This is likely to be a simplification of 474
reality, and it would be interesting to explore how the introduction of different 475
plausible error structures influences the relative performance of different rule 476
types. For example, it may be that errors in the evaluation of another individual 477
increase with increasing distance of that individual from the focal individual. If 478
errors are common and essentially independent when evaluating information on 479
different individuals this may select for more complex rules that obtain 480
stochastic cancellation of such errors (the “many wrongs principle” – discussed 481
in the literature on in group navigation decisions e.g. Simons 2004; Hancock et al. 482
2006; Biro et al. 2006; Codling et al. 2007; Faria et al. 2009). Additionally, errors 483
may be influenced by environmental factors such as ambient light levels. This 484
may offer the opportunity for empirical testing of theoretical predictions about 485
how behavioural rules might be expected to change in response to increased 486
error rates in information gathering (say as induced experimentally by lowering 487
ambient light levels). 488
489
Paul Bennett and Dick James wrote the original code on which this work was 491
based, Steve Moss assisted with additional programming, and Dick James 492
provided useful discussions. 493
494
References 495
Ballerini M, Cabibbo N, Candelier R, et al. (2008a) Interaction ruling animal 496
collective behavior depends on topological rather than metric distance: 497
Evidence from a field study. Proceedings of the National Academy of Sciences 498
105:1232–1237. doi: 10.1073/pnas.0711437105 499
Ballerini M, Cabibbo N, Candelier R, et al. (2008b) Empirical investigation of 500
starling flocks: a benchmark study in collective animal behaviour. Anim 501
Behav 76:201–215. doi: 10.1016/j.anbehav.2008.02.004 502
Bialek W, Cavagna A, Giardina I, et al. (2012) Statistical mechanics for natural 503
flocks of birds. P Natl Acad Sci Usa 109:4786–4791. doi: 504
10.1073/pnas.1118633109 505
Biro D, Sumpter DJT, Meade J, Guilford T (2006) From Compromise to 506
Leadership in Pigeon Homing. Current Biology 16:2123–2128. doi: 507
10.1016/j.cub.2006.08.087 508
Bode NWF, Faria JJ, Franks DW, et al. (2010) How perceived threat increases 509
synchronization in collectively moving animal groups. P R Soc B 277:3065– 510
3070. doi: 10.1098/rspb.2010.0855 511
Bode NWF, Franks DW, Wood AJ (2011a) Limited interactions in flocks: relating 512
model simulations to empirical data. Journal of The Royal Society Interface 513
8:301–304. doi: 10.1098/rsif.2010.0397 514
Bode NWF, Wood AJ, Franks DW (2011b) Social networks and models for 515
collective motion in animals. Behav Ecol Sociobiol 65: 117-‐130. doi: 516
10.1007/s00265-‐010-‐1111-‐0 517
Buhl J, Sumpter D, Couzin I, et al. (2006) From disorder to order in marching 518
locusts. Science 312:1402–1406. 519
Buhl J, Sword GA, Clissold FJ, Simpson SJ (2011) Group structure in locust 520
migratory bands. Behav Ecol Sociobiol 65:265–273. doi: 10.1007/s00265-‐ 521
010-‐1041-‐x 522
Codling EA, Pitchford JW, Simpson SD (2007) Group navigation and the “many-‐ 523
wrongs principle” in models of animal movement. Ecology 88:1864–1870. 524
doi: 10.1890/06-‐0854.1 525
vertebrates. Advances in the Study of Behavior, Vol 32 32:1–75. 527
Davies NB, Krebs JR, West SA (2012) An Introduction to Behavioural Ecology, 4 528
ed. Wiley-‐Blackwell, Chichester 529
De Vos A, O'Riain MJ (2012) Movement in a selfish seal herd: do seals follow 530
simple or complex movement rules? Behav Ecol. doi: 531
10.1093/beheco/ars153 532
Faria JJ, Codling EA, Dyer JRG, et al. (2009) Navigation in human crowds; testing 533
the many-‐wrongs principle. Anim Behav 78:587–591. doi: 534
10.1016/j.anbehav.2009.05.019 535
Foster W, Treherne J (1981) Evidence for the dilution effect in the selfish herd 536
from fish predation on a marine insect. Nature 293:466–467. 537
Giardina I (2008) Collective behavior in animal groups: Theoretical models and 538
empirical studies. HFSP Journal 2:205–219. doi: 10.2976/1.2961038 539
Hamilton W (1971) Geometry for the selfish herd. J Theor Biol 31:295–311. 540
Hancock PA, Milner-‐Gulland EJ, Keeling MJ (2006) Modelling the many-‐wrongs 541
principle: the navigational advantages of aggregation in nomadic foragers. J 542
Theor Biol 240:302–310. doi: 10.1016/j.jtbi.2005.09.019 543
Hildenbrandt H, Carere C, Hemelrijk CK (2010) Self-‐organized aerial displays of 544
thousands of starlings: a model. Behav Ecol 21:1349–1359. doi: 545
10.1093/beheco/arq149 546
Huth A, Wissel C (1992) The simulation of the movement of fish schools. J Theor 547
Biol 156:365–385. 548
Huth A, Wissel C (1994) The simulation of fish schools in comparison with 549
experimental data. Ecological Modelling 75:135–146. 550
James R, Bennett P, Krause J (2004) Geometry for mutualistic and selfish herds: 551
the limited domain of danger. J Theor Biol 228:107–113. 552
Katz Y, Tunstrom K, Ioannou CC, et al. (2011) Inferring the structure and 553
dynamics of interactions in schooling fish. P Natl Acad Sci Usa 108:18720– 554
18725. doi: 10.1073/pnas.1107583108 555
Kimura M (1962) On the probability of fixation of mutant genes in a population. 556
Genetics 47:713–719. 557
King AJ, Wilson AM, Wilshin SD, et al. (2012) Selfish-‐herd behaviour of sheep 558
under threat. Current Biology 22:R561–R562. doi: 559
10.1016/j.cub.2012.05.008 560
Krakauer D (1995) Groups confuse predators by exploiting perceptual 561
Sociobiol 36:421–429. 563
Krause J, Ruxton G (2002) Living in Groups. Oxford University Press, Oxford 564
Krause J, Tegeder R (1994) The mechanism of aggregation behaviour in fish 565
shoals: individuals minimize approach time to neighbours. Anim Behav 566
48:353–359. 567
Miller R (1922) The significance of the gregarious habit. Ecology 3:122–126. 568
Morrell LJ, James R (2008) Mechanisms for aggregation in animals: rule success 569
depends on ecological variables. Behav Ecol 19:193–201. 570
Morrell LJ, Romey W (2008) Optimal individual positions within animal groups. 571
Behav Ecol 19:909–919. doi: 10.1093/beheco/arn050 572
Morrell LJ, Ruxton GD, James R (2011a) The temporal selfish herd: predation risk 573
while aggregations form. P R Soc B 278:605–612. doi: 574
10.1098/rspb.2010.1605 575
Morrell LJ, Ruxton GD, James R (2011b) Spatial positioning in the selfish herd. 576
Behav Ecol 22:16–22. doi: 10.1093/beheco/arq157 577
Morton T, Haefner J, Nugala V, et al. (1994) The Selfish Herd revisited: do simple 578
movement rules reduce relative predation risk. J Theor Biol 167:73–79. 579
R Development Core Team (2011) R: A language and environment for statistical 580
computing. R Foundation for Statistical Computing, Vienna, Austria. ISBN 3-‐ 581
900051-‐07-‐0, URL http://www.R-‐project.org/. (last accessed 21 October 582
2014) 583
Reluga T, Viscido S (2005) Simulated evolution of selfish herd behavior. J Theor 584
Biol 234:213–225. 585
Roberts G (1996) Why vigilance declines as group size increases. Anim Behav 586
51:1077-‐86 587
Simons A (2004) Many wrongs: the advantage of group navigation. Trends in 588
Ecology & Evolution 19:453–455. 589
Spieler M, Linsenmair K (1999) Aggregation behaviour of Bufo maculatus 590
tadpoles as an antipredator mechanism. Ethology 105:665–686. 591
Turner G, Pitcher T (1986) Attack abatement: a model for group protection by 592
combined avoidance and dilution. American Naturalist 128:228–240. 593
Viscido S, Miller M, Wethey D (2002) The dilemma of the selfish herd: The search 594
for a realistic movement rule. J Theor Biol 217:183–194. 595
Viscido S, Wethey D (2002) Quantitative analysis of fiddler crab flock movement: 596
Watt P, Nottingham S, Young S (1997) Toad tadpole aggregation behaviour: 598
evidence for a predator avoidance function. Anim Behav 54:865–872. 599
Wood A, Ackland G (2007) Evolving the selfish herd: emergence of distinct 600
aggregating strategies in an individual-‐based model. P R Soc B 274:1637– 601
1642. 602
Figure legends: 605
Figure 1: Number of simulations resulting in fixation for the simpler (white 606
shading), more complex (grey shading), or neither (black shading) rule, for 3 607
scenarios (columns) and three movement rule combinations (rows). Each 608
column represents a different invasion scenario: a simple rule invading a more 609
complex population (left hand column, a, d and g), a more complex rule invading 610
a simple population (right hand column, c, f and i), and a situation where both 611
rules begin at equal frequencies (central column, b, e and h). Each row 612
represents a different pairwise combination of movement rules: NN v 3NN (top 613
row, a-‐c), NN v LCH (middle row, d-‐f) and 3NN v LCH (bottom row, g-‐i). In each 614
case the simpler rule is specified first (see table 1). The horizontal dashed line 615
represents the expected proportion of simulations in which the simpler rule 616
would be expected to fix if predation were random with respect to movement 617
rule, ** indicates significant deviation from random expectation at p < 0.001, NS 618
indicates no significant deviation from random expectation. Each panel shows 619
the outcome for 3 different fixed attack times (20, 50 and 100 timesteps) when 620
the predator attacks from within the group (left of the thick vertical line) and 621
from outside the group (right of the thick vertical line). Other parameters: N = 622
20, d = 4. 623
624
Figure 2: Number of simulations resulting in fixation for the simpler (white 625
shading), more complex (grey shading), or neither (black shading) rule, for three 626
movement rule combinations and when predators attack from within the group. 627
the thick vertical line) attack timings for populations of N = 20 (left column, a, c, 629
e) and N = 50 (right column (b, d, f). Three combinations of rules are shown, both 630
begin at equal frequencies in the population: top row: NN v 3NN, middle row: NN 631
v LCH, bottom row: 3NN v LCH. Results are shown at three different population 632
size/density combinations: left column: N=20, d=4 (baseline), middle column: 633
N=50, d=4 (increased population size) and right column: N=20, d=10 (increased 634
population density). The horizontal dashed line represents the expected 635
proportion of simulations in which the simpler rule would be expected to fix if 636
predation were random with respect to movement rule, ** indicates significant 637
deviation from random expectation at p < 0.001, NS indicates no significant 638
deviation from random expectation. 639
640
Figure 3: Number of simulations resulting in fixation for the 7NN (white 641
shading), LCH (grey shading), or neither rule (black shading) for pairwise 642
contests between 7NN and LCH, for 3 invasion scenarios (rows) and three 643
population size and density combinations (columns). The left column shows data 644
for N=20, d=4 (a, d, g). In the middle column group size is increased to N=50 645
while keeping d=4, and in the right column density is increased to d=10 while 646
keeping N=20. The top row shows a 7NN mutant against and LCH population, 647
while the middle row shows the results from equal starting frequencies, and the 648
bottom row shows an LCH mutant in a 7NN population. Each panel shows both 649
fixed and variable attack times (x-‐axis) and predators that attack from inside 650
(left hand columns) and outside (right hand columns) the group (separated by 651
proportion of simulations in which the simpler rule would be expected to fix if 653
predation were random with respect to movement rule, * indicates significant 654
deviation from random expectation at p < 0.05, ** at p < 0.001 and NS indicates 655
no significant deviation from random expectation. 656
657
Tables and Figures 659
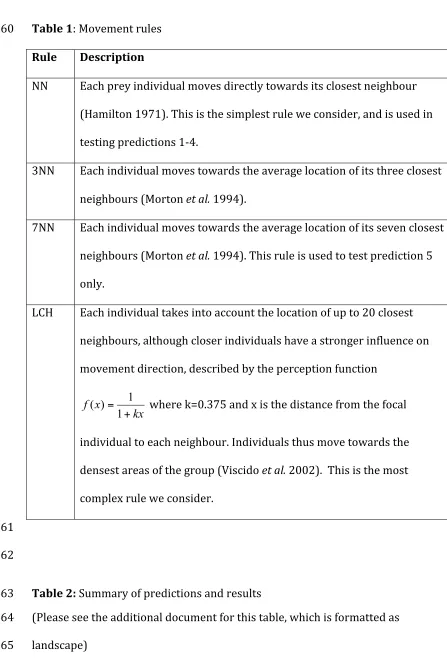
Table 1: Movement rules 660
Rule Description
NN Each prey individual moves directly towards its closest neighbour (Hamilton 1971). This is the simplest rule we consider, and is used in testing predictions 1-‐4.
3NN Each individual moves towards the average location of its three closest neighbours (Morton et al. 1994).
7NN Each individual moves towards the average location of its seven closest neighbours (Morton et al. 1994). This rule is used to test prediction 5 only.
LCH Each individual takes into account the location of up to 20 closest neighbours, although closer individuals have a stronger influence on movement direction, described by the perception function
kx x
f
+ =
1 1 )
( where k=0.375 and x is the distance from the focal
individual to each neighbour. Individuals thus move towards the densest areas of the group (Viscido et al. 2002). This is the most complex rule we consider.
661
662
Table 2: Summary of predictions and results 663
(Please see the additional document for this table, which is formatted as 664
[image:28.595.58.505.89.748.2]