A Thesis Submitted for the Degree of PhD at the University of Warwick
http://go.warwick.ac.uk/wrap/3787
This thesis is made available online and is protected by original copyright. Please scroll down to view the document itself.
Development and Application of
Evanescent Wave Cavity Ring-Down
Spectroscopy for Studies of
Electrochemical and Interfacial
Processes
by
Mathias Schnippering
A thesis submitted for the degree of Doctor of Philosophy
University of Warwick
Contents
LIST OF FIGURES ... IV
LIST OF TABLES ... X
ACKNOWLEDGEMENTS... XI
DECLARATION ... XII
ABBREVIATIONS ... XV
GLOSSARY OF SYMBOLS ... XVII
ABSTRACT ... XIX
1 INTRODUCTION ... 1
1.1 CAVITY RING-DOWN SPECTROSCOPY ... 2
1.1.1 Gas Phase CRDS ... 2
1.1.2 Condensed Phase CRDS ... 8
1.2 EVANESCENT WAVES ... 10
1.3 ATTENUATED TOTAL INTERNAL REFLECTION SPECTROSCOPY... 13
1.4 OTHER SURFACE SENSITIVE CHARACTERISATION METHODS ... 14
1.5 EVANESCENT WAVE CAVITY RING-DOWN SPECTROSCOPY ... 17
1.6 LIGHT SOURCES IN EW-CRDS ... 19
1.6.1 Diode Lasers ... 20
1.6.2 Pulsed dye lasers and optical parametric oscillators (OPOs) ... 20
1.7 CAVITY CONFIGURATIONS IN EW-CRDS ... 21
1.7.1 Ring Cavity ... 22
1.7.2 Folded Cavity ... 24
1.7.3 Linear (Dove) Cavity... 25
1.7.4 Pellin-Broca cavity... 25
1.7.5 Monolithic Resonators ... 26
1.7.6 Fibre Loops ... 28
1.8 BROADBAND CAVITY ENHANCED ABSORPTION SPECTROSCOPY ... 29
1.9 APPLICATIONS OF EW-CRDS ... 30
1.9.1 Gas/Solid Interface... 31
1.9.2 Solid/Liquid Interface... 32
1.9.3 Liquid/Air Interface ... 42
1.10 ATOMIC FORCE MICROSCOPY... 43
1.11 ELECTROCHEMICAL TECHNIQUES ... 46
1.12 NANOSTRUCTURED SURFACES ... 47
1.13 AIM OF THE THESIS ... 48
1.14 REFERENCES ... 51
2 EXPERIMENTAL ... 56
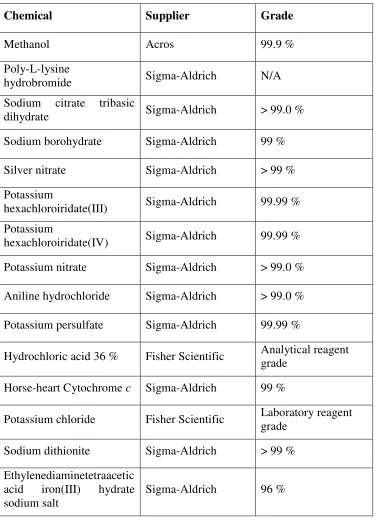
2.1 CHEMICALS ... 56
2.2 TM-AFMINSTRUMENTATION ... 57
2.3 ELECTROCHEMICAL MEASUREMENTS ... 58
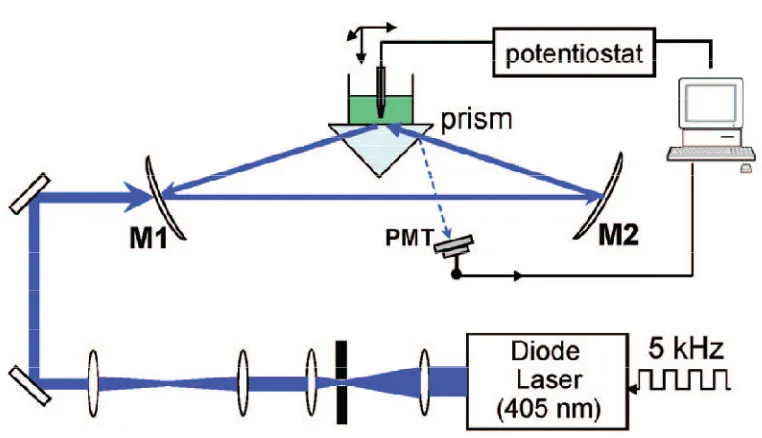
3 THE EW-CRDS SETUP ... 59
3.1 LIGHT SOURCE ... 60
3.2 OSCILLOSCOPE ... 61
3.3 OPTICS ... 61
3.3.1 Cleaning Procedure ... 61
3.3.2 Turning Mirrors ... 62
3.3.3 Cavity Mirrors ... 62
3.3.4 Prism ... 63
3.3.5 Cells ... 66
3.4 PHOTOMULTIPLIER TUBES ... 66
3.5 ALIGNMENT PROCEDURE ... 67
3.5.1 Safety Considerations... 67
3.7 DATA ACQUISITION ... 73
3.7.1 EW-CRDS Signal Acquisition ... 73
3.7.2 Electrochemistry Data Acquisition ... 74
3.8 SOFTWARE ... 74
3.8.1 EW-CRDS LabVIEW program ... 75
3.8.2 Electrochemistry LabVIEW program ... 78
3.9 REFERENCES... 80
4 SURFACE ASSEMBLY AND REDOX DISSOLUTION OF SILVER NANOPARTICLES ... 81
4.1 INTRODUCTION ... 82
4.2 THEORY ... 84
4.2.1 The Diffusional problem ... 85
4.2.2 Modelling changes in interfacial absorbance ... 87
4.3 EXPERIMENTAL SECTION... 88
4.3.1 Synthesis of Ag nanoparticles and sample preparation ... 88
4.3.2 Ag nanoparticle adsorption ... 90
4.3.3 Chronoamperometric EW-CRDS ... 90
4.3.4 Flow EW-CRDS ... 92
4.4 RESULTS AND DISCUSSION... 94
4.4.1 TM-AFM ... 94
4.4.2 Ag nanoparticle adsorption ... 95
4.4.3 Electrochemical dissolution ... 99
4.4.4 Convective Dissolution ... 104
4.5 CONCLUSIONS ... 106
4.6 REFERENCES... 107
5 REAL TIME MONITORING OF POLYANILINE NANOPARTICLE FORMATION ON SURFACES ... 109
5.1 INTRODUCTION ... 110
5.2 EXPERIMENTAL SECTION... 113
5.2.1 Tapping mode atomic force microscopy ... 113
5.2.2 Electrochemical measurements ... 113
5.3 RESULTS AND DISCUSSION... 114
5.3.1 TM-AFM ... 114
5.3.2 Electrochemical Measurements ... 117
5.3.3 UV-vis spectroscopy ... 120
5.3.4 EW-CRDS Measurements ... 121
5.4 CONCLUSIONS ... 129
5.5 REFERENCES... 130
6 MONITORING THE ELECTROCHEMICAL REDUCTION OF CYTOCHROME C IMMOBILISED ON SILICA ... 133
6.1 INTRODUCTION ... 133
6.2 EXPERIMENTAL ... 135
6.2.1 Materials ... 135
6.2.2 UV-vis Spectroscopy ... 135
6.2.3 EW-CRDS... 136
6.2.3.1 Comparison of the ps laser setup to the diode laser setup ... 137
6.2.4 Electrochemistry ... 138
6.3 RESULTS AND DISCUSSION ... 139
6.3.1 Calculation of pulse duration ... 139
6.3.2 UV-vis Spectroscopy ... 141
6.3.3 Adsorption of cytochrome c on silica ... 142
6.3.4 Reduction of cytochrome c by electrogenerated FeEDTA2- ... 144
6.4 CONCLUSIONS ... 151
6.5 REFERENCES... 153
7.1 INTRODUCTION ... 156
7.2 EXPERIMENTAL SECTION... 158
7.2.1 EW-BB-CEAS apparatus ... 158
7.2.2 Electrochemical measurements ... 159
7.3 RESULTS AND DISCUSSION ... 160
7.3.1 UV-vis Spectroscopy ... 160
7.3.2 EW-BB-CEAS Experiments ... 161
7.4 CONCLUSIONS ... 167
7.5 REFERENCES... 169
List of Figures
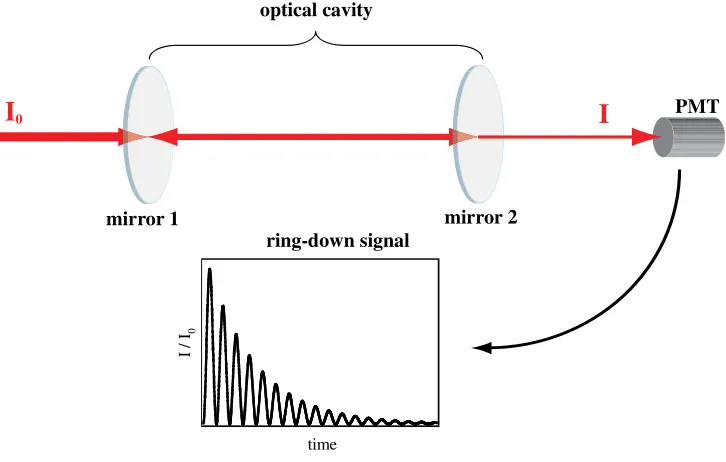
Figure 1.1: Schematic representation of a (linear) Fabry-Perot cavity. The light beam with intensity I0 enters the cavity from the left
through mirror 1. The light intensity, which decays
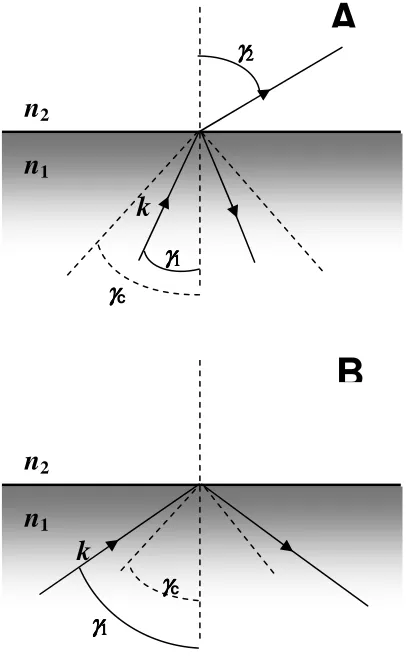
exponentially with time due to the non-perfect reflectivity of the mirrors and absorption within the cavity, partly leaks out behind mirror 2 and is measured with a photomultiplier tube (PMT)... 4 Figure 1.2: Schematic representation of an interface consisting of two
media with different refractive indices. An incoming electromagnetic wave k is reflected and transmitted at the interface. ... 10 Figure 1.3: Schematic representation of an interface consisting of two
media with different refractive indices. In both cases, n2 < n1. If
the angle of incidence is smaller than the critical angle, the incoming electromagnetic wave k is reflected and transmitted at the interface (A). If the angle of incidence is larger than the critical angle, then the wave is totally internal reflected (B). .. 11 Figure 1.4: Schematic representation of a typical ATR setup. The incident
light beam undergoes multiple TIR events. The attenuated beam escaping from the other end of the ATR crystal is
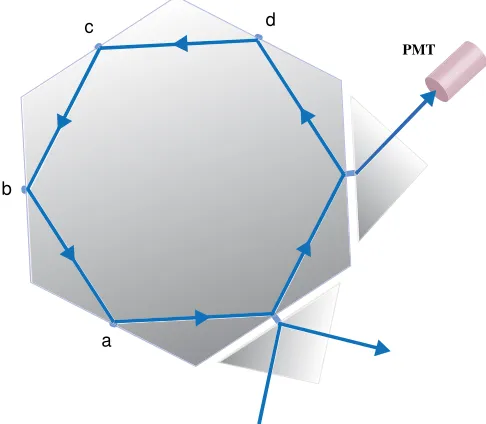
measured with a detector. ... 14 Figure 1.5: The hexagonal monolithic cavity as used by Pipino et al..48 The
incoming light beam is totally reflected by prism A. The
evanescent wave then excites the modes of the optical cavity by photon tunneling. At the surfaces (a) – (d) evanescent waves are established which can be used to obtain absorption spectra. The decrease of the light intensity is measured by coupling the light out of the resonator using prism C. ... 18 Figure 1.6: Schematic representation of a ring cavity setup. ... 22 Figure 1.7: Typical ring-down trace for a ring cavity. ... 23 Figure 1.8: Schematic representation of a folded cavity. The beam enters
the prism perpendicularly and therefore no antireflective coating is needed. The alignment procedure is slightly more challenging and the prisms are not commercially available. The major advantage of this configuration is the possibility to carry out polarisation-dependent measurements. ... 24 Figure 1.9: Schematic representation of a linear cavity employing a Dove
prism. ... 25 Figure 1.10: Schematic representation of a Pellin-Broca cavity as used by
Pipino et al.65 The beam enters and leaves the prism at
Figure 1.11: A) Schematic representation of a polygonal monolithic resonator. B) An experimental setup using a folded cavity configuration within a monolithic resonator. ... 28 Figure 1.12: A) Schematic of the thin layer cell configuration. B)
Ferricyanide concentration recorded in the region of the evanescent field as a function of time during a CV (5 mV s-1) for an electrode-surface distance of 25 ± 1 µm. The
corresponding red and green lines show simulations based on finite element modelling. (Taken from Ref63) ... 34 Figure 1.13: Absorbance transients for the adsorption of 5 nm Au
nanoparticles onto a PLL-modified silica surface. After 10 min, the maximal coverage has been achieved. TM AFM (after 25 min) shows no evidence of particle aggregation (Taken from Ref.83) ... 39 Figure 1.14: Absorbance transient for the adsorption of 20 nm Au
nanoparticles onto a PLL-modified silica surface (Taken from Ref.83). ... 39 Figure 1.15: Interfacial absorbance as a function of time for several Au
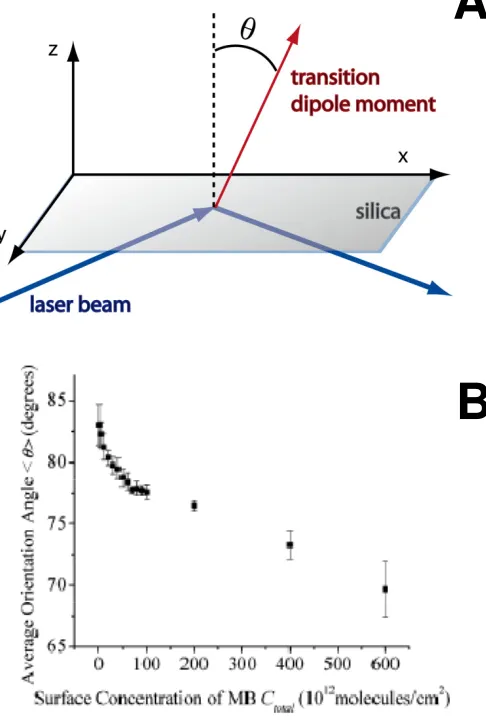
nanoparticle adsorption steps. The colloids and the PLL were added sequentially, as indicated, to form multilayer structures (Taken from Ref.83)... 40 Figure 1.16: A) Molecular orientation of Methylene Blue at the prism
surface. B) The average orientation angle as a function of Methylene Blue surface concentration. At low concentrations, all molecules lie flat on the surface (Taken from Ref.53). ... 41 Figure 1.17: Schematic of an EW-CRDS setup to investigate liquid/air and liquid/liquid interfaces. ... 43 Figure 1.18: Schematic of an AFM approach curve. ... 44 Figure 1.19: Schematic setup of the AFM experiments. ... 45 Figure 3.1: Mirror transmission for the Los Gatos Research 405 nm cavity
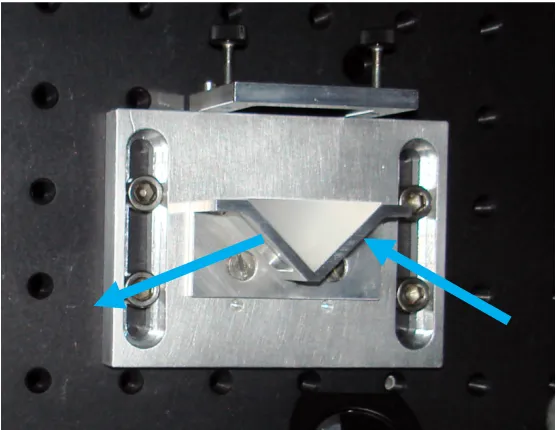
mirrors as a function of wavelength. The coating was optimised for high reflectivity at 405 nm with a transmission of less than 0.003 %. (taken from Ref.2) ... 63 Figure 3.2: Schematic representation of the right angle prism used for most experiments. The dimensions are displayed in mm. ... 64 Figure 3.3: Photograph of the prism holder and prism mounted on the
blackboard. ... 65 Figure 3.4: Schematic representation of the alignment of the 405 nm ring
cavity. ... 68 Figure 3.5: Schematic representation of the telescope used in the
experimental EW-CRDS setup. The first lens, where the laser beam enters the telescope (L1) had a focal length (f1) of 75 mm,
whilst the second lens (L2) had a focal length (f2) of 35 mm. . 68
Figure 3.6: Screenshot of the oscilloscope. Channel 1 (orange) displays the modulation signal from the TTL modulation generator.
Channel 2 corresponds to the PMT signal. ... 71 Figure 3.7: Schematic representation of the electrochemical part of the
Figure 3.8: Screenshot of the front panel of the LabVIEW program used for CRDS and CV experiments. A) Settings for the
EW-CRDS and CV experiments, B) Start switch for performing an electrochemical experiment (CV) and time stamps for data synchronisation, C) Plots for data display, top: ring-down time as a function of time, bottom left: applied potential for CV experiments, bottom right: CV response. ... 75 Figure 3.9: Experimental single ring-down trace for an empty ring cavity as
read by the EW-CRDS program. The red line corresponds to a single-exponential fit. Usually multiple ring-down traces will be averaged and the ring-down time will be calculated using the FFT method. The corresponding decay (ring-down time) in this example was 220 ns. ... 76 Figure 3.10: Screenshot of the sub VI responsible for converting the
ring-down traces into ring-ring-down times. ... 78 Figure 3.11: Screen shot of the program code of the electrochemistry VI. 79 Figure 4.1: Chemical structure of poly-L-lysine at pH 7... 89 Figure 4.2: CV of a 1 mM IrCl63- solution in 0.1 M KNO3 using a 25 µm
diameter Pt UME. The scan rate was 20 mV s-1. ... 91 Figure 4.3: a) IrCl62- is electrogenerated from IrCl63- in an axisymmetric
thin layer electrochemical cell, whilst in b) IrCl62- solution is
injected in close proximity to the surface via a 300 µm internal diameter micropipette. ... 92 Figure 4.4: Optical micrograph of a typical borosilicate glass capillary (end on view). ... 93 Figure 4.5: Top: Representative 1 µm x 1 µm tapping mode AFM image of Ag nanoparticles on PLL modified quartz following adsorption for 2 min. Bottom: Statistical analysis of particle size from which a mean particle size of 7.6 (± 2.6) nm was obtained from several images. ... 94 Figure 4.6: Bulk UV-visible absorbance spectra for different dilutions of
Ag nanoparticles in water. The large band at 400 nm
corresponds to the localised surface plasmon resonance band of Ag. Inset: Peak absorbance versus colloid concentration. ... 96 Figure 4.7: Interfacial absorbance transients for the adsorption of several
dilutions of nanoparticles on PLL modified fused silica. The dilutions are: 1:10, 1:20, 1:30, 1:50 and 1:100. The red lines denote fits assuming diffusion-controlled (∝ t1/2) adsorption kinetics. ... 98 Figure 4.8: Current – time transient for a 10 s potential step experiment in a
thin layer cell experiment for the oxidation of 0.1 mM IrCl63- to
IrCl62- in 0.1 M KNO3 using a 2 mm diameter Pt disc electrode.
The potential was stepped from -0.1 V to +0.4 V vs. Pt. ... 99 Figure 4.9: Interfacial absorbance transients for the electrochemical
dissolution of Ag nanoparticles using 1 mM IrCl63- oxidised for
potential step and 2.8 x 10⁻³ cm s-1 for the 10 s potential step were extracted. ... 100 Figure 4.10: Interfacial absorbance transient for the electrochemical
dissolution of Ag nanoparticles using 0.1 mM IrCl63- oxidised
for 600 s. The red line indicates a fit obtained using the model described in the text from which a dissolution rate constant of 2.8 x 10⁻³ cm s-1 was extracted. ... 101 Figure 4.11: EW-CRDS absorbance transients for 4 sequenced potential
step experiments (The IrCl63- concentration was 1 mM). The
potential step time was a) 10 s, b) 10 s, c) 10 s, d) 20 s... 103 Figure 4.12: (a): Interfacial absorbance transients showing the dissolution
of Ag nanoparticles using the micropipette setup with IrCl6
2-solution concentrations of A) 0.1 µM, B) 0.5 µM, C) 1 µM. A constant flow of IrCl62-, 16.6 µL s-1,was used for all
measurements. (b): Dissolution of Ag nanoparticles using the micropipette setup with 1µΜ IrCl62- solution flow rates of A)
1.7 µL s-1, B) 8.3 µL s-1, C) 33.3 µL s-1. ... 105 Figure 5.1: A) 2 µm x 2 µm ex situ TM-AFM image of PAni nanoparticles polymerised for 3 min from a 0.2 M monomer concentration on a quartz sample. The z range was 16.5 nm B) Statistical
analysis of PAni nanoparticle size from which a mean particle size of 5.8 (± 1.3) nm was obtained. ... 114 Figure 5.2: 1 µm x 1 µm ex situ TM-AFM (A), amplitude (B) and phase
(C) image of PAni nanoparticles polymerised for 5 min from a 0.2 M monomer concentration on a quartz sample. The z range in A was 52 nm. The line scan in A is displayed in D. ... 115 Figure 5.3: Ex situ TM-AFM images of PAni. The scan range of all images is 1 µm x 1 µm. The polymerisation process was stopped after different times ranging from 2 min to 6 min and several images were recorded. The aniline concentration was kept constant at 0.2 M. ... 116 Figure 5.4: Polymer particle surface coverage as a function of the
polymerisation time determined from TM-AFM... 117 Figure 5.5: a) CVs of PAni polymerised for 6 min from a 0.2 M monomer
solution onto an ITO electrode (unbiased during the
polymerisation process). Voltammetric measurements were carried out at scan rates ranging from 0.01 V s-1 to 0.2 V s-1. b) The peak current (first anodic peak) vs. scan rate for the above CVs. ... 119 Figure 5.6: CVs of PAni polymerised for 3 min (red) and 5 min (blue)
from a 0.2 M monomer solution onto an ITO electrode (unbiased during the polymerisation process). The scan rate was 0.2 V s-1 for both measurements. ... 120 Figure 5.7: UV-vis spectrum of PAni nanoparticles on quartz after a
replaced by the monomer solution, C) sodium persulfate was added, starting the polymerisation, D) polymerisation process was stopped by replacing the solution with water. ... 122 Figure 5.9: Absorbance transients measured by EW-CRDS for monomer
concentrations of a) 0.2 M, b) 0.1 M and c) 0.05 M. ... 123 Figure 5.10: a) The polymerisation rate constant as a function of time for a
typical EW-CRDS experiment using an aniline concentration of 0.1 M. The data were obtained from absorbance data that were converted to the polymerisation rate constant using eq. 5.11. b) The average polymerisation rate constant (from eq. 5.11) taken from 9 different experiments as a function of PAni nanoparticle radius (from eq. 5.9). ... 127 Figure 6.1: Schematic of the laser setup. The light pulses were generated
using a Ti-Saphire laser. The chosen wavelength of 400 nm was obtained by SHG using a Type I BBO crystal. The BBO crystal for third harmonic generation (THG) was used to generate 266 nm light for a separate experiment. The pulse duration was stretched subsequently by two mirrors, a 1 m fused silica rod and a 20 m optical fibre. Calculations
concerning the pulse duration can be found in the text. ... 137 Figure 6.2: Typical ring-down traces for A) the diode laser used for the
work in Chapters 4 and 5 and B) the fs laser used in this chapter. In both graphs, two traces are overlaid. The error bars are calculated using the standard deviation of the two traces at each data point. ... 138 Figure 6.3: UV-vis spectra of the oxidised (blue) and reduced form of
cytochrome c. The black dashed line represents the wavelength of the laser used for the EW-CRDS experiments. ... 142 Figure 6.4: EW-CRDS response for the adsorption of 5 µM cytochrome c
in 0.1 M KCl. The solution was introduced after 34.2 s (blue line). After 148 s the solution was removed and the surface washed with 0.1 M KCl. ... 143 Figure 6.5: A) Potential applied to the Pt macroelectrode as a function of
time. The potential was stepped from 0.0 V to – 0.5 V vs. Ag/AgCl at t = 0 for 60 s. B) Corresponding current transient as measured by the potentiostat. ... 145 Figure 6.6: EW-CRDS transients for the electrochemical oxidation of
adsorbed layers of cytochrome c on silica using a concentration of FeEDTA2- of 0.5 mM (red), 0.75 mM (blue) and 1 mM (green). The best fits to the model (black lines) yielded rate constants of 4.0 x 10⁻⁹ cm s-1, 4.0 x 10⁻⁹ cm s-1 and 5.0 x 10⁻⁹ cm s-1 for FeEDTA2- concentrations of 0.5 mM, 0.75 mM and 1 mM, respectively. ... 147 Figure 6.7: Ring-down time as a function of time for a potential step
experiment (step time: 60 s) using 1 mM FeEDTA- with no cytochrome c present. ... 148 Figure 7.1:The broadband evanescent-wave cavity enhanced spectrometer
Figure 7.2:UV-vis spectra of 0.5 mM [IrCl6]3- (black) and [IrCl6]2- (red)
solutions. The blue curve indicates the spectrum of the filtered supercontinuum radiation and the green line the region of high mirror reflectivity for the first set of EW-BB-CEAS
experiments (R>0.999). ... 160 Figure 7.3:Contour plots of the interfacial absorption spectra of
electrogenerated [IrCl6]2- as a function of time during (A) a
chronoamperometric step experiment and (B) a CV experiment. ... 162 Figure 7.4:Measured (black) and simulated (red) interfacial [IrCl6]2-
concentration during (A) a 120 s chronoamperometry
experiment (120 s at 0.8 V vs. Ag/AgCl) and (B) a CV (5 mV s-1). The measured (blue) and simulated (green) current
transients are also shown. ... 163 Figure 7.5: A) Raw reference and signal spectra recorded for a sample of
10 mM [IrCl6]2- using the broadband coated mirrors. The mirror
reflectivity as a function of wavelength is shown above. B) The extracted relative absorbance spectrum for the 10 mM [IrCl6]2-
solution. The loss per round trip with in the CEAS folded cavity was extracted by taking the ratio of the signal to the (single pass) UV-vis spectrum of 2 mM [IrCl6]2- scaled for the
(wavelength dependent) effective thickness (inset). ... 165 Figure 7.6: a) Contour plot of the interfacial absorbance spectrum as a
function of time during electrochemical generation of [IrCl6]2-
List of Tables
Table 1.1: The conditions and definitions for a range of different optical cavities. ... 5 Table 2.1: Grades and suppliers of chemicals used in this project. ... 57 Table 3.1: Parameters for the right angle prism provided by the
Acknowledgements
Firstly, I would like to thank Prof. Pat Unwin for his help, support and advice throughout this PhD. Without his enthusiasm and encouragement, this thesis would not have been possible. Thanks must go to Dr. Stuart Mackenzie at the University of Oxford and Dr. Mikhail Mazurenka whose help and expertise was invaluable. I would like to thank Prof. Julie Macpherson for all her support and Dr. Vas Stavros for much needed advice in laser spectroscopy. Also thanks to our collaborates at the Chemical Engineering Department of the University of Cambridge, Dr. Johan Hult and Dr. Toni Laurila as well as Dr. Justin Langridge from the Chemistry Department of the University of Cambridge.
Special thanks must go to my lab buddy Hayley Powell without her continuous support (finite element modelling and common sense) and her cheerfulness nothing would have worked in the lab. Also thanks to Dr. Meiqin Zhang for all her help with electrochemical measurements.
I would also like to than all the members of the Electrochemistry and Interfaces group at Warwick. Huge thanks especially to the „C111 crew“ (past and current members) for all their support and friendship. Thanks to Massimo, Martin and Mike OC for all the useful scientific and non-scientific discussions.
Declaration
The work presented in this thesis is entirely original and my own work,
except where acknowledged in the text. I confirm that this thesis has not been submitted for a degree at another University.
The theoretical models presented in chapter 4 and 6 were created together with Hayley Powell. Hayley Powell also contributed to evanescent wave cavity ring-down spectroscopy and UV-vis experiments in chapter 6.
Dr. Meiqin Zhang performed the scanning electrochemical microscopy experiments in chapter 5.
Broadband cavity enhanced absorption spectroscopy was carried
out in collaboration with Mikhail Mazurenka, Simon Neil, Stuart Mackenzie (University of Oxford) and Toni Laurila, Johan Hult, Clemens
Kaminski, Justin Langridge, Rod Jones (University of Cambridge).
Parts of this thesis have been published or submitted for publication as detailed below:
Mathias Schnippering, Hayley V. Powell, Meiqin Zhang, Julie V.
Macpherson, Patrick R. Unwin, Mikhail Mazurenka and Stuart R. Mackenzie, „Surface Assembly and Redox Dissolution of Silver Nanoparticles Monitored by Evanescent Wave Cavity Ring-Down
Mathias Schnippering, Patrick R. Unwin, Johan Hult, Toni Laurila, Clemens F. Kaminski, Justin M. Langridge, Rod L. Jones, Mikhail
Mazurenka and Stuart R. Mackenzie, “Evanescent Wave Broadband Cavity Enhanced Absorption Spectroscopy Using Supercontinuum Radiation: A New Probe of Electrochemical Processes” Electrochemistry
Communications 2008, 10, 1827-1830.
Mathias Schnippering, Hayley V. Powell, Stuart R. Mackenzie and Patrick R. Unwin, “Real-Time Monitoring of Polyaniline Nanoparticle Formation on Surfaces” Journal of Physical Chemistry C 2009, 113, 20221-20227.
Lineke van der Sneppen, Gus Hancock, Clemens Kaminski, Toni Laurila,
Stuart R. Mackenzie, Simon R. T. Neil, Robert Peverall, Grant A. D. Ritchie, Mathias Schnippering and Patrick R. Unwin, “Following Interfacial Kinetics in Real Time Using Broadband Evanescent Wave
Cavity-Enhanced Absorption Spectroscopy: A Comparison of Light-emitting Diodes and Supercontinuum Sources” Analyst 2010 (Advance
Article).
Mathias Schnippering, Simon R. T. Neil, Stuart R. Mackenzie and Patrick
R. Unwin, “Evanescent Wave Cavity Ring-Down Spectroscopy as a Probe of Interfacial Processes” submitted to Chemical Society Reviews.
Reactions of Immobilized Cytochrome c using Evanescent Wave Cavity
Ring-Down Spectroscopy in a Thin Layer Electrochemical Cell”
Abbreviations
Abbreviation Description
AFM Atomic force microscopy
ATR Attenuated total internal reflection spectroscopy BB-CEAS Broadband cavity enhanced absorption spectroscopy
BBO b-barium borate
CCD Charge-coupled device
CEAS Cavity enhanced absorption spectroscopy CRDS Cavity ring-down spectroscopy
CV Cyclic voltammetry
CW Continuous wave
DAQ Data acquisition
DMP+I
-trans-4-[4-(dibutylamino)styril]-1-methylpyridinium iodide
DP
trans-4-[4-(dibutylamino)styril]-1-(3-sulfopropyl) pyridinium
DPI Dual Polarisation Interferometry
ET Electron transfer
EW-CRDS Evanescent wave cavity ring-down spectroscopy
fcc face-centred cubic
F-CRDS Fibre optic cavity ring-down spectroscopy FeEDTA2- Ethylenediaminetetraacetic acid iron(II) complex ITO Indium doped tin oxide
JMA Johnson-Mehl-Avrami
LDCU Laser diode control unit LED Light emitting diode
OPO Optical parametric oscillator
PAni Polyaniline
PCF Photonic Crystal fibre PFV Protein Film Voltammetry PGA Poly-L-glutamic acid
PMT Photomultiplier tube PTFE polytetrafluoroethylene QCM Quartz crystal microbalance SAM Self-assembled monolayer SCR Supercontinuum radiation
SECM Scanning electrochemical microscopy SERS Surface-enhanced Raman scattering SHG Second harmonic generation
SPR Surface Plasmon resonance TEM Transverse electromagnetic mode THG Third harmonic generation TIR Total internal reflection
TM-AFM Tapping mode atomic force microscopy UME Ultra microelectrode
UV Ultraviolet
Glossary of Symbols
Symbol Description
(αl)min
Minimal detectable extinction coefficient
α
Absorption coefficientA Absorbance
a Radius
α
Electron transfer coefficientβ
Group velocity dispersioncL Speed of light
c Concentration
c* Bulk concentration
γ
Angle of incidenceγ
c Critical angleD Diffusion coefficient
δ
Average secondary electron yielddp Penetration depth
E Electric field
e Unit vector
E Potential
ε
Extinction coefficientf Statistical frequency
F Faraday constant
Φ’’ Group velocity dispersion per cm
g g-Parameter
G Current amplification factor
Γ∗ Number of monomers
I Intensity
j Current density
k Rate constant
L Length of the cavity
λ
WavelengthM Molecular weight
ni Refractive index of species i
ν
Scan raten Number of electrons
N Number of dynodes
Na Avogadro's constant
p Longitudinal mode index
θ
Surface coverageθ
Β Brewster angleΘ Fractional coverage
R Reflectivity
ρ
DensityR Gas constant
S Area of electrode
σ
(t) Time-dependent surface areaτ
Ring-down timet Time
T Temperature
tpulse Pulse duration
τ
0 Reference ring-down timeAbstract
This thesis is concerned with the application of evanescent wave cavity ring-down spectroscopy (EW-CRDS) and evanescent wave broadband cavity enhanced absorption spectroscopy (EW-BB-CEAS) for studies of electrochemical and interfacial processes. These include nanoparticle adsorption/dissolution, polymer nanoparticle formation and surface-bound electrochemical redox reactions. Different experimental setups have been designed to investigate these systems.
EW-CRDS is a surface sensitive technique, which allows absorption measurements at solid/liquid and solid/air interfaces. Surface reactions can easily be monitored in real time. A pulsed or modulated laser beam is coupled into an optical cavity which consists of at least one optical element, in which the beam is total internal reflected. At the position of total internal reflection (TIR), an evanescent field is established with the amplitude decaying exponentially with distance from the boundary. The evanescent field can be exploited to investigate the absorbance properties of the liquid phase in the first few hundred nanometres of the solution above the silica surface. These types of instruments have high temporal resolution (up to 2 kHz repetition rate), coupled with high sensitivity (minimum detectable interfacial absorbance per pass: ~80 ppm) which enables the investigation of a variety of processes relating to fundamental questions in the field of physical chemistry and materials science. The aforementioned sensitivity and resolution make EW-CRDS an ideal tool for those investigations, especially if combined with other techniques such as electrochemistry or microfluidic and hydrodynamic techniques. In this thesis, different instrumentational setups will be discussed.
EW-BB-CEAS is another example for a TIR based absorption spectroscopic technique and can give additional spectral information about the investigated surface processes by employing broadband light such as supercontinuum radiation. In this case, the amplified light intensity within the optical cavity is measured rather than the light decay.
1
Introduction
This thesis is concerned with studying the dynamics of various interfacial
processes using evanescent wave cavity ring-down spectroscopy (EW-CRDS). This chapter provides a background for the different variants of
cavity ring-down spectroscopy (CRDS) and the evolution of this technique from the gas phase into the condensed phase. This includes sections about different light sources, cavity configurations and their applications in the
field of physical chemistry. Additionally, some basic considerations about atomic force microscopy (AFM) and electrochemistry are also described.
EW-CRDS is a surface sensitive technique, which allows absorption measurements at interfaces, with most applications hitherto at solid/liquid and solid/air interfaces. Surface reactions can easily be monitored in real
time. A pulsed or modulated laser beam is coupled into an optical cavity which consists of at least one optical element, herein a silica prism, at which the beam undergoes total internal reflection (TIR). At the position of
TIR, an evanescent field is established with the amplitude decaying exponentially with distance from the boundary. The evanescent field can be
exploited to investigate the absorbance properties of the liquid phase in the first few hundred nanometres of the solution above the silica prism surface. These types of instruments have good spatial and temporal resolution,
variety of processes relating to fundamental questions in the field of physical chemistry and materials science. The aforementioned sensitivity
and resolution make EW-CRDS an ideal tool for those investigations, especially if combined with other techniques such as basic electrochemical measurements or microfluidic and hydrodynamic techniques, which are
developed throughout this thesis. In this section, different configurations for EW-CRDS will be discussed, along with instrumentation aspects.
Additionally, several examples of the use of EW-CRDS will be demonstrated to exemplify this technique in more detail.
1.1
Cavity Ring-down Spectroscopy
The following two sections discuss the basic principles of CRDS, using
simple gas phase measurements for illustrative purposes. It is hence shown, how the CRDS technique can be extended in order to measure adsorption
at surfaces or reaction kinetics in condensed phases, especially through the use of the EW-CRDS variant.
1.1.1
Gas Phase CRDS
responsible for the exceptionally high sensitivity and CRDS is now established as a reliable spectroscopic technique with applications ranging
from trace gas detection, absorption spectroscopy, dynamical studies in the gas phase and even atmospheric gas detection. Instead of optical cavities employing highly reflective mirrors, this technique can also be operated
using optical fibres.8
In CRDS, the exponential decay of the amount of light within an
optical cavity (due to the loss of energy resulting from transmission and absorption by the mirrors) is measured with and without an absorber present, after filling the cavity with light to a steady-value and switching
off the light abruptly. The time-dependent function for the intensity of the
light, ( )I t , obeys the Beer-Lambert law and depends on the reflectivity of
the mirrors and the length of the cavity. It can be shown that for a simple
two-mirror cavity (Fabry-Perot cavity) as shown in Figure 1.1, it satisfies
( )
0 L( ln )c t R L L
I t =I e− − +α , (1.1)
where I0 is the initial intensity of the laser light within the cavity, cL is the
speed of light, L is the length of the cavity, R is the reflectivity of the
mirrors and
α
is the absorption coefficient of the species of interest in thecavity. If we assume that R is close to 1, the measured ring-down time
τ
,which is conveniently defined as the time taken for the intensity to drop to
0
I /e is:
(
)
L 1
L
c R L
τ =
It is clear that with an absorbing species within the optical cavity, the
characteristic ring-down time,
τ
, will decrease compared to an emptycavity,
τ
0. The absorbance is described by( )
10
0 L
log L
A e
c
∆τ =
ττ , (1.3)
Because of the increased light pathway due to multiple roundtrips, this
[image:26.595.144.507.263.494.2]technique is extremely sensitive to small concentrations.2,4-5,9-10
Figure 1.1: Schematic representation of a (linear) Fabry-Perot cavity. The light beam with
intensity I0 enters the cavity from the left through mirror 1. The light intensity, which
decays exponentially with time due to the non-perfect reflectivity of the mirrors and
absorption within the cavity, partly leaks out behind mirror 2 and is measured with a
photomultiplier tube (PMT).
There are many varieties of linear cavities, the properties of which depend on the radii of curvature of the two mirrors (R1 and R2) and the length (L).
There are three possible arrangements of optical cavities which depend on the curvature of the mirrors: plano-plano, plano-concave and
concave-I
0I
I
/
I0
time
mirror 1 mirror 2
PMT
Table 1.1: The conditions and definitions for a range of different optical cavities.
Condition Optical Cavity R1 = R2 = L confocal
R1 = R2 = L/2 concentric
R1 = R2 >> L long-radius
R1 = L R2 = ∞ hemispherical
R1 = 2L R2 = semi-confocal
R1 = R2 = Fabry-Perot
.
Optical cavities are said to be stable if a light beam is refocused within the cavity after successive reflections from the mirrors and is trapped within the cavity.6 The criteria for cavity stability are expressed in terms of the so-called g-parameters:6
1 2
0≤g g ≤1 (1.4)
where 1 1 1 L g R = −
(1.5)
and 2 2 1 L g R = −
(1.6)
In unstable cavity systems, the light rays will steadily migrate across the mirrors until they finally escape the cavity. A Fabry-Perot resonator, where
1 2 1
g = g = , is particularly challenging to align,11 so most optical cavities have at least one concave element, which essentially refocuses the beam within the cavity.
There are a number of advantages of CRDS compared to other
absorption spectroscopy techniques. The measurement of the absorbance depends only on the ring-down rate of light inside the optical cavity and
∞
not on the intensity of the transmitted light. This also means that CRDS is insensitive to intensity fluctuation of the laser source. Also, optical
resonators are stable and hence less sensitive to changes of the path length or temperature fluctuations.6 An optical resonator can enhance the path length of the light up to several tens of kilometres (due to multiple reflections) compared to a single pass measurement.6 By measuring and subtracting the ring-down time of an empty cavity from the sample
measurement, absolute absorbance values can be obtained in a direct and simple way.10
The previously described model, which describes the decay of light in the ring-down cavity by taking into account the mirror reflectivity is unfortunately too simple. It does not include the fact that only light having
frequencies near a cavity mode will be allowed inside the resonator. In any optical cavity, there is a set of allowed frequencies, so-called “modes”
which are allowed to propagate and are determined by the geometry of the optical cavity. These are either longitudinal modes or transverse modes. Longitudinal modes determine the frequencies that satisfy the wavelength
conditions of the cavity, which means that the electric vector of the light wave is zero at the mirror surface. The allowed frequencies for the
longitudinal modes are governed by
C
2 2
p
c p L
α υ
π
= −
(1.7)
where υp is the frequency of the radiation, p is the an integer (the
fact that the wave is not planar. The spacing between two adjacent longitudinal modes will be
2 c
L υ
∆ = (1.8)
Transverse modes determine the cross-sectional profile of the beam. In this case the condition is that the transverse profile must be the same after one round-trip. The lowest order transverse electromagnetic mode, or
fundamental mode (TEM00), has a Gaussian cross-sectional profile.6 There
are an infinite number of transverse modes associated with one longitudinal
mode.6 In order to carry out CRDS experiments, the laser frequency usually has to be scanned in order to obtain a resonance frequency within the resonator. As we will see later, we can avoid this, by choosing a
“broadband” light source, which will be able to excite many cavity modes at once.
There have been several approaches to measure surface properties using CRDS. Engeln et al. were able to measure one fundamental absorption band of C60 by inserting a C60-modified optically transparent
ZnSe substrate into a linear cavity.12 The group of Pipino extended the CRDS technique from gas absorption studies to nanostructured surfaces by
depositing Au nanoparticles onto silica. In this way, by using the surface Plasmon resonance (SPR) effect, it was possible to increase in the detection limit for trichloroethylene and dichloroethylene.13 Their setup included an intracavity flow cell with two flat optical end-windows. These windows were aligned at Brewster angle. The Brewster angle for an air to glass
1 silica B
air
tan n
n
θ
− =
(1.9)
where nsilica and nair are the refractive indices of silica and air, respectively.
For the experiment, one of the optical windows was coated with a thin
nanostructured Au film. It was then shown that the SPR effect originating from the Au nanoparticles enhanced the sensitivity for the detection of
trichloroethylene and dichloroethylene. This could be verified by comparing the experimental results obtained to an extended Mie calculation taking into account the formation of a dielectric coating on the
nanoparticles. In a later paper, the same methodology was used to detect various nitro compounds.15 It was found that the sensitivity of this approach compared to conventional SPR was approximately 35 times higher. The sensitivity of SPR of Au nanoparticles appeared to increase with the degree of nitration.15
1.1.2
Condensed Phase CRDS
There have been many attempts to transfer CRDS to the condensed phase and several approaches to measure thin films have been introduced. Xu et
al. placed the sample cells directly into the cavity at the Brewster angle in order to reduce reflection losses. This setup enabled the measurement of
absorption coefficients as low as 2 x 10⁻⁷ cm-1 and it was therefore possible to obtain vibrational electronic information of benzene.16 A similar concept was used by Muir and Alexander to study the absorption features of films
coatings in the range of 0.03 monolayers could be investigated.17 This approach was adapted by Alexander in order to monitor reaction kinetics of
nitrate radicals with terpenes in solution.18 The same author has also demonstrated that CRDS can be used in systems involving liquid jets. With
this approach, it was possible achieve a detection limit of
α
= 0.0162 cm-1 using Malachite Green as an absorber which corresponds to a concentration of 71 nM.19A further approach to implement CRDS into the condensed phase
was presented by Hallock et al., by simply filling a standard linear optical cavity with the solution of interest.20 It was found that the presence of the solvent did not interfere with high-reflective mirrors and did not alter their performance. It was shown that for measurements between 620 nm and 670 nm, a light absorbing compound such as Cu(II) acetate, which
possesses a very high extinction coefficient in this range, could be detected at very low concentration. However, due to the long pathway in the linear
optical cavity, and to minimise absorption and scattering of light in the solvent, it was necessary to limit the solutions to organic solvents such as hexane, acetonitrile and others which do not absorb in the red.
Nevertheless, for strong absorbers, the detection limit was in the range of 1 – 10 pM, or equivalently a minimum detectable absorption coefficient of
1 x 10⁻⁶. A similar approach was employed by the same group to study the reduction of Methylene Blue by ascorbic acid in acetonitrile.21
focuses on the EW variants of CRDS, which are directly relevant to the work carried out.
1.2
Evanescent Waves
A relatively new approach to implement CRDS in the condensed phase relies on the concept of evanescent waves. Evanescent waves are formed
when a light beam undergoes total internal reflection at an interface consisting of two different media, as described by Snell’s law
݊ଵsin ߛଵ = ݊ଵsin ߛଶ (1.10)
where n1 and n2 are the refractive indices of the two different media, γ1 is
the angle of incidence of a beam striking the interface from medium 1 and
γ2 is the angle of the direction of propagation formed by the refracted beam
with the normal to the surface as shown in Figure 1.2.
Figure 1.2: Schematic representation of an interface consisting of two media with different
refractive indices. An incoming electromagnetic wave k is reflected and transmitted at the interface.
If the incidence angle exceeds the value of the critical angle
γγγγ
1111k
n
1n
2ߛ
= sin
ିଵቀ
మభቁ
, (1.11) [image:33.595.228.431.176.508.2]the light is no longer transmitted into the second medium; rather it is totally reflected as shown in Figure 1.3.
Figure 1.3: Schematic representation of an interface consisting of two media with different
refractive indices. In both cases, n2 < n1. If the angle of incidence is smaller than the
critical angle, the incoming electromagnetic wave k is reflected and transmitted at the interface (A). If the angle of incidence is larger than the critical angle, then the wave is
totally internal reflected (B).
In the case of TIR (Figure 1.3B), there is still a certain amount of electromagnetic radiation present in the second medium. These waves are
referred to as evanescent waves and can be described by taking into
γγγγ
1111k
n
1n
2γγγγ
cB
γγγγ
1111k
n
1n
2γγγγ
2222γγγγ
caccount the boundary conditions on Maxwell’s equations at the interface for the incident and the total internal reflected beam.23
The incident plane wave can be represented in terms of two fields with distinct directions. The p polarisation direction lies parallel to the
incidence plane and the s polarisation direction lies normal to the incidence plane. The associated corresponding electric fields can be expressed as
p x x z z
E =E e +E e
r r r
and Es =E ey y
r r
(1.12)
where eri is the unit vector of the coordinate system (i =
(
x y z, ,)
), where x and y lie on the interface between the two media and z is the direction from the more refractive medium towards the less refractive medium and the0
y= plane is the plane of incidence. The boundary conditions of
Maxwell’s equations still have to be fulfilled and are manifested in a
non-zero intensity of the electric field at the interface, since the there has to be a matching field to the incident radiation on the other side of the interface. It
can be shown that the z-dependence of this evanescent field23 can be expressed as
ܧሬԦ୮ሺݖሻ = ܧ୮
ሺଶ ୡ୭ୱఊሻ௫൬ି౦൰
మୡ୭ୱ ఊାሺୱ୧୬మఊିమሻభ/మൣ−݅ሺsinଶߛ − ݊ଶሻଵ/ଶ݁ሬሬሬԦ + sin ߛ݁୶ ሬሬሬԦ൧ (1.13)
for the p polarisation and
ܧሬԦୱሺݖሻ = ܧୱ
ሺଶ ୡ୭ୱ ఊሻ௫൬ି౦൰
మୡ୭ୱ ఊାሺୱ୧୬మఊିమሻభ/మ݁ሬሬሬԦ୷ (1.14)
for the s polarisation, where dpis the penetration depth (see below).
describes dp where the intensity of the evanescent field has dropped to 1/e of the field intensity at the boundary:
݀ = ఒ
ଶగටభమୱ୧୬మఊିమమ
(1.15)
where
λ
is the wavelength of the laser light (in vacuum). In theory, thepenetration depth goes from infinity to
λ
/ 2π
n12−n22 as the incidence angle increases from γc toπ
/ 2. Depending on the wavelength of thesource, the difference of the refractive indices of the two media and the angle of incidence, the penetration depth ranges usually from 50 nm to a
few hundred nm.
1.3
Attenuated Total Internal Reflection Spectroscopy
Attenuated Total Internal Reflection Spectroscopy (ATR) and cavity based
ring-down spectroscopic techniques based on evanescent waves rely on the formation of evanescent waves at silica or glass / air interface. ATR uses the evanescent waves of multiple TIR events at a silica / air or silica /
solution interface to probe surface concentrations.24 Figure 1.4 shows a schematic representation of a typical ATR setup. The light enters the ATR
Figure 1.4: Schematic representation of a typical ATR setup. The incident light beam
undergoes multiple TIR events. The attenuated beam escaping from the other end of the
ATR crystal is measured with a detector.
1.4
Other Surface Sensitive Characterisation Methods
Surface Plasmon Resonance SPR is, similar to ATR, a total internal
reflection technique25-26 and was described for the first time by Kretschmann27 and Otto28 SPR is based on the optical excitation of surface plasmons by a laser beam. This technique can be used to monitor changes in the refractive indices of the solid/liquid interface and is a well-known characterisation technique for chemical and biological sensors.26,29-31 SPR occurs at the interface of two media with dielectric constants of opposite signs i.e. a thin metal film or monolayer of metal nanoparticles (mostly Ag
or Au) and a dielectric. The charge density oscillations induced by a incident laser beam establish an electromagnetic wave (surface plasma wave) with its maximum at the interface and decaying exponentially in
both media. Due to the high losses within the metal, the majority of the field is concentrated in the dielectric. The reflected SPR beam is highly
sensitive to the refractive index of the dielectric medium because it
to detector Sample in contact with
evanescent waves
depends on the angle at which the maximum resonance for a given wavelength is achieved. This technique can also be adapted to real-time
measurements of changes in the refractive index.32 SPR determines the angle of incidence at which the reflected light intensity is minimal
(absorption maximum). It is either possible to measure the reflectivity as a function of angle (static SPR) or select an angle just below the minimal reflectivity and measure the reflectivity as a function of time (dynamic
SPR). The electromagnetic wave is directly related (usually linearly) to the adsorbed amount.
Quartz crystal microbalance is a technique which can measure small changes in mass on a quartz crystal resonator due to the change of frequency during the deposition of thin films. The quartz crystal lies
between two metal electrodes which establish a vibrational motion of the crystal at its resonance frequency by applying an alternating electric field.
It can measure mass densities as low as a few micrograms per cm2 and is used for analytical measurements in vacuum, gas phase and liquid phase as well.33 QCM is therefore a very sensitive analytical method which can measure changes in the sub-monolayer range including molecular adsorption and interaction time resolved, however, it does not discriminate
between different deposits since it only monitors the change in mass.
Although mostly used as an imaging tool for 3D topographic imaging, interferometry can also be used to study adsorption on surfaces
especially changes in protein structure,35 protein interactions36-37 and DNA hybridisation.38 A polarised laser beam is coupled into stack of two optical waveguides which leads to two light waves in both waveguides which are in phase. Similar to SPR and ATR, DPI uses evanescent fields as sensing
elements. The established evanescent wave from the top waveguide interacts with the adsorbed molecules at the surface and introduces a phase shift which with respect to the lower waveguide. In the far-field limit, both
light waves will be combined with each other and the resulting interference fringes are measured.34 The lowest detectable surface coverage for this technique is 20 %.39
Ellipsometry is a widely used tool in electrochemistry and surface science to measure thin film thicknesses.40-41 The principle of ellipsometry is based on a polarised light beam reflected off the sample at various wavelengths and monitor the change in polarisation. In this way the
complex optical ratio of the Fresnel reflection coefficients can be determined and, using various modelling tools, the optical parameters of the sample can be obtained. Tiberg et al. characterised surfactant
self-assembled films using this technique.42-43 It is also possible to obtain kinetic information using this technique as described by the same group.44 Although a very sensitive method (< 1 % surface coverage), this method requires a somewhat advanced method for data analysis usually in form of a modelling procedure. Also, the sample should contain well-defined layers
that are optically homogenous.
reflected from the sample surface und the intensities of the s and p components are measured continuously. The amount of adsorbant on the
surface can be obtained (after calibration) by monitoring the change of the ratio of these intensities.46 Compared to ellipsometry, this technique is much simpler and cheaper, although it does not give information about the concentration profile of the adsorbed layer. Both, ellipsometry and reflectometry possess high sensitivity towards changes in the refractive
index but need special calibration procedures.47
1.5
Evanescent Wave Cavity Ring-down Spectroscopy
The combination of the concept of evanescent waves described in section
1.2 and 1.3 with CRDS is straightforward and enables interfacial absorption measurements at a very high sensitivity. The first description of the concept of EW-CRDS was reported by Pipino et al.48 The spectrometer consisted of a monolithic, TIR ring cavity with a hexagonal geometry as shown in Figure 1.5. A laser beam underwent TIR in a rectangular prism,
generating an evanescent wave at the point of reflection. The intensity of the evanescent wave was used to excite the cavity modes in the hexagonal ring cavity. At another side, the decreasing in the light intensity was
Figure 1.5: The hexagonal monolithic cavity as used by Pipino et al..48 The incoming light beam is totally reflected by prism A. The evanescent wave then excites the modes of the
optical cavity by photon tunneling. At the surfaces (a) – (d) evanescent waves are
established which can be used to obtain absorption spectra. The decrease of the light
intensity is measured by coupling the light out of the resonator using prism C.
Shaw et al. examined the adsorption properties of Crystal Violet at the silica-water interface, incorporating a Dove prism in the optical cavity. With this setup, it was possible to investigate the adsorption of Crystal
Violet as a function of the pH and the ionic strength.49 The same group also investigated the pH-dependence of the absorbance of a Nile Blue derivative
at the silica-water interface. The titration of the silica-water interface (i.e. the titration of two types of Si-OH groups50) was significantly different depending on whether the titration was carried out with increasing or
decreasing pH. The absorbance decreased at lower bulk pH, suggesting an increase in the interfacial pH due to a stable charged layer at the surface.51 A cooperative binding model was developed subsequently to interpret the
PMT
a b
adsorption isotherm for a charged chromophore. It has been shown that the isotherm is pH sensitive and dependent on the degree of surface charge.52
Various studies have been carried out using a ring cavity with triangular fused-silica prisms. With this type of setup, Zare et al.
investigated films of Methylene Blue at the air-silica interface53 and carried out studies involving polymer/solvent interactions.54 In the latter paper, different relative diffusion rates for methanol and water into a
poly(dimethylsiloxane) film were measured. It has been shown by Zare et al. that the silica surface consists of two different types of silanol groups55 which manifests itself in a two-site Langmuir isotherm of Crystal Violet adsorption. To obtain information about different electrostatic interactions, the surface can be functionalised by multilayer assemblies of
polyelectrolytes, such as poly-L-lysine (PLL) and poly-L-glutamic acid (PGA). The resulting surface charge is either positive in the case of PLL or
negative in the case of a PLL/PGA bilayer (over a wide range of pH). Originally developed by Decher et al.,56-58 the electrostatic assembly of polyelectrolytes provides surfaces with well defined properties such as
thickness and surface potential.59-61
1.6
Light Sources in EW-CRDS
The next few sections are describe the different cavity arrangements used
1.6.1
Diode Lasers
Diode lasers used for EW-CRDS are usually either “narrow band” or
“broadband” lasers. The active materials of diode lasers are based on p and n doped semiconductors. By a applying a voltage between the anode and cathode of the photodiode, population inversion is achieved. If a laser with
a very narrow bandwidth is used, it is usually necessary to scan the frequency of the laser in order to match the cavity modes of the CRDS set
up. This is essential to achieve the resonance condition in the cavity. If, however, a “broadband” laser source with a relatively large bandwidth (~ 1 nm) is used, it is not necessary to scan the cavity, because many different
modes of the cavity will be excited, due to the large frequency distribution of the laser. This is a feature of diode lasers.62 This type of laser is usually not pulsed (i.e. it runs in continuous wave mode), but can be modulated, though in a time-scale where the laser is switched on for a duration that is much longer than the time taken for a light pulse to undergo several
roundtrips in the cavity. In this case, the cavity is filled with light for a certain amount of time (depending on the modulation frequency). Then the
laser is switched off and the decay of the light intensity within the cavity is recorded.63
1.6.2
Pulsed dye lasers and optical parametric oscillators
(OPOs)
injected into the cavity.64 With this “bounce-to-bounce” type technique, individual signals of the wave packages after each roundtrip are recorded
as shown in the decay curve in Figure 1.1. Due to the high intensity of these lasers, the signal to noise ratio is usually very high and unmatched by
other types of light sources. However, it is not possible to run these pulsed laser sources at a high repetition rate (usually only around 10 Hz), which makes fast kinetic measurements impossible. On the other hand, the
tunability of the light sources provides the possibility of spectral information and one is not limited to measurements at a single wavelength.
In summary, the light source defines the type of experiment. Diode lasers are cheap, can be run in CW mode and enable fast kinetic measurements but are more lacking in terms of signal to noise ratio and can
only give information at a single wavelength. Narrow band, pulsed sources are more expensive but are much higher in sensitivity and it is possible to
obtain spectral information. But measurements are limited to the steady-state.
1.7
Cavity Configurations in EW-CRDS
There are many ways of building optical cavities. The most common
cavities consist of two highly-reflective mirrors and an optical element, in which the laser beam undergoes total internal reflection. At least one of the
silica/solvent interface.65 However, there are also other examples such as monolithic optical cavities.66-67 The following sections describe the most important optical cavities used in EW-CRDS.
1.7.1
Ring Cavity
One approach to extend CRDS into the liquid phase is the introduction of
an additional optical element such as a prism. A pulsed laser beam is coupled into an optical cavity which consists of two high reflectivity
mirrors and a fused silica prism as shown in Figure 1.6. An evanescent field is established at the position of the TIR. If a cell is fixed on top of the prism, it possible to investigate absorbance properties of the liquid phase in
the first few hundred nanometres (within the penetration depth of the evanescent field) of solution above the silica surface.
Figure 1.6: Schematic representation of a ring cavity setup.
The exponential decay of the amount of light within the cavity (due to the
loss of energy resulting from transmission and absorption by the mirrors, the prism and the species of interest), after extinguishing the light entering the cavity, is measured by a photomultiplier tube (PMT). Figure 1.7 shows
PMT
light in
mirror mirror
a typical ring-down trace for a ring cavity. The employed laser runs in continuous wave (CW) mode (modulated at ca. 2 kHz) and has a
bandwidth of 1 nm. Usually, several of these ring-down traces will be averaged to decrease the noise level.
Figure 1.7: Typical ring-down trace for a ring cavity.
If the surface of the prism is modified (e.g. nanostructures, polymers or surface concentrations of molecules) the characteristic ring-down time will decrease due to the absorbance and scattering of these species within the
evanescent field. The Absorbance is calculated using equation 1.3. The minimum detectable interfacial absorbance per pass is ~80 ppm63 and the detection limit is usually limited by the prism itself. Since a large part of the beam is reflected at the prism, the measured signal is rather large and easy to measure. Prisms for the ring cavity can usually be purchased
relatively cheaply from several manufacturers (e.g. CVI, UK). However, ring-down times are usually quite short compared to other cavity
arrangements and the sensitivity is therefore limited, by comparison. Also,
2.0
1.5
1.0
0.5
0.0
In
te
n
s
it
y
/
a
.
u
.
1.5 1.0
0.5 0.0
it is not possible to conduct polarisation dependent measurements since the angle of incident where the beam enters the prism is not perpendicular.
1.7.2
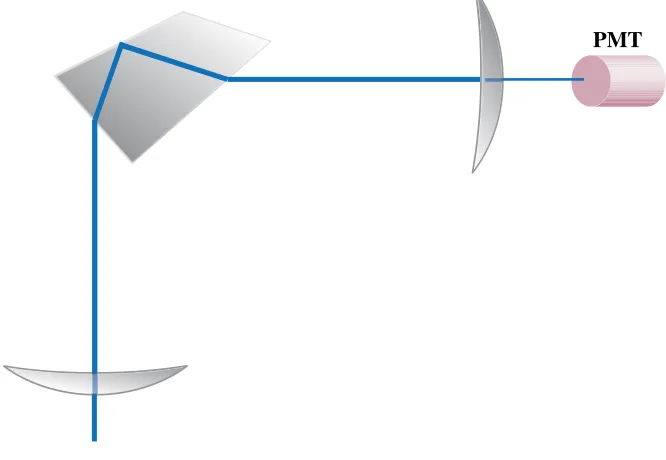
Folded Cavity
The optical cavity in this configuration consists of two highly-reflective mirrors and a trapeze-shaped or 60 degree prism. The entrance and exit of
the beam is normal to the prism surfaces, therefore there is no need for antireflective coating and the short prism faces. As shown in Figure 1.8,
this setup essentially forms three sub-cavities, two between the mirrors and the prism faces and one within the prism itself. Ring-down times in this configuration should, in principle, be higher than in the ring cavity because
reflections at the mirrors and at the prism faces are directed back into the laser beam path. The light leaking out of the cavity can therefore only be
measured behind one of the mirrors. It should be pointed out that the lack of the antireflective coating also enables polarisation dependent measurements. It was also demonstrated, that this configuration can be
used for broadband measurements using supercontinuum radiation because the angle of incident of the light is normal to the prism faces.68
Figure 1.8: Schematic representation of a folded cavity. The beam enters the prism
is slightly more challenging and the prisms are not commercially available. The major
advantage of this configuration is the possibility to carry out polarisation-dependent
measurements.
1.7.3
Linear (Dove) Cavity
Another possible optical cavity to conduct EW-CRDS experiments was introduced by Shaw and consisted of a Dove prism in a linear cavity
arrangement as shown in Figure 1.9.49 The sides of the prism are coated with an anti-reflective material which also limits the detection limit somewhat (in the same way as for the ring cavity).
Figure 1.9: Schematic representation of a linear cavity employing a Dove prism.
1.7.4
Pellin-Broca cavity
Introduced by Pipino et al.65 this cavity arrangement offers the possibility of polarisation dependent experiments. In this type of cavity, two concave mirrors and a silica prism are aligned as shown in Figure 1.10.
Figure 1.10: Schematic representation of a Pellin-Broca cavity as used by Pipino et al.65 The beam enters and leaves the prism at Brewster angle.
Remarkably long ring-down times, up to microseconds which is much
larger than the other cavity configurations discussed so far, can be achieved using this cavity arrangement. This configuration was used to investigate the adsorption, and molecular orientation, of I2 on silica from the gas
phase.65
1.7.5
Monolithic Resonators
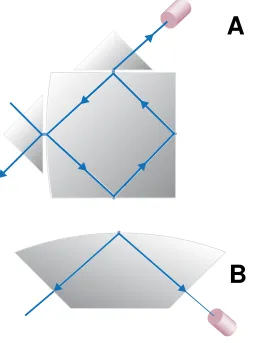
Monolithic cavities can have different geometries as demonstrated by Pipino et al.,48,66,69-70 but the most common cavities are polygonal resonators.48,69 All monolithic cavities have in common that the light pulses are reflected within the silica material. There are no losses related to optical elements within the cavity because the light path is always in the same medium and this leads to significantly higher ring-down times.
[image:48.595.172.505.77.307.2]Polygonal cavities were the first optical cavities to be used in EW-CRDS. An early paper by Pipino et al. describes polygonal optical
resonator with one convex side where the laser pulse enters the cavity by photon tunnelling using a rectangular prism, as shown in Figure 1.11A.69 The light undergoes multiple TIR events on all four facets within the monolithic cavity. Another coupling prism is employed to measure the light intensity in the resonator. On the two remain facets, the evanescent
waves can be used to probe interfacial absorbances. However, to excite the cavity modes, photon tunnelling is used, which requires precise positioning
of the coupling prisms.66
In the case of a folded cavity arrangement, the light enters and leaves the monolithic cavity perpendicular to the planar sides of the prism
and the evanescent wave is formed at the larger convex face. A schematic is depicted in Figure 1.11B. Note, that this cavity is a further example of a
folded cavity, which allows polarisation dependent experiments to measure molecular orientation of adsorbed material. Pipino et al.,67,70-71 who were using these types of cavities for gas adsorption experiments (see below),