warwick.ac.uk/lib-publications
Original citation:
Chuah, Edward, Jhumka, Arshad, Browne, James C., Gurumdimma, Nentawe,
Narasimhamurthy, Sai and Barth, Bill (2016) Using message logs and resource use data for
cluster failure diagnosis. In: 23rd annual IEEE International Conference on High Performance
Computing, Data, and Analytics (HiPC 2016), Hyderabad, India, 19-22 Dec 2016
Permanent WRAP URL:
http://wrap.warwick.ac.uk/83539
Copyright and reuse:
The Warwick Research Archive Portal (WRAP) makes this work by researchers of the
University of Warwick available open access under the following conditions. Copyright ©
and all moral rights to the version of the paper presented here belong to the individual
author(s) and/or other copyright owners. To the extent reasonable and practicable the
material made available in WRAP has been checked for eligibility before being made
available.
Copies of full items can be used for personal research or study, educational, or not-for profit
purposes without prior permission or charge. Provided that the authors, title and full
bibliographic details are credited, a hyperlink and/or URL is given for the original metadata
page and the content is not changed in any way.
Publisher’s statement:
© 2016 IEEE. Personal use of this material is permitted. Permission from IEEE must be
obtained for all other uses, in any current or future media, including reprinting
/republishing this material for advertising or promotional purposes, creating new collective
works, for resale or redistribution to servers or lists, or reuse of any copyrighted component
of this work in other works.
A note on versions:
The version presented here may differ from the published version or, version of record, if
you wish to cite this item you are advised to consult the publisher’s version. Please see the
‘permanent WRAP url’ above for details on accessing the published version and note that
access may require a subscription.
Using Message Logs and Resource Use Data for Cluster Failure Diagnosis
Edward Chuah
k∗†, Arshad Jhumka
∗, James C. Browne
‡, Nentawe Gurumdimma
∗∗, Sai Narasimhamurthy
§, Bill Barth
¶ kThe Alan Turing Institute, 96 Euston Road, London NW1 2DB, UK. Email: [email protected]∗University of Warwick, Coventry CV4 7AL, UK. Email:{E.Chuah, H.A.Jhumka}@warwick.ac.uk
‡University of Texas at Austin, Texas 78712. Email: [email protected]
∗∗University of Jos P.M.B 2084 Jos, Plateau State Nigeria, Post code: 930001. Email: [email protected]
§Seagate Technology, Havant, PO9 1SA, UK. Email: [email protected] ¶Texas Advanced Computing Center, Texas 78758. Email: [email protected]
†Singapore Polytechnic, 500 Dover Road, Singapore 139651.
Abstract—Failure diagnosis for large compute clusters using only message logs is known to be incomplete. Recent availability of resource use data provides another potentially useful source of data for failure detection and diagnosis. Early work combining message logs and resource use data for failure diagnosis has shown promising results. This paper describes the CRUMEL framework which implements a new approach to combining rationalized message logs and resource use data for failure diag-nosis. CRUMEL identifies patterns of errors and resource use and correlates these patterns by time with system failures. Application of CRUMEL to data from the Ranger supercomputer has yielded improved diagnoses over previous research. CRUMEL has: (i) showed that more events correlated with system failures can only be identified by applying different correlation algorithms, (ii) confirmed six groups of errors, (iii) identified Lustre I/O resource use counters which are correlated with occurrence of Lustre faults which are potential flags for online detection of failures, (iv) matched the dates of correlated error events and correlated resource use with the dates of compute node hang-ups and (v) identified two more error grohang-ups associated with compute node hang-ups. The pre-processed data will be put on the public domain in September, 2016.
Index Terms—Large cluster system; Cluster log data; Corre-lation analysis; Failure diagnosis; Lustre file-system;
I. INTRODUCTION
Large clusters and supercomputers suffer from occurrence of faults and failures but generate a massive amount of monitoring data which can be used to analyze these faults and failures. Most of this data has been in the form of message logs. A significant body of research has demonstrated the value of message logs to detect faults [1], [2], diagnose failures [3]– [5] and predict faults/failures [6]–[8]. However, the message logs are incomplete and redundant1, making failure diagnosis from message logs alone very difficult. Recently, job and processor level resource use data has become available for some systems [9]. A recent body of research has demonstrated the value of performance data to detect faults [10], [11] and predict failures [12]. While use of message logs and performance data separately has provided important tools and methods that help manage the complexity of these systems,
1By incomplete, we mean that the message logs do not contain all the events needed to establish a complete causal trace path to the failure. By redundant, we mean that only a small quantity of the message logs is relevant to the diagnosis of a given failure.
there has been little exploration of the diagnostic benefit of combining analyses of message logs and resource use data.
The previous work on failure diagnosis techniques which attempt to combine message logs and resource use data to diagnose and/or predict impending failures [13], [14] have shown increased accuracy over use of message logs alone. In [13], resource use data is used to identify resource anomalies and provide partial diagnosis of system faults and failures, and message log analysis is used to obtain a more specific and precise diagnosis. [14] uses a similar approach to show that combining resource use and message log analyses shows indications of impending failures earlier than message log analyses alone. [15] combines analyses of message logs and resource usage but the focus is on error detection. [16] is focused on detecting patterns in failure logs. This paper builds on and extends the idea. It presents a new workflow for combining message logs and resource use data for failure diagnosis and demonstrates its effectiveness.
lead to compute node hang-ups. We chose Lustre I/O counters as Lustre file-system errors and network errors make up the majority of errors associated with compute node hang-ups.
The innovations and contributions of the CRUMEL frame-work and its application include:
• CRUMEL formulates, implements and applies a new
workflow for combining rationalized message logs and re-source use data for failure diagnosis. CRUMEL identifies patterns of errors and resource use events and correlates these patterns by time with system failures.
• Demonstrated that the CRUMEL workflow extends and
improves diagnoses over previous research. CRUMEL shows that more events correlated with system failures can only be identified by applying different correlation algorithms.
• Identified Lustre I/O resource use counters which are correlated with occurrence of Lustre faults which are potential flags for online detection of failures.
• Matched the dates of correlated error events and corre-lated resource use with dates of compute node hang-ups.
• Identified two previously undiagnosed error groups
as-sociated with compute node hang-ups. They are process errors and file-system errors.
The remainder of this paper is structured as follows: We define the fault model and present the problem description and CRUMEL framework in Section II. We evaluate CRUMEL in Section III, review the related work in Section IV and conclude with a summary and future work in Section VI.
II. MODELS, PROBLEMSPECIFICATION ANDCRUMEL
The class of systems to which CRUMEL can be applied is specified in terms of a generic model of cluster systems given in [13]. In this section, we describe the fault model to which our work is applicable. Then, we present the problem specification and the CRUMEL framework.
A. Fault Model
An illustration of the resource usage, error and system failure messages by time is shown in Fig. 1. We observed that soft lockup messages and file-system error messages in the rationalized message logs are correlated. We also observed that messages transmitted in a network, i.e., tx_msgs and bytes written to a file-system, i.e., write_bytesresource use counters in the resource use data are correlated.
To increase the dependability of such systems, it is im-portant to tolerate those errors that lead to a system failure. Knowing the nature of these errors will ease debugging or maintenance. On the other hand, some data centers may decide not to deploy failure recovery mechanisms due to their policies. As such, we do not assume the availability of failure recovery in our fault model.
Understanding the occurrence of an error from message logs alone is challenging. In this paper, we capture the notion of an error when: (i) a message is logged and the message captures a state of the program that deviates from expectation, and (ii) there are message patterns and resource usage patterns as
file system error messages
soft lockup messages
use data Resource message logs Rationalized
Time tx_msgs
write_bytes
0
0
0
0
0
[image:3.612.316.558.52.160.2]0 0 0
Fig. 1. An illustration of soft lockup and file-system error messages, messages transmitted in a network and bytes written to a file-system.
illustrated in Fig. 1. The CRUMEL framework developed in this paper seeks to determine the occurrence of these patterns for failure diagnosis.
B. Problem Specification and CRUMEL Framework
The problem that our analysis targets can be described as follows: Given (i) a set of resource use data, (ii) message logs that are incomplete and redundant, (iii) keywords of failure events, and (iv) name of resource use counters, then identify the errors which are correlated with the failure and the resource use counters which are correlated on the date of the failure. To achieve this, we develop the CRUMEL (CorrelatingResource
Usage data andMEssageLogs) framework shown in Fig. 2.
Correlated events Resource
Usage Data Message Logs
Resource use counters
Correlated Resource use counters
Data Type Extraction
Keywords (failure events) Name of
counters resource use
Validation Validation
Unique Unique
Message types
Correlation
Correlator Correlator
MTExt RUExt
Fig. 2. The workflow of the CRUMEL framework. The CRUMEL framework is composed of two modules: (1) Data Type Extraction, and (2) Correlation. The workflow automatically process the message logs and resource use data through the Data Type Extraction module, followed by the Correlation module. The output of each module are sets of reports which can be used for diagnosis.
Next, we describe in detail, each of the two modules used within the CRUMEL framework.
C. CRUMEL: Data Type Extraction
[image:3.612.331.539.377.577.2]that incorporates a logical structure and additional content such as job-identification to the POSIX formatted logs. TACC Stats [9] is a job-oriented and logically structured version of the conventional Sysstat system performance monitor. We devel-oped a Data Type Extractormodule that extracts: (i) message types from the message logs, (ii) resource use counters from the resource use data2.
Message Type Extractor: The Message Type Extractor or
MTExt, extracts the sources (the nodes and jobs), times and message sequences from the message logs and presents these messages in a form on which standard analysis algorithms can be applied. An example of an error message is given below:
1975935 Jun 3 07:25:17 i114-204 kernel X <0>%s. ECC error ECC error K8
The sources of this error message can be identified from the job (1975935) and node (i114-204). The time that this error message was recorded can be identified from the times-tamp (Jun 3 07:25:17). The software associated with this error message can be identified from the word (kernel) that follows immediately after the node identifier; in this example, the software is the Linux operating system kernel. The description of the event can be identified from this messageconstantpart - it is a sequence of English-only words (X ECC error ECC error) that follow immediately after the software identifier. The message type can be determined from the message constant part; in this example, the message type is an ECC error. The data matrix, DMtimebins, contains histograms of the message types by time-bins. The steps for extracting the message types and generating the data matrix are given below.
• Step 1: Split the message logs into logs of individual hours by individual days.
• Step 2: For each message log, extract the message con-stant part and store it in a list.
• Step 3: Identify the unique message constantsin the list and obtain the message types.
• Step 4: Count the number of message types by hour for each day in the logs.
Resource Use Extractor: The Resource Use Extractor or RUExt, extracts resource use counters from TACC Stats resource use data and presents the resource use counters in a form on which standard analysis algorithms can be applied. In addition to the traditional information collected by Sysstat [20], TACC Stats records hardware performance monitoring data, Lustre file-system operation counts and InfiniBand device usage. An example of a resource use log extracted from TACC Stats is given below:
1975935 Jun 3 00:00:01 i101-101 llite /work read_bytes 830958447762 write_bytes 337810667092 direct_read 0 direct_write 0 dirty_pages_hits 47079822 dirty_pages_misses 82604275 ...
The sources of this resource use log can be identified from the job (1975935) and node (i101-101). The time that
2https://diag-toolkits.github.io/PreprocessedData/
this resource use log was recorded can be identified from the timestamp (Jun 3 00:00:01). The software component associated with this resource use log can be identified from the word (llite) that follows immediately after the node identifier; in this example, the component is the Lustre file-system. A second-level component can be identified from the word (/work) that follows immediately after the first compo-nent identifier; in this example, the second-level compocompo-nent is the work directory of the Lustre file-system. The resource use counters can be identified from the key-value pairs (e.g. read_bytes 830958447762) that follow after the second com-ponent identifier. We define a parameter name,param-name, as a triple which comprises of the software component, second-level component and resource use counter key; in this example, theparam-nameis “llite /work read bytes”. A list of resource use counters and their components is given in Table I. The data matrix, DRtimebins, contains histograms of the param-name types by time-bins. The steps for extracting the resource use counters and generating the data matrix are given below.
TABLE I
RESOURCE USE COUNTERS AND THEIR ASSOCIATED COMPONENTS.
Component Resource use counters Qty.
Lustre tx msgs, rx msgs, rx msgs dropped, tx bytes, rx bytes, 6 network rx bytes dropped
Lustre read bytes, write bytes, direct read, direct write, 23 /work dirty pages hits, dirty pages misses, ioctl, open, close,
mmap, seek, fsync, setattr, truncate, flock, getattr, statfs, alloc node, setxattr, getxattr, listxattr, removexattr, inode permission
Virtual pgpgin, pgpgout, pswpin, pswpout, pgalloc normal 21 memory pgfree, pgactivate, pgdeactivate, pgfault, pgmajfault
pgrefill normal, pgsteal normal, pgscan kswapd normal pgscan direct normal, pginodesteal, slabs scanned, kswapd steal, kswapd inodesteal, pageoutrun, allocstall pgrotated
• Step 1: Split the resource usage logs into individual hours
by individual dates.
• Step 2: For each log entry, extract the param-name and store it in a list.
• Step 3: Identify the uniqueparam-names in the list and obtain the param-name types.
• Step 4: For each param-name type in a resource use log, if the values associated with the param-name types of two consecutive log entries are different, obtain the difference and add the difference to the value obtained in the preceding operation and store the value.
D. CRUMEL: Correlation
and (ii) Spearman-Rank correlation. We implemented Pearson correlation as the base algorithm to identify linear patterns and Spearman-Rank correlation as the second algorithm to identify patterns that follow a monotonically increasing function.
Pearson correlation [21] draws a line of best fit through the data of two variables, and it indicates how well the data points fit this line of best fit. It assumes a linear relationship between the data of two variables. Spearman-Rank correlation [22] assumes a monotonic relationship between the data of two ranked variables. A monotonic relationship is a relationship that does one of the following: (i) when the value of one vari-able increases, the value of the other varivari-able increases, or (ii) when the value of one variable remains and does not decrease, the value of the other variable remains and does not decrease. This assumption is less restrictive than the linear relationship assumption that has to be met by Pearson correlation. The possible values for the Pearson and Spearman-Rank correlation coefficients ranges −1 to 1. A correlation coefficient of −1
indicates a perfect negative linear or monotonic relationship, a correlation coefficient of 0indicates no linear or monotonic relationship, and a correlation coefficient of 1 indicates a perfect positive linear or monotonic relationship.
We apply the Correlation module on the resource use data and message logs separately as shown in Fig. 2. The resource use data and message logs are generated by different open-source software tools which are used in different ways. For example, TACC Stats can be activated to record resource use on the system node or the application, while the message logging stack logs messages sent by the operating system kernel, system software and user application. As a result, the log entries in the resource use data and message logs may contain different timestamps. Hence, directly correlating the resource use data with message logs by time requires padding the histograms since the correlation algorithms require that, the histograms contain the same number of data points on the x-axis. However, our objective is not to correlate the resource use data with message logs, but to identify patterns in the resource use data and message logs which are strongly correlated.
Once the correlation matrices have been generated, a list containing the strongly correlated events and a list containing the strongly correlated resource use counters are generated. To generate these lists, we use a process that automatically iden-tifies a correlation thresholdrthin each correlation matrix and the process is given in [13]. We use the correlation thresholds to extract the strongly correlated events, strongly correlated resource use counters and their correlation coefficients.
Next, we apply Fisher’s z-transform, the standard technique, to test the significance of the correlation coefficient [22].
F(r) =1 2ln
1 +r
1−r
(1)
where r is a correlation coefficient. We define the null hy-potheses as: (i) H0r that a pair of resource use counters are independent, and (ii) H0e that a pair of events are indepen-dent. We define the alternate hypotheses as: (i) Har that a pair of resource use counters are not independent, and (ii)
Hae that a pair of events are not independent. Under the null hypothesis H0r, F(r) approximately follows a normal distribution with meanuz =F(H0r) = 0and standard error SE= √ 1
nr−3, wherenris the number of time-bins in the pair of resource use counter-series. Under the null hypothesisH0e, F(r)approximately follows a normal distribution with mean uz=F(H0e) = 0and standard errorSE=√n1
e−3, wherene is the number of time-bins in the pair of event-series. Then, we obtain the z-score for a given correlation coefficient:
zr=
F(r)−uz
SE = (F(r)−F(H0r))× √
nr−3 (2)
ze=
F(r)−uz
SE = (F(r)−F(H0e))× √
ne−3 (3)
A large absolute value of zr and ze, e.g., 2.58 at 99% confidence level, will reject the null hypotheses in favour of the alternate hypotheses that a pair of resource use counters and a pair of events arenot independent.
III. CASESTUDY: RANGERSUPERCOMPUTER
Our study of failures is carried out in the context of the de-commissioned Ranger supercomputer at the Texas Advanced Computing Center at the University of Texas at Austin. The Ranger supercomputer was in production for five years from 2007 to 2012. It was a Linux-based cluster of 3,936 compute nodes and 112 Lustre file-system, login and visualization nodes. Each node of Ranger generates its own resource use data and messages. The messages were then sent to a centralized logging system where the logs are combined and interleaved in time.. We collected the resource use data and rationalized message logs for the months of June, July and August 2011 and a summary is given in Table II.
TABLE II
SUMMARY OF THE DATA COLLECTED ONRANGER.
Resource use data Rationalized message logs
Month Size Qty. lines Size Qty. messages
June 2011 29.8 GB 88,821,351 2.7 GB 10,021,516 July 2011 29.3 GB 92,425,427 9.6 GB 64,822,682 August 2011 29.9 GB 91,502,909 14.5 GB 114,745,476
In this section, we present our analysis of the patterns of events and resource use associated with the system failures.
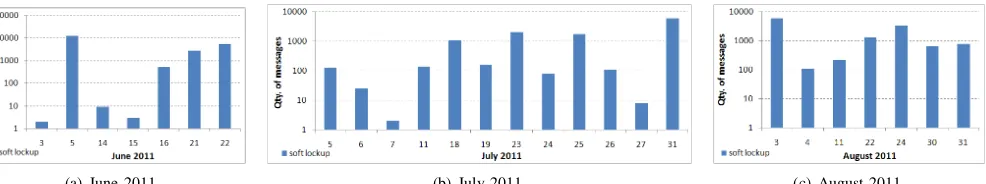
A. Compute Node Hang-ups
Compute node hang-ups are one of the most frequent source of problems for the systems administrators of the Ranger supercomputer. A compute node hang-up can be identified from a soft lockup event in the rationalized message logs: BUG: soft lockup stuck for. In June 2011, node hang-ups
(a) June 2011. (b) July 2011. (c) August 2011.
Fig. 3. Distribution (log-scale) of soft lockup events on Ranger.
B. Phase 1: Identify the Correlated Events
In the first phase of our study, we determine: (i) which events are strongly positive correlated to soft lockup events, and (ii) what are the differences in the correlated events dates identified by Pearson correlation and Spearman-Rank correlation. We obtained from the event correlation reports, the events that are strongly correlated to soft lockup events. We presented the list of correlated events to the systems administrators and identify the following errors leading to soft lockups: (1) Process errors, (2) Network errors, (3) Memory errors, (4) File-system errors, (5) Page faults, and (6) Lustre Evict/RPC protocol errors. A summary of the soft lockup dates associated with the error groups and the error groups identified by a CRUMEL-instance is given in Table III.
TABLE III
SUMMARY OF SOFT LOCKUP DATES ASSOCIATED WITH ERROR GROUPS AND ERROR GROUPS IDENTIFIED BY ACRUMEL-INSTANCE.
Error CRUMEL No. of Error CRUMEL No. of
group instance dates group instance dates
Process Pearson 21 Network Pearson + 11
error error Spearman
Memory Pearson 9 File-system Pearson 11
error error
Page-fault Pearson 7 Lustre Evict/ Pearson 2
RPC error
1) Process errors: Information about the name, memory address, running CPU and state of a process is provided by a Pid: comm event. From Fig. 4(a), Fig. 4(b) and Fig. 4(c), we observed that Pid: commevents are strongly correlated to soft lockup events with scores that range 0.85 to 1 on 21 soft lockup dates. We observed that Pearson correlation identified the correlated events on 21 soft lockup dates. We observed that Spearman-Rank correlation identified the correlated events on 20 soft lockup dates. Our results show that Pearson correlation identified all the dates when process errors and soft lockup events are correlated on Ranger.
We manually scanned the messages and identified the names of the processes associated with the Pid: comm events. The names of the processes are: sge_shepherd, ipoib, AHFStep, sshd,ptlrpcd,tacc_stats,mpmc,sge_execd,ll_imp_inval andsh.sge_shepherdprovides the parent process functional-ity for a single Sun Grid Engine job. ipoibis a protocol that defines how to send IP packets over an Infiniband network. AHFStep is a program that initiates the Amiga Halo Finder software used for cosmological simulations. sshd is a Linux
secure shell daemon that provides secure encrypted commu-nication between two clients in an insecure network.ptlrpcd is a thread that takes care of sending asynchronous remote procedure calls. tacc_stats is a job-oriented and logically structured version of the conventional Sysstat system perfor-mance monitor.mpmcis an open-source Monte Carlo package used for the simulation of liquids, molecular interfaces and functionalized nanoscale materials. sge_execd controls the Sun Grid Engine queues local to the machine on which sge execd is running and executes the jobs sent from the Sun Grid Engine master to be run on these queues.ll_imp_inval is an evictor thread that starts when a client request to connect to a Lustre server is repeatedly refused. sh is the Bash shell command-line interpreter used in Linux operating systems. Our results suggest that interactions with these processes have led to compute node hang-ups.
2) Network errors: Errors in communication between the nodes can be identified byConnection to service was lost events, error occurred while communicating with events, and failed due to network error events. From Fig. 5(a), Fig. 5(b) and Fig. 5(c), we observed that network error events are strongly correlated to soft lockup events with scores that range 0.76 to 1 on 11 soft lockup dates. From Fig. 5(b), we observed that only Spearman-Rank correlation identified the network error events on July 26 2011, and only Pearson correlation identified the network error events on July 6, 7 and 19 2011. Our results show that Pearson and Spearman-Rank correlation are required to identify all the dates when network errors and soft lockup events are correlated on Ranger.
The network errors can be caused by high network resource utilization and unresponsive servers. For example, when a client node sends a request to connect to an unresponsive server, the server will refuse the connection. The client then activates its timeout. When the clients timeout expires, it attempts a reconnection to the server. When multiple client reconnection requests are refused by unresponsive servers, it may lead to the client hang-up. Our results suggest that network errors have led to compute node hang-ups.
(a) June 2011. (b) July 2011. (c) August 2011.
Fig. 4. Correlation of Pid: comm events to soft lockup events.
[image:7.612.54.557.145.285.2](a) June 2011. (b) July 2011. (c) August 2011.
Fig. 5. Correlation of Connection to service was lost, error occurred while communicating with, and failed due to network error events to soft lockup events. The events circled in red were identified by Spearman-Rank correlation only. The events circled in black were identified by Pearson correlation only.
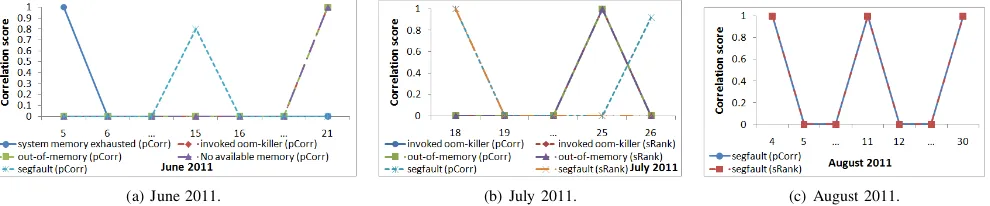
(a) June 2011. (b) July 2011. (c) August 2011.
Fig. 6. Correlation of system memory exhausted, invoked oom-killer, out-of-memory, No available memory and segfault events to soft lockup events.
correlation identified the correlated memory error events on 9 soft lockup dates. We observed that Spearman-Rank cor-relation identified the correlated memory error events on 5 soft lockup dates. Our results show that Pearson correlation identified all the dates when memory errors and soft lockup events are correlated on Ranger.
The memory errors are often caused by memory access violations in buggy software in the Linux operating system. For example, the job of the Linux operating systemoom-killer
is to remove one or more processes in order to free up memory on the node. However, the oom-killer is vulnerable to memory leaks and in some cases, these memory leaks may cause the oom-killer to crash which in turn causes the operating system on the node to crash. Our results suggest that memory errors have led to compute node hang-ups.
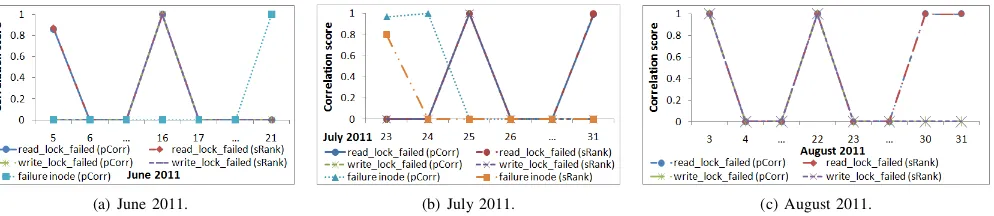
4) File-system errors: Errors in the file-system can be identified from the following log events: read_lock_failed, write_lock_failed and failure inode. From Fig. 7(a), Fig. 7(b) and Fig. 7(c), we observed that file-system error events are strongly correlated to soft lockup events with scores that range 0.8 to 1 on 11 soft lockup dates. We observed that
Pearson correlation identified the correlated file-system errors on 11 soft lockup dates. We observed that Spearman-Rank correlation identified the correlated file-system errors on 10 soft lockup dates. Our results show that Pearson correlation identified all the dates when file-system errors and soft lockup events are correlated on Ranger.
A hung client that fails to release a read or write lock on the data it holds can result in a deadlock when another client attempts to access the same data. In another example, an inode provides information that a client needs to access files stored on multiple storage servers. However, when a client attempts to access information it needs on a corrupted inode, this information is lost. Our results suggest that deadlocks and inode failures have led to compute node hang-ups.
[image:7.612.62.557.328.431.2](a) June 2011. (b) July 2011. (c) August 2011.
Fig. 7. Correlation of read lock failed, write lock failed and failure inode events to soft lockup events.
[image:8.612.59.558.183.289.2](a) June 2011. (b) July 2011. (c) August 2011. (d) June and July 2011.
Fig. 8. Correlation of page fault events (a - c) and Lustre Evict/RPC events (d) to soft lockup events.
identified the correlated page faults on 7 soft lockup dates. We observed that Spearman-Rank correlation identified the correlated page faults on 5 soft lockup dates. Our results show that Pearson correlation identified all the dates when page faults are correlated to soft lockup events on Ranger.
A page fault is raised by the hardware when a running program accesses a memory page that is mapped into a virtual address space, but not loaded in physical memory. When a page fault occurs, the operating system page fault handler will be invoked. The page fault handler must locate a free space in memory, or choose to free up space in memory for use by the program data. If the latter (also called a major page fault) is chosen, it will incur additional disk latency to an already interrupted program execution. Our results suggest that page faults have led to compute node hang-ups.
6) Lustre Evict/RPC Protocol errors: Errors in the Lustre Evict/RPC protocol can be identified from the following key-words in the log events:evicted. From Fig. 8(d), we observed that evicted events are strongly correlated to soft lockup events with scores that range 0.92 to 1 on 2 soft lockup dates. We observed that Pearson correlation identified the correlated evicted events on 2 soft lockup dates. We observed that Spearman-Rank correlation identified the correlated evicted events on 1 soft lockup date. Our results show that Pearson correlation identified all the dates when evicted events are correlated to soft lockup events on Ranger.
The Lustre Evict/RPC protocol is designed to free the file-system resources that are being held by unresponsive clients. However, timing mismatches that result from communication errors between the Lustre clients and servers, a fault that is well-known to the system administrators, could lead to the hang-up of client nodes. Our results suggest that communica-tion errors between the Lustre clients and servers have led to
compute node hang-ups.
C. Phase 2: Identify the Correlated Resource Use Counters
The first phase of CRUMEL is characterized by the identifi-cation of error groups that lead to compute node soft lockups. The existence of related error messages in the log files confirm the presence of errors in the system. However, the objective of this paper is to understand the occurrence of patterns, i.e., correlations that will point to these error messages. To achieve this, we need to identify and understand the link between the resource usage counters and the error groups.
Thus, in the second phase of our study, we determine: (i) which resource use counters are strongly positive correlated to the Lustre file-systemread_bytes,write_bytesandioctl resource use counters3, and (ii) what are the differences in the correlated resource use counters dates identified by Pearson correlation and Spearman-Rank correlation. The Lustre I/O activities are recorded by the read_bytes, write_bytes and ioctl counters. We obtained from the resource use corre-lation reports, the resource use counters that are strongly correlated to the Lustre file-systemread_bytes,write_bytes and ioctl resource use counters. We presented the list of correlated resource use counters to the systems administrators and identify the following components associated with Lustre I/O activity: (1) Lustre network, (2) Linux O/S virtual memory. A summary of the correlated resource use counters identified by a CRUMEL-instance is given in Table IV.
The lnet tx_msgs and lnet rx_msgs counters record the quantity of messages that were transmitted in the
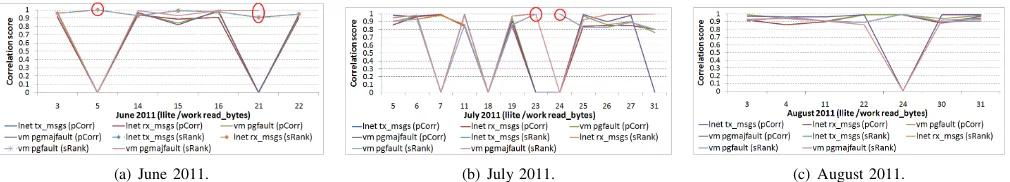
(a) June 2011. (b) July 2011. (c) August 2011.
Fig. 9. Correlation of lnet tx msgs, lnet rx msgs, vm pgfault and vm majpgfault to llite /work read bytes on Ranger. The counters circled in red were identified by Spearman-Rank correlation only.
[image:9.612.61.558.183.273.2](a) June 2011. (b) July 2011. (c) August 2011.
Fig. 10. Correlation of lnet tx msgs, lnet rx msgs, vm pgfault and vm majpgfault to llite /work write bytes on Ranger. The counters circled in red were identified by Spearman-Rank correlation only. The counters circled in black were identified by Pearson correlation only.
[image:9.612.141.475.310.404.2](a) June 2011. (b) July 2011.
Fig. 11. Correlation of lnet tx msgs, lnet rx msgs, vm pgfault and vm majpgfault to llite /work ioctl on Ranger.
TABLE IV
SUMMARY OF CORRELATED RESOURCE USE COUNTERS.
Lustre Counter CRUMEL Lustre Counter CRUMEL
counter instance counter instance
read lnet tx msgs Spearman write lnet tx msgs Pearson
bytes lnet rx msgs bytes lnet rx msgs and
vm pgfault vm pgfault Spearman
vm maj- vm
maj-pgfault pgfault
ioctl lnet tx msgs Pearson lnet rx msgs or
vm pgfault Spearman vm majpgfault
tre network. The vm pgfault and vm majpgfault
coun-ters record the quantity of page faults in the Linux O/S. From Fig. 9, Fig. 10 and Fig. 11, we observed that the resource use counters lnet tx_msgs, lnet rx_msgs, vm pgfault and vm majpgfault are strongly correlated to read_bytes, write_bytes and ioctl. Our results show a strong relationship between: (1) Lustre activity and Lustre network usage, and (2) Lustre activity and Linux page-faults.
Correlation with read bytes: From Fig. 9(a), Fig. 9(b) and Fig. 9(c), we observed that Pearson correlation identified the correlated resource use counters on 21 soft lockup dates. We observed that Spearman-Rank correlation identified the
correlated resource use counters on 25 soft lockup dates. Our results show that Spearman-Rank correlation identified all the dates when lnet tx_msgs, lnet rx_msgs, vm pgfault and vm majpgfaultare correlated to read_byteson Ranger.
Correlation with write bytes: From Fig. 10(a), Fig. 10(b) and Fig. 10(c), we observed that Pearson correlation identified the correlated resource use counters on 18 soft lockup dates. We observed that Spearman-Rank correlation identified the correlated resource use counters on 24 soft lockup dates. However, from Fig. 10(b), we observed that only Pearson correlation identified a strong correlation betweenvm pgfault andwrite_byteson July 31 2011. Our results show that Pear-son and Spearman-Rank correlation are required to identify all the dates whenlnet tx_msgs,lnet rx_msgs,vm pgfaultand vm majpgfaultare correlated to write_byteson Ranger.
toioctlon Ranger.
D. Validation
Next, we test the significance of: (i) the correlation coeffi-cient of the strongly correlated events in each error group, (ii) the correlation coefficient of the strongly correlated resource use counters associated with Lustre activity, Lustre network and Linux virtual memory. We are interested in positive
correlated events andpositivecorrelated resource use counters. We obtained the correlation z-scores and the summaries are given in Tables V and VI.
TABLE V
SUMMARY OF THE CORRELATION Z-SCORES FOR THE ERROR GROUPS. THE SAMPLE SIZE,n,CONTAINS THE NUMBER OF HOURLY TIME-BINS IN
ONE DAY’S WORTH OF RATIONALIZED MESSAGE LOGS.
Error group June 2011 July 2011 August 2011
(sample size,n)
Process error 10.53≤ze 9.17≤ze 9.90≤ze (15≤n≤24) ≤12.13 ≤12.13 ≤12.13
Memory error 5.03≤ze 7.28≤ze 11.84≤ze (23≤n≤24) ≤12.13 ≤12.13 ≤12.13
Page-fault ze= 12.13 ze= 12.13 11.84≤ze
(23≤n≤24) ≤12.13
Network error ze= 12.13 4.57≤ze 11.84≤ze
(23≤n≤24) ≤12.13 ≤12.13
File-system error 6.11≤ze 9.59≤ze 9.90≤ze (17≤n≤24) ≤12.13 ≤12.13 ≤12.13
Lustre Evict/RPC error ze= 12.13 ze= 12.13 -(n= 24)
From Table V, we observed that the z-scores for all the error groups range from 4.57 to 12.13. At the 99% confidence level, under the null hypothesis,z0e= 2.58. Hence, we reject the null hypothesis in favour of the alternate hypothesis.
Next, we determine the probability of rejecting the null hypothesis when it is true. From Table V, we observed the smallest correlation z-score ze= 4.57. We apply a one-sided test and use the significance level, α = 0.01 for a given hypothesis test to obtain a P-value. Since this is a one-sided test, the P-value is equal to the probability of observing a value greater than4.57in the standard normal distribution, or P(Z >4.57) = 1−P(Z ≤4.57) = 1−0.9999976 = 2.4e−06. The P-value is less than 0.01, indicating it is highly unlikely this result would be observed under the null hypothesis. The P-values we obtained for all the z-scores in Table V are also less than 0.01, indicating it is highly unlikely these results would be observed under the null hypothesis.
TABLE VI
SUMMARY OF THE CORRELATION Z-SCORES FOR THE CORRELATED RESOURCE USE COUNTERS(CORRRUD)GROUPS. THE SAMPLE SIZE,n,
CONTAINS THE NUMBER OF HOURLY TIME-BINS IN ONE DAY’S WORTH OF
TACC STATS RESOURCE USAGE DATA.
CorrRUD group June 2011 July 2011 August 2011
(sample size,n)
Lustre I/O – Lustre network 6.52≤zr 4.56≤zr 4.67≤zr
(n= 24) ≤12.13 ≤12.13 ≤12.13
Lustre I/O – Linux O/S VM 4.46≤zr 4.56≤zr 4.45≤zr
(n= 24) ≤12.13 ≤12.13 ≤12.13
From Table VI, we observed that the z-scores for all the correlated resource use counters groups range from 4.45 to
12.13. At the 99% confidence level, under the null hypothesis, z0r= 2.58. Hence, we reject the null hypothesis in favour of the alternate hypothesis.
Next, we determine the probability of rejecting the null hypothesis when it is true. TheP-values for all the z-scores in Table VI are less than0.01, indicating it is highly unlikely these results would be observed under the null hypothesis.
IV. RELATEDWORK
In [23], a method that uses a feature construction scheme to rank system log messages that are important for problem diagnosis was presented. The feature construction scheme evaluates Pearson correlation and Spearman-Rank correlation based clustering for identifying clusters of messages. In con-trast, CRUMEL evaluates Pearson correlation and Spearman-Rank correlation to identify patterns of errors and resource use in the message logs and resource use data. In [24], a metric that measures correlations of events and an algorithm called event correlation graphs are proposed. The algorithm was applied on the system message logs of two HPC systems and predicted failure and non-failure events in these systems. In [4], a time-anomaly correlation approach called SIGs was developed to infer influences between interacting components in the sys-tem message logs. In [12], the Wilcox Rank-sum correlation method was applied on system performance data to monitor and predict processor failures. CRUMEL complements these approaches by identifying patterns of errors and resource use in the message logs and resource use data.
[18] and [13] which are the predecessors of CRUMEL apply only Pearson Correlation. In Fig. 5(b) in Section III-B, we showed that the network error event correlated with node failure on July 26 2011 was identified by Spearman-Rank correlation only, but network error events correlated with node failures on other dates in July 2011 were identified by Pearson correlation only. If Pearson correlation is used as the only correlation method, the correlated network error event on July 26 2011 would not be identified. CRUMEL has shown that the errors and resource use are linearly and monotonically correlated with compute node hang-ups. It also identified two more error groups associated with compute node hang-ups. They are: (i) process errors, (ii) file-system errors.
Several tools such as IPLOM [25], LoGs [26],
SLCT/Loghound [27] and SEC [28] have been developed to automate processing of system message logs. Fluentd4 is an open-source data collector that process multiple application logs. CRUMEL complements these tools by processing both the Rationalized message logs and TACC Stats resource use data collected on open-source cluster systems.
A number of works have shown that message logs are useful for classifying log messages into semantic categories that accurately replicated the manual annotation of messages [29], and for establishing six groups of errors associated with compute node hang-ups [30]. In this paper, we confirmed that the six groups of errors are associated with compute node
hang-ups. We also showed that Lustre I/O counters can be used to monitor Lustre file-system and network errors.
V. DISCUSSION
In this section, we discuss one limitation of the CRUMEL diagnosis framework: correlated resource use counters and correlated error events. We do not take into account resource use counters that are not correlated. For example, a popular application may spawn one process which performs only read operations and several processes which perform only write operations to a file-system. When these processes are executed, they may trigger a spike in the file-system write_bytes resource use counter which may cause the file-system to slow and eventually hang. We also do not take into account error events that occur on non-failure dates. That being said, we argue that this pertains to the problem described in Section II-B, i.e., we seek to identify the resource use counters and error events that are correlated on the dates of failures..
VI. CONCLUSION ANDFUTUREWORK
We presented the CRUMEL framework that correlated both the message logs and resource use data to identify errors and resource usage patterns. We showed that the new approach to integration of resource use data and message logs, and the use of multiple correlation algorithms can identify more events associated with system failures. The framework confirmed six groups of errors, identified Lustre I/O resource use counters that are correlated with occurrence of Lustre faults that are potential flags for online detection of failures, matched the dates when correlated errors and correlated resource use counters are associated with the dates of compute node hang-ups, and identified two more error groups - process errors and file-system errors - associated with compute node hang-ups.
In our future work, we plan to extend our analyses of patterns in resource use and message logs to deal with failure types other than Lustre file-system and node failures.
ACKNOWLEDGEMENTS
We would like to thank the Texas Advanced Computing Center (TACC) for providing the Ranger cluster log data. This research is supported in part by the National Science Foundation under OCI awards #0622780 and #1203604 to TACC at the University of Texas at Austin. We also thank Dr. Zhou Changjiu and Singapore Polytechnic senior management for allowing the principal author to complete this work.
REFERENCES
[1] W. Xu, L. Huang, A. Fox, D. Patterson, and M. Jordan, “Mining console logs for large-scale system problem detection,” inProceedings of 3rd Workshop on Tackling Computer Systems Problems with Machine Learning Techniques, December 2008.
[2] A. J. Oliner, A. Aiken, and J. Stearley, “Alert detection in system logs,” inProceedings of IEEE ICDM, December 2008, pp. 959–964. [3] T. Reidemeister, M. A. Munawar, M. Jiang, and P. A. Ward, “Diagnosis
of recurrent faults using log files,” inProceedings of the 2009 Con-ference of the Center for Advanced Studies on Collaborative Research, 2009, pp. 12–23.
[4] A. J. Oliner, A. V. Kulkarni, and A. Aiken, “Using correlated surprise to infer shared influence,” inProceedings of IEEE/IFIP DSN, 2010, pp. 191–200.
[5] S. P. Kavulya, S. Daniels, K. Joshi, M. Hiltunen, R. Gandhi, and P. Narasimhan, “Draco: Statistical diagnosis of chronic problems in large distributed systems,” inProceedings of IEEE/IFIP DSN, 2012, pp. 1–12. [6] F. Salfner and S. Tschirpke, “Error log processing for accurate failure prediction,” in 1st UNIX Workshop on the Analysis of System Logs, December 2008.
[7] A. Gainaru, F. Cappello, M. Snir, and B. Kramer, “Fault prediction under the microscope: A closer look into hpc systems,” inProceedings of IEEE/ACM SC Conference, 2012, pp. 1–12.
[8] A. Pelaez, A. Quiroz, J. C. Browne, E. Chuah, and M. Parashar, “Online failure prediction for hpc resources using decentralized clustering,” in Proceedings of IEEE HiPC, 2014, pp. 1–9.
[9] J. Hammond, “Tacc stats: I/o performance monitoring for the intransi-gent,” inInvited Keynote for the 3rd IASDS Workshop, 2011, pp. 1–29. [10] Q. Guan, D. Smith, and S. Fu, “Anomaly detection in large-scale coalition clusters for dependability assurance,” inProceedings of IEEE HiPC, 2010, pp. 1–10.
[11] G. Bronevetsky, I. Laguna, B. R. de Supinski, and S. Bagchi, “Auto-matic fault characterization via abnormality-enhanced classification,” in Proceedings of IEEE/IFIP DSN, 2012, pp. 1–12.
[12] F. Salfner, P. Troeger, and S. Tschirpke, “Cross-core event monitoring for processor failure prediction,” inProceedings of HPCS DMCC Workshop, 2009, pp. 67–73.
[13] E. Chuah, A. Jhumka, S. Narasimharmuthy, J. Hammond, J. C. Browne, and B. Barth, “Linking resource usage anomalies with system failures from cluster log data,” inProceedings of IEEE SRDS, 2013, pp. 1–10. [14] N. Gurumdimma, A. Jhumka, M. Liakata, E. Chuah, and J. C. Browne,
“Towards increasing the error handling time window in large-scale dis-tributed systems using console and resource usage logs,” inProceedings of IEEE ISPA, 2015, pp. 1–10.
[15] ——, “Crude: Combining resource usage data and error logs for accurate error detection in large-scale distributed systems,” in Proceedings of IEEE SRDS, 2016, pp. 1–10.
[16] ——, “Towards detecting patterns in failure logs of large-scale dis-tributed systems.”
[17] J. L. Hammond, T. Minyard, and J. Browne, “End-to-end framework for fault management for open source clusters: Ranger,” inProceedings of ACM TeraGrid, no. 9, 2010.
[18] Z. Zheng, L. Yu, Z. Lan, and T. Jones, “3-dimensional root cause diagnosis via co-analysis,” in Proceedings of ACM ICAC, 2012, pp. 181–190.
[19] IEEE,IEEE Std 1003.1-2001 Standard for Information Technology — Portable Operating System Interface (POSIX) Base Definitions, Issue 6. IEEE Standards, 2001.
[20] T. T. Project, http://sebastien.godard.pagesperso-orange.fr/.
[21] P.-N. Tan, M. Steinbach, and V. Kumar,Introduction to Data Mining. Addison-Wesley, 2006.
[22] R. E. Walpole, R. H. Myers, and S. L. Myers,Probability and Statistics for Engineers and Scientists. Prentice Hall International, 1998. [23] S. Sabato, E. Yom-Tov, A. Tsherniak, and S. Rosset, “Analyzing system
logs: A new view of what’s important,” in 2nd USENIX workshop on Tackling Computer Systems Problems with Machine Learning Tech-niques, 2007.
[24] X. Fu, R. Ren, J. Zhan, W. Zhou, Z. Jia, and G. Lu, “Logmaster: Mining event correlations in logs of large-scale cluster systems,” inProceedings of IEEE SRDS, 2012, pp. 1–10.
[25] A. Makanju, A. N. Zincir-Heywood, and E. E. Milios, “Clustering event logs using iterative partitioning,” inProceedings of ACM SIGKDD, 2009, pp. 1255–1264.
[26] J. E. Prewett, “Listening to your cluster with logs,” in5th LCI Interna-tional Conference on Linux Clusters, 2004.
[27] R. Vaarandi, “Mining event logs with slct and loghound,” inProceedings of IEEE/IFIP NOMS, 2008, pp. 1071–1074.
[28] J. P. Rouillard, “Real-time log file analysis using the simple event correlator (sec),” inProceedings of 18th USENIX Conference on System Administration, 2004, pp. 133–150.
[29] S. Jain, I. Singh, A. Chandra, Z.-L. Zhang, and G. Bronevetsky, “Extracting the textual and temporal structure of supercomputing logs,” inProceedings of IEEE HiPC, 2009, pp. 254–263.