Magnetic Susceptibility-Weighted MR Phase
Imaging of the Human Brain
Alexander Rauscher, Jan Sedlacik, Markus Barth, Hans-Joachim Mentzel, and Ju¨rgen R. Reichenbach
BACKGROUND AND PURPOSE: MR gradient echo imaging is sensitive to the magnetic susceptibility of different tissue types. The purpose of this study was to investigate the diagnostic potential of MR phase imaging of the human brain.
METHODS:High-spatial-resolution, T2*-weighted, single-echo images were acquired in five volunteers and one patient with a brain tumor on a 1.5T system by applying a 3D, first-order, velocity-compensated gradient echo sequence by using a quadrature transmit-receive head coil. Phase images were reconstructed from the raw data and unwrapped by using a region-growing phase-unwrapping algorithm. Low-spatial-frequency components originating from static back-ground susceptibility effects were removed by high-pass filtering.
RESULTS:Phase images showed excellent image contrast and revealed anatomic structures that were not visible on the corresponding magnitude images.
CONCLUSION: Improved processing of susceptibility-weighted MR phase images offers a new means of contrast for neuroimaging applications.
Phase images contain valuable information that can be used in many MR applications such as phase-contrast angiography (1), blood oxygenation level de-pendent MR venography (2, 3), the computation of field maps for the geometric correction of echo pla-nar images (EPI; 4) or MR thermometry (5). Al-though phase information is easily obtained with ev-ery imaging sequence, it often remains unused. The main reason for this is the fact that phase is only defined in the range of (⫺,⫹). Thus, before all further processing steps, phase unwrapping must be applied to the phase images. One common, fast, and easily implemented method is to use a homodyne demodulation reference (6), which operates on the k-space data. The drawbacks of this method are that all information below a certain spatial frequency is lost and that phase unwrapping is not necessarily achieved everywhere in the final reconstructed (3D) image. Regions with a steep phase topography (e.g., tissue-air interfaces) are especially prone to artifacts
from incomplete unwrapping. This problem is aggra-vated by the long echo time (TE) that is necessary for susceptibility-weighted imaging (SWI). Recently, phase-unwrapping algorithms that preserve all phase information have been developed and applied to MR imaging (7–10). The resulting unwrapped phase im-ages allow more flexibility in further processing steps. In the magnitude image, contrast is governed mainly by the intrinsic tissue parameters such as proton den-sity and inherent T1 and T2 or T2* relaxation, whereas the contrast in the phase images depends on differences in local precession frequencies,⌬, which in turn depend on the bulk magnetic susceptibility of the different tissue types or different levels of blood oxygenation. This means that with a single MR mea-surement one in fact obtains two images that bear independent, nonredundant information. Phase im-ages can thus reveal anatomic structures that remain hardly visible, or even invisible, on magnitude images or combinations of magnitude and phase images, and they bear information on physiological features such as blood oxygenation (11, 12). Strong magnetic field inhomogeneities (e.g., due to imperfect shim or near air tissue interfaces) alter the local resonance fre-quency, to an extent, which may be much larger than the susceptibility difference between structures such as venous vessels and brain parenchyma. Field varia-tions from imperfect shim or large air-filled cavities, however, usually have low spatial frequencies, whereas small anatomic structures give rise to field variations with high spatial frequencies. These two kinds of field variations can be separated by high-pass Received May 12, 2004; accepted August 4.
From the Institute for Diagnostic and Interventional Radiology, Friedrich Schiller University, Jena, Germany (A.R., J.S., H.-J.M., J.R.R.); and the MR Center of Excellence, Vienna Medical Uni-versity, Vienna, Austria (A.R., M.B.).
Funded by the Deutsche Forschungsgemeinschaft (grant RE 1123/7-1).
Address correspondence to Dr. Ju¨rgen R. Reichenbach, AG Medizinische Physik Institut fu¨r Diagnostische und Interventio-nelle Radiologie Friedrich Schiller Universita¨t, Jena Philosophen-weg 3 07740 Jena, Germany.
©American Society of Neuroradiology
filtering. Applying a high-pass filter to the phase im-ages enhances small structures, and, by shifting the lower cut-off frequencies to smaller values, larger structures become more apparent, while at the same time the effects of field inhomogeneities become more prominent. It is therefore important to know the sources of contrast in phase images to be able to exploit their diagnostic value. The aim of this article is to demonstrate the potential diagnostic value of MR phase imaging.
Methods
High-spatial-resolution, T2*-weighted, single-echo images were acquired on a 1.5T system (Magnetom Vision; Siemens, Erlangen, Germany) with a 3D, first-order, velocity-compen-sated gradient echo sequence (13, 14) by using a quadrature transmit-receive bird cage head coil (typical parameters: TR, 67 ms; TE, 40 ms;␣, 25°; FOV, 25.6⫻19.2⫻64 cm; matrix, 512⫻192⫻64). Data from five volunteers and one patient with a high-grade brain tumor (glioblastoma multiforme) were evaluated. In addition, the patient was imaged with a contrast-enhanced T1-weighted, high-spatial-resolution, 3D magnetiza-tion-preparation rapid gradient echo (MP-RAGE) sequence (TR, 15 ms; TE, 5 ms; FOV, 16 cm⫻25.6 cm⫻9.6 cm; matrix, 160⫻160⫻64). Written informed consent was obtained from the patient and all volunteers participating in this study. All postprocessing was performed by using IDL (Interactive Data Language; Research Systems, Boulder, CO).
Data were zero filled, typically resulting in a matrix of 512⫻ 384 ⫻96, and 3D images were reconstructed by inverse fast fourier transform. Phase unwrapping was applied to all wrapped-phase images (9, 10). In short, the technique works as follows: each pixel is unwrapped on the basis of a slope pre-diction that is calculated from its unwrapped neighbors. If the consistency between these predictions is sufficient, the pixel is
unwrapped. If no pixels can be unwrapped, the reliability cri-teria are relaxed and the process starts again.
High-pass filtering was performed on the unwrapped phase images by subtracting a low-pass filtered, unwrapped phase image from the original unwrapped-phase image,I:
1) Hˆ共I兲⫽I⫺Lˆ (I),
whereIis the phase image andLˆ the low-pass filter operator. Low-pass filtering was performed by smoothing the image with a boxcar averaging operator of widthw⫽23 pixels. Then, the unwrapped- and filtered-phase imagesHˆ(I) were further pro-cessed by applying a minimum intensity projection (mIP),Mˆ, to several adjacent, high-pass filtered-phase images,Hˆ(I):
2) IMH⫽Mˆ关Hˆ共I兲兴
Although phase and signal intensity (magnitude) represent two different aspects of MR data, we will nevertheless refer to mIPs also in the case of phase images when no confusion can arise. All mIPs were performed along the z direction (i.e., perpendicular to the axial imaging plane).
Results
Brain Anatomy
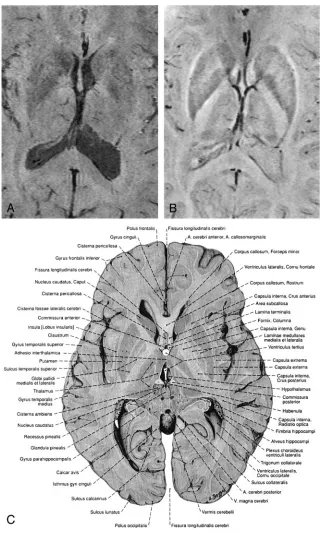
In all subjects, phase and magnitude images of the same data set show characteristic but different behav-ior that can be used as a source of additional infor-mation (Figs 2 and 3). For example, Figures 2B and 3B show phase images in which the capsula interna, the capsula externa, and even the capsula extrema can be identified and compared with anatomic images. The CSF is hardly visible on these phase images, because the resonance frequencies of CSF and paren-chyma are very similar; however, because of its long T1, the CSF appears hypointense on the magnitude
images, which leads to good contrast between the ventricles and the parenchyma (Figs 2 and 3). The large venous vessel near the left posterior horn of the ventricle is almost invisible in the magnitude image (Fig 2A) but can be clearly identified in the phase image (Fig 2B). Also noteworthy is the fact that the ventricles appear larger in the magnitude images than in the phase images (Figs 2 and 3), which is a feature of the mIP. In the magnitude data, the pixels with the least signal intensity along the path of the projection (in this case, four sections) are located in the ventri-cles. In the phase image, however, the minimum is FIG 2. Minimum intensity projections over
located in areas adjacent to the ventricles with in-creased iron content, such as the caudate nuclei. From such careful comparisons of magnitude and phase information conclusions on the relative posi-tion of anatomical features can thus be drawn.
In Figure 4, a single magnitude image (Fig 4A) and an mIP over five 1-mm-thick sections of the phase data are displayed (Fig 4B). The nucleus ruber, the substantia nigra reticulata, and the venous vascular structure show excellent contrast, which indicates the sensitivity of the sequence toward the effects of heme and nonheme iron (15, 16). In the red nuclei, the
medullary lamella separating the pars parvocellularis from the pars magnocellularis can be clearly identi-fied (17). In the magnitude image (Fig 4A), the mid-dle section of the five sections taken for the mIP in Figure 4B, the nuclei, and the veins are less pro-nounced, but the posterior horns of the lateral ven-tricles are visible.
Tumor
[image:4.585.52.373.54.587.2]FIG 4. Magnitude image (A), a mIP over 5 sections from the phase images (B) and a reproduction from an anatomic atlas. The red nuclei, the substantia nigra, the crus cerebri and venous vessels are displayed well in the phase image. The medullary lamellae in the red nuclei can be clearly identified. TR⫽67 ms, TE⫽40 ms,␣⫽ 25°, FOV⫽256⫻256⫻96 mm3, matrix
⫽512⫻256⫻96, w⫽21. (ImageCis reproduced with permission from Putz/ Pabst: Sobotta, Atlas der Anatomie des Menschen, 21. Auflage 2000, Elsevier GmbH, Urban & Fischer Verlag Mu¨nchen-Jena.)
the magnitude image (Fig 5B) of the susceptibility weighted scan nor the MP-RAGE image (Fig 5A) are able to display the tissue shift caused by the tumor as clearly as the phase image (Fig 5C). In both the magnitude and the phase image of the susceptibility-sensitive scan, the spatial heterogeneity of the tumor is clearly visible, whereas the edema is better delin-eated in the magnitude image. Although the contrast-enhanced MP-RAGE scan (Fig 5A) clearly demon-strates the rimlike enhancement pattern of the lesion, it does not reveal much of its internal structure. The detailed differentiation between different tumor parts in the magnitude (Fig 5B), and especially in the phase image (Fig 5C), however, is notable. Multiple hem-orrhagic or necrotic parts can be distinguished. For instance, the phase image shows a hyperintense area between the tumor and the basal ganglia (white ar-rows), which indicates the presence of hemosiderin associated with hemorrhage. The same region ap-pears hypointense on the magnitude image because of the strong local spin dephasing. As a result, com-bining the native (magnitude and phase) and the contrast-enhanced information of the two scans gives a much better overall characterization, thus aiding lesion delineation or potentially even biopsy.
Discussion
Phase images of a T2*-weighted, high-resolution gradient echo sequence contain a wealth of informa-tion due to subtle differences in the local resonance frequency. Phase information requires no additional scan time but is an inherent part of an MR image. After phase unwrapping in image space and high-pass filtering, phase images display small anatomic struc-tures with superb contrast and resolution, such as small veins, deep nuclei with increased iron content, or even white matter tracts, which are not easily visible on corresponding magnitude images. There is also increased contrast between cortical gray matter and white matter because of differences in local ce-rebral blood volume. Until now, interpretation of the phase information contained in the raw data was often confusing and difficult because of phase wraps. By using the proposed unwrapping technique, phase images can be unwrapped within a second on a stan-dard personal computer. For the geometric correc-tion of EPI images, for instance, the relevant infor-mation about the distortions of the static magnetic field is contained within the low spatial frequencies, whereas for high-resolution MR venography one wants to preserve the information from small ana-tomic structures. Use of a homodyne demodulation reference is a fast way to obtain high-pass filtered-phase images almost free of filtered-phase wraps. In some anatomic regions, however, phase wraps still appear and become more abundant with increasing field strength. Unwrapping the phase images in image space, on the other hand, preserves all spatial fre-quency components of the phase information and gives better results in regions of low homogeneity of the static magnetic field.
An evaluation of both magnitude and phase images of the same (susceptibility-weighted) data set results in information that may not be obtained from only the magnitude images of the same or other MR se-quences. Because the phase images are obtained to-gether with magnitude images, one has in fact two imaging modalities, one that shows a combination of T1- and T2* weighting and one that is sensitive to tissue magnetic susceptibility only and not influenced by T1 weighting. Nevertheless, both phase and mag-nitude images may be affected by the same anatomic feature, because both spin dephasing and local pre-cession frequencies are influenced. This is the case for venous vessels, where the phase of spins inside and outside venous vessels depends on the angle between the vessel and the static magnetic field. In this case, certain vessels or sections of vessels may not be visible on the phase images. The high-pass filtered-phase images can, however, be combined with the corresponding magnitude images to create BOLD MR venograms (13, 10). In BOLD venography, phase masks are computed by setting all positive values to 1 and scaling all negative phase values linearly between 0 and 1 (13). On multiplication of the phase mask with the corresponding magnitude image, the inten-sity in the parenchyma is left unchanged, whereas venous blood appears dark. This procedure ensures that small vessels at all angles yield SWI contrast. The possibility to process and visualize the acquired data in the three different modalities magnitude, phase, and venogram justifies the longer acquisition times that are inevitable when long-TE, high-resolution im-ages are to be obtained. The method may, however, benefit from the shorter TEs at higher field strengths (18) or parallel imaging, where the probability of motion during the scan would be considerably reduced.
The heterogeneity of tumorous tissue (Fig 5) is best visualized in the phase images, showing complex and variable patterns of different parts of the lesions, such as hemorrhagic or necrotic parts. In a recent study performed at 3T, contrast-enhanced susceptibility-weighted BOLD MR venography was shown to pro-vide more detailed information in primary brain tu-mors and metastases (18). The proposed approach in the present study of acquiring and processing high-resolution, magnetic susceptibility-weighted MR phase images at 1.5T also reveals anatomic features not visible with other MR images; however, further studies that involve histologic verification of findings in phase images are certainly necessary. Nevertheless, the rich details observed in the combined evaluation of magnitude and phase of a susceptibility-weighted scan warrant further investigation. The important fea-tures of edema, tumor shape, and size and their ef-fects on nearby anatomy can be assessed with a single susceptibility-weighted scan if magnitude data and phase data are evaluated together.
(6), which imposes limitations upon the flexibility in further processing, because it inherently is a tradeoff between unwrapping and high-pass filtering (20). By using 3D acquisition and an alternative postprocess-ing scheme, we were able to obtain phase images with high resolution and rich contrast at a clinical field strength of 1.5T.
Conclusion
We have demonstrated the potential of MR phase imaging and emphasized that susceptibility-weighted phase images bear additional information that is not accessible in the magnitude images alone.
References
1. Dumoulin C.Phase contrast MR angiography techniques.Magn Reson Imaging Clin N Am1995;3:399 – 411
2. Reichenbach JR, Jonetz-Mentzel L, Fitzek C, et al.High resolution blood oxygen level dependent MR venography (HRBV): a new technique.Neuroradiology2001;43:364 –369
3. Reichenbach JR, Haacke EM.High-resolution BOLD venographic imaging: a window into brain function. NMR Biomed 2001;14: 453– 467
4. Jezzard P, Balaban RS.Correction for geometric distortion in echo planar images from field variations.Magn Reson Med1995;34:65–73 5. Quesson B, de Zwart JA, Moonen CT.Magnetic resonance tem-perature imaging for guidance of thermotherapy.J Magn Reson Imaging2000;12:525–533
6. Noll DD, Nishimura DG, Makovski A.Homodyne detection in magnetic resonance imaging.IEEE Trans Med Imaging 1991;10: 154 –163
7. Chavez S, Xiang QS, An L.Understanding phase maps in MRI: a new cutline phase unwrapping method.IEEE Trans Med Imaging
2002;21:966 –977
8. Cusack R, Papadakis N.New robust 3-D phase unwrapping algo-rithms: application to magnetic field mapping and undistorting echoplanar images.Neuroimage2002;16:754 –764
9. Xu W, Cumming I.A region growing algorithm for InSAR phase unwrapping.IEEE Tran Geosci Remote Sensing1999;37:124 –134 10. Rauscher A, Barth M, Reichenbach JR, et al.Automated
unwrap-ping of MR phase images applied to BOLD MR-venography at 3 Tesla.J Magn Reson Imaging2003;18:175–180
11. Hoogenraad FG, Reichenbach JR, Haacke EM, et al. In vivo measurement of changes in venous blood-oxygenation with high resolution functional MRI at 0.95 Tesla by measuring changes in susceptibility and velocity.Magn Reson Med1998;39:97–107 12. Haacke EM, Lai S, Reichenbach JR, et al.In vivo measurement of
blood oxygen saturation using magnetic resonance imaging: a di-rect validation of the blood oxygen level-dependent concept in functional brain imaging.Hum Brain Mapping1997;5:341–346 13. Reichenbach JR, Venkatesan R, Schillinger D, Haacke EM.Small
vessels in the human brain: MR-venography with deoxyhemoglobin as an intrinsic contrast agent.Radiology1997;204:272–277 14. Reichenbach JR, Essig M, Haacke EM, et al. High-resolution
venography of the brain using magnetic resonance imaging.
MAGMA1998;6:62– 69
15. Hallgren P, Sourrander B.The effect of age on the non-haemian iron in the human brain.J Neurochem1958;3:41–51
16. Ogg RJ, Langston JW, Haacke EM, et al.The correlation between phase shifts in gradient-echo MR images and regional brain iron concentration.Magn Reson Imaging1999;17:1141–1148
17. Pu Y, Liu Y, Hou J, Fox P, Gao J.Demonstration of the medullary lamellae of the human red nucleus with high-resolution gradient-echo MR imaging.AJNR Am J Neuroradiol2000;21:1243–1247 18. Barth M, No¨bauer-Huhmann IM, Reichenbach JR, et al.
High-resolution 3D contrast-enhanced BOLD MR-venography (CE-MRV) of brain tumors at 3 Tesla: first clinical experience and comparison with 1.5 Tesla.Invest Radiol2003;38:409 – 414 19. Abduljalil AM, Schmalbrock P, Novak V, Chakeres D.Enhanced
gray and white matter contrast of phase susceptibility-weighted images in ultra-high-field magnetic resonance imaging. J Magn Reson Imaging2003;18:284 –290