RESEARCH ARTICLE
VALUE CHAIN PREDICTORS OF MILK PRODUCTION ON SMALLHOLDER DAIRY FARMS IN
WESTERN KENYA: A MULTIPLE REGRESSION ANALYSIS
1,2*
Wanjala, Simon P. Omondi and
1Njehia, Bernard, K.
1Department of Agribusiness Management and Trade, Kenyatta University, P.O. Box 43844-00100,
Nairobi, Kenya
2Kenya Agricultural Research Institute, Muguga North, P.O. Box 32-00902, Kikuyu, Kenya
ARTICLE INFO ABSTRACT
Value chain components are known to be important factors that determine the extent of commercialization and productivity in the agricultural sector. This study sought to assess the level of commercialization and variables influencing milk production in Butula and Butere districts of Western Kenya. 400 smallholder dairy farms were surveyed using proportional stratified random sampling, while qualitative data was collected through six focus group discussions, five informal interviews with Ministry of livestock staff and Kenya dairy Board. Household commercialization index (HCI) was used to estimate the level of commercialization. To assess which predictors are important in milk production, a total of eleven variables - Fodder, dairy meal, research technologies, credit, group membership, artificial insemination, extension, returns, linkages with buyers, community attitude and policy were put into Pearson’s correlation with milk production. Seven variables had a positive and significant correlation (p<0.01). To evaluate their collective and individual effect, multiple regression analysis was carried out. Results of the HCI revealed that the input market participation index was 0.32, while the output HCI was 0.46. The overall HCI in the area was 0.39 meaning that dairy farms in the area had a moderate market orientation. Multiple regression model explained 63.9% of the variance in milk production while the collective effect of value chain variables was found to be significant (P<0.001). The most important predictors explaining the variations in milk production were Fodder, dairy meal, research technologies, credit, group membership, artificial insemination, returns, and policy. Fodder and dairy meal had stronger beta co efficients and together explained 51% of the variation in milk yield. The results obtained suggest that multiple regression analysis may provide a rigorous and quantitative tool in selecting important value chain variables ex antein an upgrading strategy since it goes a step beyond current qualitative approaches.
Copyright © 2014 Wanjala, Simon P. Omondi et al. This is an open access article distributed under the Creative Commons Attribution License, which permits unrestricted use, distribution, and reproduction in any medium, provided the original work is properly cited.
INTRODUCTION
Kenya’s agricultural sector is the mainstay of the national economy and contributes 26% of Gross Domestic Product (GDP), while a further 27% contribution is indirect through linkages with agro-based and associated industries (GOK, 2012). About 80% of Kenya’s population of over 40 million live in the rural areas where three quarters engage in agricultural activities (GOK, 2009). The Livestock sector alone contributes 10 percent of total GDP and 30 percent of agricultural GDP, out of which the dairy sub sector (excluding live animals) contributes 4% GDP and 30 percent of livestock GDP (FAO, 2011). Smallholder dairy in Kenya is one of the most successful in Africa (Staal et al., 2008). The country has an estimated 3.5 million improved
dairy cattle and about 800 000 smallholder farmers owning 1-3 cows (Muriuki, 2003). Total milk output is about 4.5 billion litres annually, 70% of which comes from dairy cattle
*Corresponding author: Wanjala, Simon P. Omondi, Department of Agribusiness Management and Trade, Kenyatta University, P.O. Box 43844-00100, Nairobi, Kenya. E Mail: [email protected]
(KDB, 2013). Smallholders produce about 80% of marketed milk. Dairy production is concentrated in Central and Rift Valley regions. However, productivity per animal is still far below global leaders like the European Union, USA, Canada, New Zealand and South Africa where production per 305 lactation days is above 5000 litres/cow, with vertically coordinated efficient value chains (Staal et al., 2008; MPO,
2010; Gereffi et al., 2011). To address the problem of low
productivity and commercialization in the agricultural sector, Kenya Vision 2030 aims to transform agricultural sector, including dairy, from subsistence to a commercial orientation in order to deliver an annual 10% economic growth (GOK, 2007, GOK, 2010). Commercial transformation of subsistence agriculture is an important pathway towards economic growth for many agriculture dependent developing countries (von Braun et al., 1994; Pingali and Rosegrant, 1995; World Bank,
2008). Most of the studies on smallholder commercialization have to a large extent only dealt with the output side of commercialization. However, sustainable commercialization of
ISSN: 0975-833X
International Journal of Current Research Vol. 6, Issue, 04, pp.6380-6388, April, 2014
INTERNATIONAL JOURNAL OF CURRENT RESEARCH
Article History: Received 11thJanuary, 2013
Received in revised form 04thFebruary, 2014
Accepted 29thMarch, 2014
Published online 23rdApril, 2014
Key words: Value chain predictors,
Household Commercialization Index, Correlation,
smallholders also requires integration into the input markets (Pingali and Rosegrant, 1995). However, putting smallholders on a commercialization path through integration in both the input and output markets is a daunting task given the many institutional, socio economic, technological, policy and environmental challenges (Tefera et al., 2009; World Bank,
2008; Jaleta et al., 2009). It entails a systemic approach of
analyzing the entire value chain system to identify constraints to and opportunities for productivity and commercialization (Kaplinsky and Morris, 2001; GTZ, 2008). Although the value chain approach currently being promoted in Kenya, and indeed Sub Saharan Africa to link smallholders to markets is useful (NEPAD, 2002), current analytical methods used to identify intervention points are mainly qualitative (Rich et al., 2009).
Few studies have been done to come up with quantitative way of identifying the most important factors within the value chain system and also in estimating impact of proposed interventions
ex ante. Limited information also exist about the level of
commercialization of smallholder dairy farms in Kenya. There is therefore need for empirical evidence for selecting interventions based on quantitative information and demonstration of what would be the impact of such interventions before implementation. Using a case study of
Western Kenya, which has one of the highest raw milk prices in Kenya, but low milk production, the objectives of this study were to assess the level of commercialization of smallholder dairy farms using a household commercialization index and, secondly, to identify value chain predictors of milk production using multiple regression analysis.
MATERIALS AND METHODS
Study area
The study was carried out in Butula and Butere district in Busia and Kakamega counties of Western Kenya. Western Kenya lies on the Equator between latitude 0.030N to 10N and 340E to
35.300E longitude. It borders Trans Nzoia, Uasin Gishu
counties to the North, Nandi county to the East, Kisumu, Siaya counties to the South, and Uganda to the West. The region has a total population of 4.3 million people and 904 000 households (GOK, 2009). The area has an estimated 99000 smallholder dairy farmers keeping about 192300 improved dairy cattle (FAO, 2011). Western Kenya produces about 215 Million litres of milk and is a deficit region (Waithaka et al.,
2002; Wambugu et al., 2011). Both Butula and Butere lie in
Agro Climatic Zone (ACZ) Low Midland 1 (Jaetzhold et al.,
2006) characterised as sugarcane-maize zone, at an altitude of 1200-1500 Meters above sea level. Mean annual rainfall is 1500-2000 mm and is bimodal with long rains occurring in March-May and short rains October-December. Farmers practice mixed livestock-crop farming: Sugarcane is the main cash crop, while maize, cassava, beans, sorghum, millet and sweet potatoes are major food crops. Livestock kept include indigenous chicken, local zebu cattle, sheep and goats. Dairy farming is a key activity in Butula and Butere. Butula has a dairy cattle population of 3400 and about 1700 farmers, while Butere has a dairy cattle population of 2600 and about 1300 farmers (District livestock office, personal communication). Study variables
The variables investigated in this study included: House hold demographics and farm characteristics, household input market
participation (as buyer), household output market participation (as seller), Milk production on individual farms (dependent variable - dv), Eleven value chain variables (independent variables- Iv) i.e fodder, dairy meal, extension, research technologies, Artificial Insemination (AI), group membership, credit, vertical linkages with buyers, economic returns, policy and community attitude, selected through focus group discussions and key informant interviews.
Population, sample size and sampling techniques
A sample size of 400 farmers was chosen from an estimated population of 99000 farmers keeping improved dairy cattle. The sample size was determined using the formula by Kothari (2008). The sampling procedure used was Purposive Probability Proportional Sampling. Out of the four counties, two counties with highest milk deficit (Busia and Kakamega) were purposively selected. Within the chosen counties, two districts with highest number of farmers (Butula and Butere) were also purposively selected. Within the district, all divisions were stratified, while the number of farmers from each division were proportionally selected from groups and subjects for the study chosen at random from lists provided by the Livestock office. Thus 227 farmers were chosen from Butula district while 173 were selected from Butere district.
Data collection
Survey method was used to collect data on 400 dairy farms using a semi structured questionnaire. The questionnaire was first pre tested in Ugunja district, Siaya county to ensure all thematic areas in the questionnaire were clearly understood and answered by respondents. The revised questionnaire was administered by trained enumerators selected with the assistance from the Butula and Butere livestock offices. Six focus group discussions (FGDs), were carried out with farmer groups to gain a deeper understanding of factors influencing milk production. Additional data was collected from five informal interviews with the county and district livestock offices and Kenya Dairy Board to establish the general context of the milk production in the counties and districts. The researcher also used personal observations on selected farms for triangulation.
Data analysis
Household and farm characteristics
Data was entered in Statistical Package for Social Scientists (SPSS) version 19 (IBM, 2010). Analysis of household demographics and farm characteristics entailed frequency counts, percentages and means.
Estimation of level of commercialization
Commercialization was measured along a continuum from zero (total subsistence-oriented production) to unity (100% of production is sold) (Govereh et al., 1999). The household
commercialization index (HCI) was used to determine household specific level of commercialization among farmers in the study area (Govereh et al., Strasberg et al., 1999). The
index measures the ratio of the gross value of sales by household i in year j to the gross value of produce by the same
household i in the same year j expressed as a percentage.
Model specification
According to pingali and Rosegrant (1995)
Input market commercialization index (IMHCIi
)---(1)
IMHCIi = Gross value of inputs purchased hh i year j X 100
Gross value of all inputs used in milk production hh i year j
According to Govereh et al. (1999) and Strasberg et al. (1999):
Output market commercialization index (OMHCIi
---(2)
OMHCIi = Gross value of milk sold hh i year j X 100
Gross value of all milk produced by hh i year j
According to Jaleta et al.(2009)
Overall Household commercialization index---(3)
HCIi = (IMHCIi hhi year j + OMHCIi hh I year j) / 2 X 100
Measurement of relationship between value chain variables and milk production
Pearson’s Correlational analysis was carried out to explore if there was a linear relationship between eleven value chain variables and milk production. Since the responses were categorical (1= strongly disagree, 2= disagree, 3= neutral, 4 = agree and 5= strongly agree) they were re coded into dummy variables for easy interpretation of the results (Tabachnick and Fidell, 2001). Responses 1, 2 and 3 were coded 0= absence, while responses 4 and 5 were coded 1= presence of variable to enable estimation of the effect of one variable while holding all the others constant. Bivariate correlation analysis were carried out on farms producing milk.
Assessment of predictors of milk production
Multiple regression analysis was used to determine whether a group of variables together or singly predict the dependent variable (Mugenda and Mugenda, 2003; Kothari, 2008).
The implicit form of the regression equation was given as
Y = β0 + β1 X1+ β2 X2+ β3 X3+ β4 X4+ β5 X5+ β6 X6+ β7 X7+ β8 X8+ β9 X9+ β10 X10+ β11 X11
Where
Y= milk production/cow/day in litres (dependent variable) β0 = intercept (constant)
β1 to β11 are the regression coefficients
X1 to X11 were the dependent variables representing: fodder, dairy
meal, credit, extension, research technologies, artificial insemination, group membership, linkage to buyers, returns, community attitude and policy.
Multiple regression analysis was carried out in a three phase process.
Phase one: All the variables were entered in the model to determine their collective effect on milk production
Phase two:Non significant variables were dropped while only significant variables were entered in a regression analysis to produce a final model
Phase three:The effect of individual predictors was analysed using a step wise regression. Variables were entered into the model one at a time starting with the most significant variable as judged by the strength of the beta coefficient. As a single variable was added, the variance R2was calculated.
Assessment of multicollinearity
To ensure that effect produced by each IV was not as result of one or more of the other IVs, collinearity diagnostics was carried out using standard measurements of Tolerance, Variance Inflation Factor and Condition index as specified by Stevens (2009) and Tabachnick and Fidell (2001).
RESULTS AND DISCUSSION
Household characteristics
Table1 shows household and farm characteristics in the study area. About 84.3% of respondents had a monthly income of less than KES 10 000, meaning that the majority of small holder farmers belong to low income groups. This finding has implications on farmers’ participation in the input markets since it limits purchase of essential inputs necessary in increasing milk production. Average milk production in the area was 6.47 litres/cow/day, with a lactation period of 7.67 months (219 days). The short lactation period could be due to inadequate feeds and feeding regimes since feeds was identified as one of the constraints in milk production.
Level of commercialization among smallholder dairy farmers
The relevance of measuring the level of smallholder commercialization arises from the interest to make comparisons of households or farms according to their degree of commercialization (Omiti, 2009). Smallholder commercialization could be seen as the strength of the linkage between farm households and markets at a given point in time. The results of the HCI are shown in Table 3.
Table 1. Selected household and farm characteristics
Parameter Butula (N=273) Butere (N=173) Overall N=(400)
Mean SD Min Max
Age of head of household (years) 51.23 53.12 52.29 15.5 20 88
Education level
None 8.10% 6.50% 7.30%
Primary 48.30% 41.30% 44.80%
Secondary 30.10% 30.70% 30.40%
College 9.10% 15.50% 12.30%
University 4.30% 6.10% 5.20%
Monthly income (KES) %
<5000 45.50% 45.10% 45.30%
5000-10000 38.70% 39.30% 39.00%
10001-15000 7.70% 11.90% 9.80%
15001-20000 2.30% 1.30% 1.80%
>20000 5.90% 3.70% 4.80%
Herd size 2.53 2.38 2.46 1.33 1 8
No. of milking cows 1.3 0.7 1 0.63 0 3
Av milk prod/cow/day (litres) 6.47 6.47 6.47 3.88 1 20
peak prod 12.4 11.18 11.79 6.54 2 40
lactation period 7.9 7.44 7.67 1.6 5 12
( 219 days)
Av calving interval ( months) 14.4 15.3 14.77 3.9 12 36
Source: Compiled from field data
Status of selected value chain components on smallholder farms
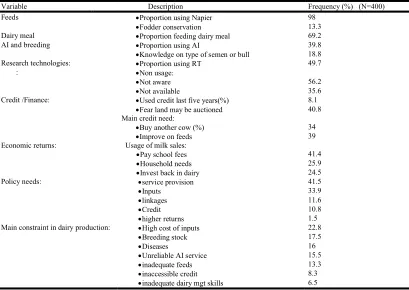
The status of value chain components are shown in Table 2.
Table 2. Summary of value chain variables
Variable Description Frequency (%) (N=400)
Feeds Proportion using Napier 98
Fodder conservation 13.3
Dairy meal Proportion feeding dairy meal 69.2
AI and breeding Proportion using AI 39.8
Knowledge on type of semen or bull 18.8
Research technologies: Proportion using RT 49.7
: Non usage:
Not aware 56.2
Not available 35.6
Credit /Finance: Used credit last five years(%) 8.1
Fear land may be auctioned 40.8
Main credit need:
Buy another cow (%) 34
Improve on feeds 39
Economic returns: Usage of milk sales:
Pay school fees 41.4
Household needs 25.9
Invest back in dairy 24.5
Policy needs: service provision 41.5
Inputs 33.9
linkages 11.6
Credit 10.8
higher returns 1.5
Main constraint in dairy production: High cost of inputs 22.8
Breeding stock 17.5
Diseases 16
Unreliable AI service 15.5
inadequate feeds 13.3
inaccessible credit 8.3
inadequate dairy mgt skills 6.5
Source: Compiled from field data
[image:4.612.101.510.404.694.2]Table 3. HCI among smallholder dairy farms in Western Kenya
Variable No Mean StdDev Min Max
Variable costs/cow/Month (KES)
291 7789.42 4584.56 200 12828
Gross
output/cow/month 291 10446.50 9025.61 1604.6 64584.61
Gross
margin/month 291 2657.08 9061.37 -5563.34 54176.86
Input market commercialization index (IMHCI)
291 0.32 0.27 0 1
Output market commercialization index(OMHCI)
291 0.46 0.34 0 1
HCI 291 0.39 0.27 0 0.94
Source: Compiled from field data
This means that the level of input market participation in the study area is low. Output market index was 0.46 (46%) which is moderate. This is consistent with previous findings by Omiti (2006) and Mathenge et al. (2010) who found that the
proportion of milk sold by households in rural Kenya was 45.9%. According to Govereh et al. (1999) and Strasberg et al.
(1999), the closer the index is to 100, the higher the degree of commercialization. Overall HCI found in the study was 0.39. This means that the level of commercialization in the area was moderate. Though commercialization was moderate, the quantities of milk produced as revealed in this study was low (6.47 lit/cow/day) and the number of grade cattle was inadequate compared to the demand. Previous studies had indicated that dairy commercialization in the area was low (Waithaka et al., 2002, Makokha et al., 2007, Wambugu et al.,
2011). However none of these studies had quantified the level of commercialization.
Correlation analysis
Results of correlation coefficient (Table 4) showed that there was significant and positive correlation between availability of fodder, dairy meal, AI, credit, group membership, policy, research technologies, returns from milk sales and average milk production on farms. This means that as these variables increase, milk production also increases and as they decrease, milk production also decreases. There was a positive relationship between extension and milk production but it was not significant. The results showed that there was a significant but negative relationship between returns and milk production. In the study area, majority of farmers used returns from milk sales to pay school fess (41.4%) and household needs (25.2%) instead of re investing on the dairy farm to increase milk production hence negative relationship (Table 2). This result is consistent with Mathenge et al. (2010) who found that the price
[image:5.612.54.302.71.206.2]of milk did not significantly affect the amount of milk sold by low income groups. Linkages with traders and attitude were not significant and all had negative relationship with milk production. Though traders offer market for milk, the proceeds are not invested back in dairy. Moreover Linkages with traders was found to be weak among large proportion of respondents. Community attitude towards keeping improved dairy breeds negatively affected milk production and hence the inverse relationship. However, the effect was not statistically significant.
Table 4. Correlation Analysis (Pearson)
Independent
variable (iv) Dependent variable (dv) Correlation coefficient (r)
P value
Feeds dummy
( fodder) Average milk production 0.599 0.000*
Dairy meal dummy Average milk production 0.656 0.000* Extension dummy Average milk production 0.568 0.251ns
Research dummy Average milk production 0.338 0.000* Artificial
insemination dummy (AI)
Average milk production 0.334 0.000*
Credit dummy Average milk production 0.519 0.000*
Economic returns
dummy Average milk production -0.145 0.014**
Group membership
dummy Average milk production 0.627 0.000*
Linkage with traders
dummy Average milk production -0.043 0.469
ns
Attitude dummy Average milk production -0.063 0.283ns
Policy dummy Average milk production 0.440 0.000*
N=291 *p< 0.01 **p< 0.05 ns not significant Source: Compiled from field data
Multiple regression analysis
The results of multiple regression are shown in the Table 5 below. The results of the saturated model showed that extension dummy, linkage with traders dummy and attitude dummy were not significant predictors and therefore were dropped from being included in the final model.
Table 5. Multiple regression results (saturated model - with all 11 variables)
Variable Standardized
beta coefficient (β) T P value
Feeds dummy ( fodder) 0.243 5.501 0.000*
Dairy mea dummy l 0.211 3.896 0.000*
Extension dummy 0.038 1.008 0.314ns
Research dummy 0.184 4.969 0.000*
Artificial insemination dummy
(AI) 0.164 4.316 0.000*
Credit dummy 0.171 3956 0.000*
Economic returns dummy -.0.101 -2.503 0.013**
Group membership dummy 0.150 2.682 0.008*
Linkage with traders dummy -0.014 -1.362 0.718ns
Attitude dummy -0.11 -0.300 0.718ns
Policy dummy 0.109 2.572 0.011**
Adjusted R2 = 0.636
F11, 291 = 47.115,
P < 0.001 N= 291 Constant 1.259 Std error 0.796
*P<0.01, **P<0.05, ns = Not significant Source: Compiled from field data
The results of the collective effect in the saturated model with all the eleven potential variables showed that extension, linkage with traders and community attitude were not significant predictors, and hence were dropped from the model.
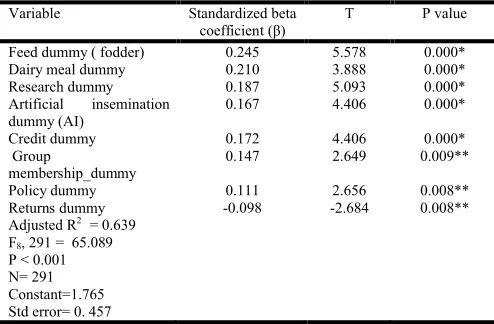
Collective effect of variables after removal of less significant variables
[image:5.612.315.552.382.568.2]Table 6. Multiple regression analysis (final model)
Variable Standardized beta
coefficient (β) T P value
Feed dummy ( fodder) 0.245 5.578 0.000*
Dairy meal dummy 0.210 3.888 0.000*
Research dummy 0.187 5.093 0.000*
Artificial insemination
dummy (AI) 0.167 4.406 0.000*
Credit dummy 0.172 4.406 0.000*
Group
membership_dummy 0.147 2.649 0.009**
Policy dummy 0.111 2.656 0.008**
Returns dummy -0.098 -2.684 0.008**
Adjusted R2 = 0.639
F8, 291 = 65.089
P < 0.001 N= 291 Constant=1.765 Std error= 0. 457 * P<0.001, ** P<0.01
Source: Compiled from field data
The adjusted R2 was 0.639. This means that the variables in
the model collectively explained 63.9% of the variance observed in milk production in the study area. The remaining 36.1% is due to other factors beyond the scope of this study. P value is less than 0.001 meaning that the model is significant and hence a good fit. The most important predictors with a big effect on milk production as judged by the strength of beta co efficients were: Feeds (fodder), dairy meal, research, credit, artificial insemination, group membership and policy. Returns had a significant but negative effect in increasing milk production. The beta coefficient for each predictor variable is the change in milk production that would result from one unit change in the predictor variable, keeping all other variables constant. For instance, the coefficient of feeds was positive and significant at 1%. According to the results, one unit change in feeds (fodder) will result in 0.245 unit change in milk production. The variance explained by the model is similar to recent results obtained by Mokhtari et al. (2012) in Iran.
Stepwise regression analysis
Stepwise regression was done to determine individual effect of selected variables on Milk production. The criteria used to determine order of entry into the model was: strength of correlation of the predictor with milk production and importance of the variable as identified by stakeholders through interviews and Focus group discussions. Using this criteria, Fodder was entered first followed by dairy meal, research, credit, AI, membership of group, policy and finally returns. The results are shown in Table 7:
Step 1: the variable of Feeds dummy was added to the equation of regression. The multiple correlation coefficient (R) equals to 0.599 and the adjusted coefficient of determination (R2 AD.)
0.357, respectively. This variable explained 35.7% of the variation related to Milk production. The regression equation in the first step was:
Y = 3.982+0.599*Feed dummy---1
Step 2: Dairymeal variable was entered at second step of analyzing regression equation. The
Multiple correlation coefficients (R) equal to 0.656 and the adjusted coefficient of determination (R2 AD.) increases to
0.510. The 15.3% of the variance in milk production is accounted for by dairymeal. Regression equation for second step was:
Y = 2.973+0.344*Feed dummy + 0.468*dairymeal---2
Step 3: the variable of research technologies was added to the equation of regression. The multiple correlation coefficient (R) equals to 0.740 and the adjusted coefficient of determination (R2AD.) 0.543, respectively. This variable explains 3.3 % of
the variation related to Milk production.
The regression equation at step three was:
Y = 2.551+0.335*Feed dummy + 0.430*dairymeal+ 0.192* Research---3
Step 4: the variable of Credit was added to the equation of regression. The multiple correlation coefficient (R) equals to 0.740 and the adjusted coefficient of determination (R2 AD.)
0.574, respectively. This variable explains 3.1 % of the variation related to Milk production.
The regression equation at step four was:
Y =1.929+0.307*Feed dummy + 0.347*dairymeal+0.181 *Research+0.208* credit---4
Step 5: the variable of AI was added to the equation of regression. The multiple correlation coefficient (R) equals to 0.762 and the adjusted coefficient of determination (R2 AD.)
0.604, respectively. This variable explains 3.0 % of the variation related to Milk production.
The regression equation at step five was:
Y =1.324+0.273*Feed dummy + 0.324*dairymeal+0.188* Research+0.213* credit + 0.180* AI---5
Step 6: the variable of Group was added to the equation of regression. The multiple correlation coefficient (R) equals to 0.794 and the adjusted coefficient of determination (R2 AD.)
0.623, respectively. This variable explains 1.9 % of the variation related to Milk production.
The regression equation at step six was:
Y =1.104+0.263*Feed dummy + 0.212*dairymeal+0.196* Research+0.166* credit
+ 0.150* AI+ 0.209 Group---6
Step 7: the variable of Policy was added to the equation of regression. The multiple correlation coefficient (R) equals to 0.800 and the adjusted coefficient of determination (R2 AD.)
0.631, respectively. This variable explains 0.8 % of the variation related to Milk production.
The regression equation at step seven was:
Y =0.850+0.241*Feed dummy + 0.2220*dairymeal+0.199 *Research+0.161* credit
+ 0.150* AI+ 0.158 Group+0.114*Policy---7
Step 8: the variable of Returns was added to the equation of regression. The multiple correlation coefficient (R) equals to 0.805 and the adjusted coefficient of determination (R2AD.)
0.639, respectively. This variable explains 0.8 % of the variation related to Milk production.
The regression equation at step eight was:
Y = 1.765+0.245*Feed dummy + 0.210*dairymeal+ 0.187*Research+0.172* credit + 0.167* AI+ 0.147 Group+ 0.111*Policy – 0.098 Returns---8
Feeds (Fodder) and dairy meal (concentrate) together accounted for 51% of the variance. This finding reinforces the important role of feeds in milk production. In both Butula and Butere, the main source of fodder was Napier grass which was used by 98% of respondents while the proportion of farmers who used dairy meal was 69.2% (Table 2). Napier has low dry matter content of less than 20% and hence cows energy requirements for both maintenance and production cannot be effectively fulfilled, hence low milk production and shorter lactation period reported (Chamberlain and Wilkinson, 2008). Inadequate feed resources both quantity and quality has been reported in several studies as the main constraint limiting milk production on smallholder farms (Karanja, 2003; Omiti, 2006, FAO, 2011). There is need therefore to diversify the fodder resource base through use of improved pastures and crop residues. Capacity building on feed conservation technologies will help enhance availability of feeds during dry season since in this study only 13.3% of farmers conserved feeds.
Research technologies explained 3.3% of the variance, underscoring the importance in increasing milk production. In the study area, 56.2% and 35.6% did not use research technologies because they were neither aware of their existence nor available. Dissemination of improved technologies to ensure availability and accessibility will positively influence milk production. Credit explained 3.1 % of variance. In the study area only 8.1 % of farmers had used credit in the last five years while 40.8% feared their land might be auctioned. Inaccessibility and un affordability of credit has been reported as one of the major constraints limiting agricultural productivity among smallholder farmers (FAO, 2011; Omiti, 2009; Agwu et al., 2012). The analysis showed that if credit
was available, priority needs as identified by farmers were improve on feeds (39%), purchase of another dairy cow (34%) and improvement of housing structure. Credit is expected to enhance farmers ability to purchase inputs, up scale operations and hence contribute to more production and greater commercialization (Lerman, 2004; Martey et al., 2012). AI
explained 3.0 % of variance, meaning that accessibility and availability of AI services had a higher probability of increasing milk production. The findings of this study show that only 39.8% of the farmers used AI while only 18.8% had knowledge of the semen type and bull used for insemination (Table 2). Since the liberalization era of 1990s, AI is one of the institutional services that has continued to decline since the private sector has been slow and ineffective in taking it up. Similar findings have been reported by Musalia et al.(2010)
and (Barret 2007).
Group membership, explained 1.9% of the variance. This means organizing farmers in dairy groups has a higher probability of increasing milk production. Group membership enhances knowledge and experience sharing, learning and innovation besides collective acquisition of services and marketing (Olwande, 2010, Agwu et al., 2012). Policy and
Returns each explained a small variance of 0.8%. Policy environment plays a key role in promoting productivity (Gamba, 2006). In this study farmers identified service provision and inputs as key areas in dairy where supportive policies were needed. The model showed that returns from milk sales had a probability of increasing milk production, though it was small. The study has shown that due to socio demographic indicators especially low incomes of the survey respondents, returns were mainly used for paying school fess and household needs, hence the marginal contribution. Mathenge et al. (2010) also observed that low income
households used returns for consumption rather than investing back in agricultural production. In general, multiple regression results showed that Feeds, dairymeal, research technologies, credit, AI, group membership, policy and returns together explained 63.9% of the variance in milk production.
Conclusion
[image:7.612.89.524.187.280.2]The findings of this study revealed that average milk production in Butula and Butere districts of Western Kenya was 6.47 litres/cow/month with a short lactation period of 7.67 months. About 98% of farmers used Napier grass as the main fodder for dairy cows while only 13.3% conserved feeds for use during dry season. The main constraint limiting dairy productivity was identified as high cost of inputs, lack of breeding stock, diseases and unreliable AI services. Results of the HCI revealed that the input market participation index was 0.32, while the ouput HCI was 0.46. The overall HCI in the area was 0.39 meaning that dairy farms in the area had a moderate market orientation. Multiple regression model explained 63.9% of the variance in milk production. This suggests that the model is a good fit. The collective effect of Table 7. Effect of individual predictors on milk production
Step Variable Multiple correlation
coefficient (R) Determination Coefficient R2 Adjusted R
2 Variance explained (%)
1 Feeds Dummy ( fodder) 0.599 0.359 0.357 35.7
2 Dairy meal Dummy 0.656 0.430 0.510 15.3
3 Research technologies Dummy 0.740 0.548 0.543 3.3
4 Credit Dummy 0.762 0.580 0.574 3.1
5 Artificial insemination Dummy (AI) 0.781 0.610 0.604 3.0
6 Group membership Dummy 0.794 0.630 0.623 1.9
7 Policy Dummy 0.800 0.640 0.631 0.8
8 Returns Dummy 0.805 0.649 0.639 0.8
value chain variables on milk production was found to be significant (P<0.001). Fodder, dairy meal, research technologies and credit were found to be the most significant (P<0.001) value chain predictors of milk production in the study area, though availability of AI services, group membership supportive policies and returns also affected milk production. Fodder and dairy meal together explained 51% of the variation in milk yield. To transform dairy development in general and milk production in particular, a hub system approach for delivery of the identified predictors, especially utilization of high quality roughages and concentrate; and strong institutional linkages should be used in the study area. The results obtained suggest that multiple regression analysis may provide a rigorous and quantitative tool in selecting important value chain variables ex anteand hence stakeholders
in an upgrading strategy since it goes a step beyond current qualitative approaches.
Acknowledgement
This study was made possible through the cooperation and collaboration of several enumerators, dairy farmers, the county directors and district livestock production officers in Butula and Butere districts and Kenya dairy Board. The study was facilitated by Kenya Agricultural Research Institute and funded by East African Agricultural Productivity Project. This paper is submitted for publication with permission from Kenyatta University.
Conflict of Interests
The authors declare there is no conflict of interests.
REFERENCES
Agwu, N.M., Anyanwu, C.I. and Mendie, E.I.2012. Socio-Economic Determinants of Commercialization among Small Holder Farmers in Abia State, Nigeria. Greener
Journal of Agricultural Sciences, Vol. 2 (8): 392-397.
Barrett, C. 2007. Smallholder market participation: Concepts and evidence from Eastern and Southern Africa. Food Policy, 33(4): 299–317.
Chamberlain, A.T. and Wilkinson, J.M. 2002. Feeding the dairy cow. Lincoln, UK: Chalcombe Publications.
FAO. 2011. Dairy development in Kenya, by HG Muriuki. Rome: Food and Agriculture Organization of the United Nations.
Gamba, P. 2006. Beef and dairy cattle improvement services: A policy perspective. Tegemeo institute Egerton University. Gereffi, G., Humphrey, J., Kaplinsky, R. and Sturgeon, T.
2011. Globalisation, Value Chains and Development. IDS Bulletin.
Govereh, J., Jayne, T. S. and Nyoro, J. 1999. Smallholder commercialization, interlinked markets and food crop productivity: Cross-country Evidence in Eastern and Southern Africa.
Government of Kenya. 2009. Population and Housing census. Nairobi: Ministry of state for Planning, National development and Vision 2030.
Government of Kenya. 2010. Agricultural Sector Development Strategy. Nairobi: Ministry of Agriculture
Government of Kenya. 2012. National agribusiness Strategy-Making kenya’s agribusiness sector a competitive driver of growth. Nairobi: Ministry of Agriculture
Government of Kenya.2007. Kenya Vision 2030. Nairobi: Ministry of state for planning, National Development and Vision 2030.
GTZ. 2008. Value links Manual: A Methodology of Value Chain Promotion. Revised ed. Eschborn: GTZ.
Jaetzold, R., Schmidt, H., Hornet, Z.B. and Shisanya, C.A.2006. Farm management handbook of Kenya. Natural conditions and farm information, vol 11/C, 2nd edn. Nairobi : Ministry of agriculture/GTZ
Jaleta, M., Gebremedhin, B and Hoekstra, D. 2009. Smallholder commercialization: Processes, determinants and impact. Discussion Paper No. 18. Improving Productivity and Market Success (IPMS) of Ethiopian Farmers Project, ILRI (International Livestock Research Institute), Nairobi, Kenya.
Kaplinsky, R., and Morris, M. 2001. A Handbook for Value Chain Research. Brighton: Institute of Development Studies, University of Sussex.
Karanja, A. M. 2003. The Dairy Industry in Kenya: The Post-Liberalization Agenda. Tegemeo Institute/Egerton University Research paper. Nairobi, Kenya. Kenya Dairy Board. 2013. Annual Report
Kilimo Trust. 2012. Strategic and value chain study of the smallholder dairy sector inCentral Kenya. Final Report by JKUAT/CAIS/KIPPRA.
Kothari, C.R. 2008. Research Methodology, Methods and Techniques. 2 Revised International New Delhi: New Age Publishers.
Lerman, Z. 2004. Policies and institutions for commercialization of subsistence farms in Transition countries. Journal of Asian Economics, 15:461–479.
Makokha S.N., Karugia J., Staal, S. and Oluoch-Kosura. 2007. Analysis of Factors Influencing Adoption of Dairy Technologies in Western Kenya. AAAE Conference Proceedings, Ghana: AAAE.
Martey, E., Al-Hassan, R. M. and Kuwornu, J. K. M. 2012. Commercialization of Smallholder Agriculture in Ghana: A Tobit regression analysis. African Journal of Agricultural Research, Vol. 7(14): 2131-2141. http://www. academicjournals.org/AJAR DOI: 10.5897/AJAR11.1743 Mathenge, M., Place, F., Olwande, J. and Mithoefer, D. 2010.
Participation in agricultural markets among the Poor and marginalized: analysis of factors Influencing participation and impacts on income and Poverty in Kenya. Tegemeo Institute Egerton University. Milk Producers Organization-South Africa. 2010. The dairy industry: Urgent for change and development.
Mokhtari, V., Ahmadpour, A. and Poursaeed, A. 2012. Regression analysis of factors in the agricultural production cooperatives success of of Ilam. Trends in Advanced Science and Engineering, 4(2): 100-109.
Mugenda, M. O. and Mugenda, G. A. 2003. Research Methods: Quantitative and Qualitative Approaches. Revised 2003.Nairobi: African Centre For Technology Studies Press.
Muriuki, H. G. 2003. Milk and Dairy Products, Post-harvest Losses and Food Safety in Sub-Saharan Africa and the Near
East, a Review of the Small Scale Dairy Sector –Kenya. Rome, Italy: Food and Agricultural Organization.
Musalia, L. M., Mukoya, S., Wangia, M., Shivairo, R. S. and Vugutsa, V. 2010. Effects of policy change on the dairy production support services within the smallholder dairy farmers in Butere/Mumias and Kakamega districts of Western Kenya. African Journal of Agricultural Research
Vol. 5(8) : 661-667.
New Partnership for African Development. 2002. Comprehensive African Agriculture Development Programme. Rome: FAO.
Olwande, J., and Mathenge, M. 2010. Market Participation among the Poor Rural Households in Kenya. Tegemeo Institute of Agricultural Policy and Development.
Omiti, J. 2006. Participatory Prioritization of issues in smallholder agricultural commercialization. KIPPRA, Nairobi. Discussion Paper No 64/2006
Omiti, J.M. 2009. Factors affecting the intensity of market participation by smallholder farmers: A case study of rural and peri-urban areas of Kenya. African Journal of
Agricultural and Resource Economics, 3(1): 57–82.
Pingali, L.P. and Rosegrant, M.W. 1995. Agricultural commercialization and diversification: Process and Polices. Food Policy, 20(3) : 171–185.
Rich, K M., Baker, D., Negassa, A. and Brent, R. 2009. Concepts, applications, and extensions of value chain analysis to livestock systems in developing countries. International Association of Agricultural Economists Conference, Beijing, China, August 16-22.
Staal S.J., Pratt, A.N. and Jabbar. M .2008. Dairy Development for the Resource Poor Part 1: A Comparison of Dairy Policies and Development in South Asia and East Africa. PPLPI Working Paper No. 44-1 ILRI.
Stevens, J.P. 2009. Applied multivariate Statistics for Social Sciences. New York: Taylor & Francis Group.
Strasberg, P.J., Jayne, T.S., Yamano, T., Nyoro, J., Karanja, D. and Strauss, J. 1999. Effects of Agricultural Commercialization on food crop input use and productivity in Kenya. Michigan State University International Development, Working Papers No. 71. Michigan, USA. Tabachnick, B.G. and Fidell, L.S. 2001. Using Multivariate
Statistics (4thEdition). Boston: Allyn & Bacon
Tefera, L., Azage, T., Ranjitha, P. and Hoekstra, D. 2009. Moving Ethiopian smallholder dairy along a sustainable commercialization path: missing links in the innovation systems Improving Productivity and Market Success (IPMS) Project. ILRI, Addis Ababa: IPMS.
Von Braun J., Bouis, H.and Kennedy, E. 1994. Conceptual framework. In: von Braun J and E. Kennedy (eds), Agricultural commercialization, economic development, and nutrition (pp. 9–33). Baltimore, Maryland: Johns Hopkins University Press.
Waithaka, M.M., Nyangaga, J.N., Staal, S.J., Wokabi, A.W., Njubi, D., Muriuki, K.G., Njoroge, L.N. and Wanjohi, P.N. 2002. Characterization of dairy systems in the Western Kenya region. Nairobi: The Smallholder Dairy (R and D) Project.
Wambugu, S., Karimi, L. and Opiyo, J. 2011. Productivity trends and performance of dairy farming in Kenya. Tegemeo Institute of Agricultural Policy and Development. Egerton University.
World Bank. 2008. Bringing agriculture to the market. World Development Report: Agriculture for Development. Washington DC: The World Bank.