Effects of Web-based Intelligent Tutoring Systems on
Academic Achievement and Retention
Abdulkadir Karaci
Kastamonu University,
Engineering and
Architecture Faculty
Turkey
Halil Ibrahim Akyuz
Kastamonu University,
Education Faculty
Turkey
Goksal Bilgici
Kastamonu University,
Education Faculty
Turkey
Nursal Arici
Gazi University, Faculty
of Technologie
Turkey
ABSTRACT
This study examines the effect of web-based intelligent tutoring systems (ITS) on academic achievement and retention. The ITS developed by Arıcı and Karacı (2013) was adapted for instruction on electronic spreadsheet software, and an experimental study was conducted with 80 undergraduate students. The experimental design involved quantitative research using a pre- and post-tests with a control group. The control and experimental groups consisted of 42 and 38 students, respectively. To measure academic achievement and retention, the researchers developed an achievement test that consisted of 27 questions. After a four-week implementation period, students that used the ITS showed higher levels of academic achievement than the control group. However, the ITS did not significantly influence retention levels.
General Terms
Intelligent tutoring system.
Keywords
Intelligent tutoring system, internet, student model, achievement, retention.
1.
INTRODUCTION
Interactive information and communication technologies are increasingly being integrated in day-to-day life [1]. For example, computers are used to support learners in learning environments to achieve more effective and efficient learning. The rapid development of educational technologies has resulted in effective instructional techniques. Specifically, the use of intelligent tutoring systems (ITS) to enhance online learning environments has allowed such environments to be widely used for instructional purposes [2, 3].
ITS is intelligent because it uses the methods and principles of artificial intelligence such as describing the knowledge level, inference mechanism, and machine learning. An ITS provides learners with opportunities for self-directed and individualized learning. Moreover, such systems provide intelligent help and guidance that enables flexibility in terms of time and space [4].
ITS architecture may vary depending on the needs of the designers. However, a traditional ITS model consists of three main components, i.e., domain, student, and teaching models [5,6]. The domain model comprises the learning content, instruction topics, and the relationships among topics. Important information about students, such as learning level, learning history, preferences, and goals, are stored in the student model. ITS intelligence stems from the system’s ability to adapt to an individual student’s characteristics. The student model monitors learning processes. Such processes are compared to an expert model to determine which topics were difficult for a particular student, when they need help,
and when they can proceed to the next topic. The last and most important ITS component is the teaching model, which involves some instruction strategies employed to provide feedback about student progress and guidance about proceeding to the most appropriate learning task [6,7].
The term ITS was coined in 1982 in Sleeman and Brown’s book “Intelligent Tutoring Systems” [8]. The first web-based ITS was reported in 1995–1996 [9]. Typically, ITS studies focus on programming languages, databases, and mathematics education. ITSs developed to teach programming languages and databases primarily involve overlay and constraint-based student models and enable students to learn by engaging in problem-solving activities [10-16]. Generally, ITSs developed for mathematics instruction employ overlay and stereotypical student models (5, 17-18). Determining student learning styles and selecting learning strategies are critical ITS functions. Therefore, studies have been conducted to identify student learning styles [19-22].
Currently, ITSs have gained importance as a supplement to formal education and as an alternative to formal education. This study aims to examine the influence of ITSs that support academic achievement and retention. The ITS developed by Arıcı and Karacı [1] was adapted for instruction about electronic spreadsheet software, and an experimental study was conducted. The most prominent feature of this ITS is its utilization of artificial intelligence techniques. The system’s intelligence stems from its ability to (1) adapt the content of the domain knowledge installed in the system based on student knowledge levels and individual competencies, and (2) to provide intelligent guidance and instruction based on learner needs. Note that the system can be accessed at http://79.123.169.199:8080/index.aspx.
2.
ITS STRUCTURE
The structure of the ITS used in this study is discussed in the following.
2.1
Student Model
The goal of the student model is to collect data for the teaching model in order to determine the pedagogical steps to follow learner actions (i.e., orientation between topics). The student model constantly communicates with the teaching and domain models [23].
Furthermore, data regarding learner interactions with the ITS are stored in the student model (i.e., topics studied/not studied, duration of activity in topics, test scores, and student responses to questions). Moreover, students’ learning levels are represented by verbal expressions, such as Might Know, Probably Knows, and Definitely Does Not Know, as well as numerical expressions according to criteria set by the instructor.
2.2
Domain Model
[image:2.595.316.542.71.184.2]The domain model stores the content that must be learned by the students. In the ITS used for this study, the domain model retains the units, topics, pages, activities, exercises, questions, and tests. Developing pages for content presentation and activities can be performed easily and does not require web design experience. Activity pages involve consolidation and practice questions. Furthermore, the instructor can enter information about the transition between topics in the domain model, as shown in Figure 1.
Fig 1: Identification of conditions and relationships of transition between topics
[image:2.595.58.277.278.372.2]The domain model is created based on the flow chart in Figure 2.
Fig 2: Structure of domain model in the ITS
2.3
Teaching Model
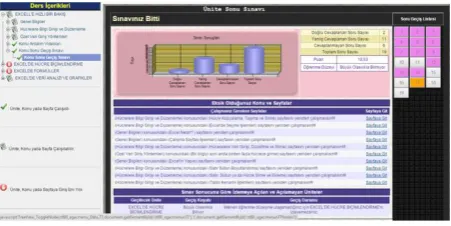
In the teaching model, the students’ learning levels represented by verbal expressions (Definitely Knows, Probably Knows, etc.), the questions they answered incorrectly, and the topics or pages that were not learned sufficiently are identified according to the information stored in the student model. If a test indicates that students have failed to reach the desired level, the pages that students must review are reported to the students (Figure 3). Furthermore, pages that require reviewing are marked in the page transition list. Students are not permitted to take the test unless they review all required pages. The system does not allow students to proceed to the next topic without first achieving the learning level set by the instructor for the given topic.
Fig 3: Reporting student learning level and pages that require reviewing
The teaching model also determines whether students sufficiently engaged the pages. The student monitoring module records information, such as page visit time, average duration studying a page, and the number of activity questions answered. The teaching model considers such information as the “level of page viewing.” Verbal expressions, such as insufficient, adequate, and good, are used to inform students and the instructor about the page watching level. If the level of page watching is insufficient, students are not allowed to take the test and are asked to review the corresponding pages. The page watching level is identified using an artificial neural network developed by Karacı and Arıcı [4].
2.4
Content Management System Module
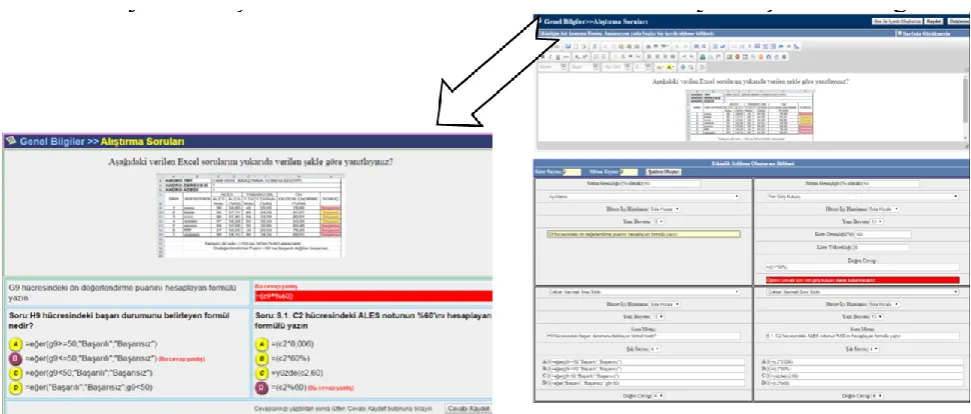
[image:2.595.317.540.429.546.2]The content management system module enables instructors to install learning content without requiring web design experience. Using this module, instructors can create information pages with various types of content, such as text, images, animations, and tables. Figure 4 illustrates the creation of a page using this module.
Fig 4: Reporting student learning level and pages that require reviewing
Pages that involve activities and practice questions can be created to consolidate learning. Text, images, animations, and tables can be added to activity pages along with fill-in-the-blank activities and multiple-choice questions using a flexible template that allows a wide range of activities. The activity questions and the text box for a student’s answer can be placed anywhere on the screen.
[image:2.595.54.278.433.556.2]Fig 5: Reporting student learning level and pages that require reviewing
2.5
ITS Features
2.5.1
Page Monitoring and Browsing Adaptation
When students exit the system or directly quit the browser, they are directed to the last page studied upon their next login. If the last viewed page is a test page, the last viewed question is shown with the time remaining from the previous session. Viewed pages and pages that can/cannot be viewed are constantly recorded and reported to the students with appropriate messages. Proceeding to subsequent pages is not allowed without viewing the current page first.
2.5.2
Reporting Test Results as Score and Verbal
Expressions
After a test, the student’s learning level is reported using verbal expressions (Definitely Does Not Know, Most Probably Does ot Know, Probably Does Not Know, Might Know, Probably Knows, Definitely Knows).
2.5.3
Intelligent Monitoring and Help
The units, topics, and pages that have not been learned sufficiently are reported to the students and they are directed to those pages. Note that students are not allowed to attempt a test without reviewing the suggested pages.
2.5.4
Access to Topics Based on Learning Level
If students fail to achieve the learning level criteria set by the instructor, access to particular topics is denied. If the criteria are achieved, the topics become open and students are informed about and directed to those topics. Monitoring Student Answers
Both students and the instructor can view the answers given in the test. Moreover, incorrect answers are reported to the instructor.
2.5.5
Page Viewing Level
The artificial neural network identifies students’ page viewing levels (page studying level) by number and duration of page visits and their answers to activity questions. Students with inadequate page view levels are not allowed to proceed to the test page and are directed to the pages that require review.
2.5.6
Content Management System:
The system consists of an advanced, user-friendly content management system that does not require web design experience to create instruction pages.
3.
METHODOLOGY
3.1
Research Design
A quantitative research method, i.e., pre-/post-tests with a control group, was employed in this study. There were 42 and 38 students in the control and experimental groups, respectively. The experimental group was instructed using the web-based ITS, and the control group was instructed using formal and traditional instructional methods. The experimental design of this study is shown in Table 1.
Table 1. Experimental Design
Group Pre
-test
Instruction Post-test
Retentio n test
E:
Experimental Group
T1 I: Instruction with ITS
T2 T3
C: Control Group
T1 T: Traditional Instruction
T2 T3
An achievement test was administered to both groups as a pre-test prior to intervention and as a post-pre-test after intervention. The same test was administered one month after intervention to measure student retention levels
3.2
Sample
The sample used in this study consisted of 80 undergraduate students from the fall term of the 2013–2014 academic year at the Kastamonu University Faculty of Education.
3.3
Data Collection Method
[image:3.595.315.544.413.531.2]Computer Education and Instructional Technologies in terms of question stems, distractors used in the questions, question coverage of the specified outcomes, and compatibility between the behavior measured by the question and the desired behavior to be measured by the outcome. The questions that were modified according to the expert opinions were applied to 120 undergraduate students who took the course in previous terms to perform item analysis.
In the pilot study, the students completed the test in approximately 30 minutes. The students’ test scores were ordered by success rate and ranked to identify high achiever and low achiever groups by selecting 33 students corresponding to the 27% lowest and highest scores among the entire group. Item analysis was performed on the collected data. The criteria specified by Turgut [25] and Tekin [26] were employed to evaluate distinctiveness while performing item analysis. According to the criteria, the distinctiveness factor of each test item should be between -1 and 1. Here, a higher item distinctiveness factor increases the validity of the test. Distinctiveness index values equal to or greater than 0.40 indicate that the item is most appropriate, values between 0.30 and 0.39 indicate appropriate items, and values between 0.20 and 0.29 indicate items that can only be used in obligatory cases with some correction and improvement. However, items equal to or less than 0.19 indicate that the item is weak and should be excluded if it is not possible to improve it. According to these measures, the items with low or negative distinctive index values were excluded from the test. As a result, eight items were excluded from the test, and the final test included 27 questions. The test was further improved by applying it to a student group who took the course in previous terms. The KR-20 Reliability Coefficient of the final version of the test was calculated as 0.75. At the end of the present study, a reliable and valid 27-item achievement test was developed and used to evaluate undergraduate student learning of electronic spreadsheet software.
3.4
Data Collection
The achievement test was applied to the experimental and control groups prior to intervention to ensure the groups were equal before the experimental study. Participant selection was on a voluntary basis, and researchers were attentive to the equality of the two groups in terms of prior computer knowledge. During the four weeks of intervention, the experimental group interacted with the web-based ITS, while the control group was involved in face-to-face instruction. Following the intervention, an achievement test was applied as a post-test to the control and experimental groups. The same test was applied again one month later to evaluate student retention.
3.5
Data Analysis
The data satisfied the normality assumptions. An independent t-test and analysis of covariance (ANCOVA) were performed to determine whether the two groups were statistically different.
4.
FINDINGS
An independent samples t-test was performed using the average pre-test scores to identify the equality of the experimental and control groups prior to conducting the experiment. The results of the analysis are given in Table 2.
Table 2. Results of t-test employing pre-test scores for Informatics-I fall term course
Group N 𝒙 T p
Pre-test
Experimental 38 3.42
−0.34 0.10
Control 42 3.62
Table 2 does not show a statistically significant difference between the pre-test scores of the control and experimental groups (p > 0.05). Therefore, the readiness levels of the two groups in terms of the Electronic Spreadsheet Programs topic can be considered equal.
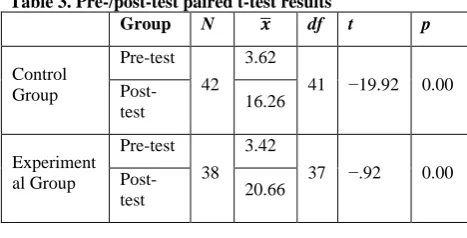
[image:4.595.311.549.89.147.2]A paired t-test was performed to determine if the difference between the groups’ pre- and post-test scores was statistically significant after intervention. The results of the t-test are shown in Table 3.
Table 3. Pre-/post-test paired t-test results
Group N 𝒙 df t p
Control Group
Pre-test 42
3.62
41 −19.92 0.00
Post-test 16.26
Experiment al Group
Pre-test
38 3.42
37 −.92 0.00
Post-test 20.66
Table 3 shows a significant difference between the mean pre- and post-test scores of both groups after intervention (p < 0.05). In other words, the achievement level of both groups was higher after instruction.
The results of the independent samples t-test of both groups’ post-test scores are given in Table 4.
Table 4. Results of t-test relative to post-test scores
Group N 𝒙 df t p
Post-test
Experimental 38 20.66 37
5.83 0.00 Control 42 16.26 41
Table 4 shows a statistically significant difference between the post-test scores of the control and experimental groups after intervention. (p < 0.05). In other words, the post-test scores of the experimental group are higher than the post-test scores of the control group. Therefore, it can be concluded that the students that used the ITS were more successful.
[image:4.595.311.545.264.383.2]The mean post-test scores of students sorted by pre-test scores are given in Table 5.
Table 5. Average post-test scores sorted by pre-test scores Group N Mean Corrected Mean
Experimental 38 20.66 20.685
Control 42 16.26 16.238
Table 5 shows that the corrected mean value of the post-test scores was 20.685 and 16.238 for the experimental and control groups, respectively.
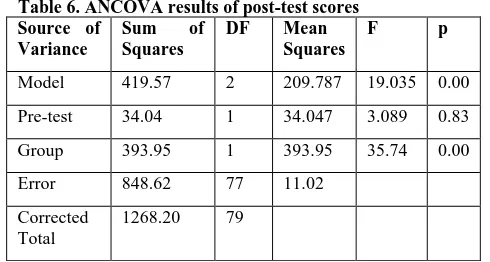
[image:4.595.320.536.632.691.2]Table 6. ANCOVA results of post-test scores Source of
Variance
Sum of Squares
DF Mean Squares
F p
Model 419.57 2 209.787 19.035 0.00
Pre-test 34.04 1 34.047 3.089 0.83
Group 393.95 1 393.95 35.74 0.00
Error 848.62 77 11.02
Corrected Total
1268.20 79
The relationship between the experimental and control groups’ post-test scores sorted by pre-test scores was explored by performing an ANCOVA test. A statistically significant relationship was found between the means of the sorted post-test scores of the experimental and control groups (F(1-77) = 35.746, p < 0.05). In other words, the students who used the ITS were more successful than those instructed in a face-to-face context; thus, the instructional method used in the experimental condition was more effective than that employed in the control condition.
The students’ mean retention test scores sorted by post-test scores are shown in Table 7.
Table 7. Mean retention test scores sorted by post-test scores
Group N Mean Corrected Mean
Experimental 38 17.08 15.68
Control 42 14.17 15.43
As seen in Table 7, the corrected mean of the retention test scores of the experimental and control groups was 15.680 and 15.433, respectively.
The results of the ANCOVA test, which employed the retention test scores sorted by post-test scores, for both groups are presented in Table 8.
Table 8. ANCOVA results of retention test scores Source of
Variance
Sum of Squares DF
Mean
Squares F p
Model 493.70 2 246.80 20.74 0.00
Post-test 324.50 1 324.50 27.27 0.00
Group 0.84 1 0.84 0.71 0.79
Error 916.09 77 11.89
Corrected Model
1409.80 79
Table 8 shows that the difference between the retention test scores of the two groups sorted by post-test scores was not statistically significant (F(1-77) = 0.71, p > 0.05). The two groups demonstrated equal retention scores, which reveals that intervention did not influence learning retention.
5.
SUGGESTIONS AND CONCLUSION
This experimental study investigated the effect of web-based ITS on academic achievement and retention. The sample in this study comprised 80 undergraduate students from various departments at the Kastamonu University Faculty of
Education. The topic of instruction was electronic spreadsheet software. An achievement test with 27 items was developed prior to intervention to measure the students’ achievement and retention levels.
Before intervention, it was confirmed that the readiness levels of the two groups were equal according to their pre-test scores. The four-week intervention revealed that the experimental group was more successful than the control group. This result aligns with previous research that found that an ITS is an effective tool to improve academic achievement [5, 27-32].
It can be argued that this success stems from the following features:
• The identification of learning gaps by the ITS for the experimental group;
• Providing intelligent help and support appropriate for these learning gaps;
• Providing intelligent help during student interactions with the practice questions in activity pages;
• Analyzing test questions to enable students to focus on mistakes;
• Opportunity to revise topics as many times as possible in a time and place independent manner;
• Individualized instruction;
• Guiding students to revise pages to a degree specified by their instructor.
One month after the post-test, the same achievement test was applied to evaluate the students’ retention levels. It was revealed that the web-based ITS did not have significant effect on retention. In another study, Erdemir and İngeç [28] conducted an experiment to investigate the effects of a Physics ITS they developed on undergraduate student academic achievement and retention. In their study, the experimental group used the ITS and the control group was instructed using traditional methods. They concluded that the ITS was effective for both achievement and retention, which aligns with this study in terms of academic achievement; however, it does not relative to retention. The reason for this difference may be that students had more opportunities to apply knowledge obtained from the Physics ITS, which contributed to their knowledge retention.
Christopher et al. [29] developed an ITS related to a genetics test about breast cancer risk. They concluded that the ITS increased the success of interpreting the test and that the ITS was a scalable and low-cost instructional tool. Note that, in our control group, students were instructed for 640 minutes on average, and the instruction duration was 600 minutes for the experimental group that used the ITS. This result does not agree with that of Christopher et al. [29] in terms of time cost.
In future, qualitative studies can be performed to identify the strengths and weaknesses of the system. To find out more about the effect of the system, it is also possible to conduct studies using various subjects and different student groups.
6.
ACKNOWLEDGEMENT
7.
REFERENCES
[1] Arıcı,N., Karacı, A. (2013). Türkçe Öğrenimi İçin Web Tabanlı Zeki Öğretim Sistemi (Türkzös) Ve Değerlendirmesi. Turkish Studies, 8(8), 65-87.
[2] Körez, A. (2009). Durum tabanlı öğrenci modeli ile zeki öğretim sistemi (ZÖS) tasarımı, Yayımlanmamış Yüksek Lisans Tezi, Marmara Üniversitesi, Fen Bilimleri Enstitüsü, İstanbul.
[3] Rishi, O. P., Govil, R., & Sinha, M. (2007). Distributed Case Based Reasoning for Intelligent Tutoring System : An Agent Based Student Modeling Paradigm. In Proceedings of World Academy of Science, Engineering and Technology (Vol. 23, pp. 273–276).
[4] Karacı, A., & Arıcı, N. (2014). Determining students’ level of page viewing in intelligent tutorial systems with artificial neural network. Neural Comput & Applic, 24, 675–684.
[5] Keleş, A., Ocak R., Keleş, A., Gülcü, A., (2009). “ZOSMAT: Web-based intelligent tutoring system for teaching-learning process”, Expert Systems with Applications, 36 (2): 1229-1239. doi: 10.1016/j.eswa.2007.11.064.
[6] Elbeh, H. M. A. (2012). A personalized emotional intelligent tutoring system based on AI planning, Unpublished Doctora’s Thesis, Ulm University, Artificial Intelligence Institute, Ulm.
[7] Doğan, B. (2006). Zeki öğretim sistemlerinde veri madenciliği kullanılması, Yayımlanmamış Doktora Tezi, Marmara Üniversitesi, Fen Bilimleri Enstitüsü, İstanbul.
[8] Graesser, A. C., Conley, M. W., & Olney, A. M. (2012). Intelligent tutoring systems. In S. Graham, & K. Harris (Eds.), APA Educational Psychology Handbook: Vol. 3. Applications to Learning and Teaching (pp. 451-473). Washington, DC: American Psychological Association.
[9] Brusilovsky, P. (2001). Adaptive hypermedia. User Modeling and User-Adapted Interaction, 11, 87–110. doi:10.1023/A:1011143116306
[10]Korhan, G., Polat, R., Kurt, M. (2003). Analyzing Learning Concepts in Intelligent Tutoring Systems, The International Arab Journal of Information Technology, 13(2), 281-286, 2016.
[11]Weber, G., & Brusilovsky, P. (2001). ELM-ART : An Adaptive Versatile System for Web-based Instruction. International Journal of Artificial Intelligence in Education, 12, 351–384. doi:10.1.1.66.6245.
[12]Mitrovic, A. (2002). NORMIT: a Web-enabled tutor for database normalization. International Conference on Computers in Education, 2002. Proceedings. doi:10.1109/CIE.2002.1186210
[13]Mitrovic, A. (2003). An Intelligent SQL Tutor on the Web. International Journal of Artificial Intelligence in Education, 13, 173–197.
[14]Butz, C. J., Hua, S., & Maguire, R. B. (2004). A Web-based intelligent tutoring system for computer programming. In Proceedings - IEEE/WIC/ACM International Conference on Web Intelligence, WI 2004 (pp. 159–165). doi:10.1109/WI.2004.10104
[15]Naser, S. S. A. (2008). Developing an intelligent tutoring system for students learning to program in C++. Information Technology Journal, 7, 1055–1060. doi:10.3923/itj.2008.1055.1060
[16]Abu-Naser, S., Ahmed, A., Al-Masri, N., Deeb, A., Moshtaha, E., & Abu Lamdy, M. (2011). An Intelligent Tutoring System for Learning Java Objects. International Journal of Artificial Intelligence & Applications, 2(2), 68-77. doi:10.5121/ijaia.2011.2205
[17]Virvou, M., & Moundridou, M. (2000). A web-based authoring tool for algebra-related intelligent tutoring systems. Educational Technology and Society, 3, 61–70.
[18]Günel, K., & Aşliyan, R. (2009). Determining difficulty of questions in intelligent tutoring systems. Turkish Online Journal of Educational Technology, 8, 14–21.
[19]Ben Ammar, M., Neji, M., Alimi, A. M., & Gouardères, G. (2010). The Affective Tutoring System. Expert Systems with Applications, 37, 3013–3023. doi:10.1016/j.eswa.2009.09.031
[20]Geng, X., Zhang, Z., Jiang, Y., & Yang, Y. (2010). An intelligent tutoring architecture for scenario-based flight training. In 2nd International Workshop on Education Technology and Computer Science, ETCS 2010 (Vol. 2, pp. 291–294). doi:10.1109/ETCS.2010.172
[21]Özek, M. B., Akpolat, Z. H., Orhan A. (2010). Web tabanlı akıllı öğretim sistemlerinde tip-2 bulanık mantık kullanarak öğrenci öğrenme stili modelleme. Fırat Üniv. Mühendislik Bilimleri Dergisi, 22 (1), 37-44.
[22]Cabada, R. Z., Barrón Estrada, M. L., & Reyes García, C. A. (2011). EDUCA: A web 2.0 authoring tool for developing adaptive and intelligent tutoring systems using a Kohonen network. Expert Systems with
Applications, 38, 9522–9529.
doi:10.1016/j.eswa.2011.01.145
[23]Mitrovic, A., Mayo, M., Suraweera, P., & Martin, B. (2001). Constraint-based tutors: a success story. Engineering of Intelligent Systems. doi:10.1007/3-540-45517-5_103
[24]Webb, N.L. (1997). Determining Alignment of Expectations and Assessments in Mathematics and Science Education. NISE Brief 1(2). Madison, WI: University of Wisconsin-Madison, National Institute for Science Education. Retrieved from http://facstaff.wceruw.org/normw/WEBBMonograph6cri teria.pdf on July, 20, 2017
[25]Turgut, M.F. (1992). Eğitimde Ölçme ve Değerlendirme. Ankara: Saydam Matbaacılık.
[26]Tekin, H. (2000). Eğitimde Ölçme ve Değerlendirme. Ankara: Yargı Yayınları.
[27]Hsieh, S-J., Hsieh, P. Y., “Intelligent tutoring system authoring tool for manufacturing engineering education”, Int. J. Engng Ed., 17 (6): 569-579 (2001).
[28]Erdemir, M., Ingeç, K.Ş. (2015). The Influence of Web-based Intelligent Tutoring Systems on Academic Achievement and Permanence of Acquired Knowledge in Physics Education, US-China Education Review A, 5(1), 15-25.
Priscila G. Brust-Renck, Audrey M. Weil. (2015). Efficacy of a Web-Based Intelligent Tutoring System for Communicating Genetic Risk of Breast Cancer: A Fuzzy-Trace Theory Approach, Medical Decision Making, 35(1), 46-59.
[30]Hooshyar, D., Ahmad, R.B., Yousefi, M., Yusop, F.D., Horng, S.-J. (2015). A flowchart-based intelligent tutoring system for improving problem-solving skills of
novice programmers, Journal of Computer Assisted Learning, 31(4). 345–361
[31]Fossati, D., Eugenio, B. D., Ohlsson, S., Brown, C., Chen, L. (2015). Data driven automatic feedback generation in the iList intelligent tutoring system, Tech., Inst., Cognition and Learning, 10, 5–26.