DCT versus DWT Chaotic based Color Image Encryption
M. A. Mohamed
The Dean of the Faculty ofEngineering Mansoura, Egypt
M. I. Fath Allah
Assistant Professor Delta Higher Institute for Engineering &TechnologyMansoura, Egypt
L. W. Elbon
EngineerCommunication Labs of the Faculty of Engineering
Mansoura, Egypt
ABSTRACT
Over the years, large amount of transferred information has been attacked by hackers; so it has been considerable to make all effort for securing data and encrypting the information. Color images represent a very vital and important type of multimedia; so many encryption techniques have been proposed to protect the color image against different types of attacks. In this paper two proposed techniques will be introduced which have had high robustness against complex composite form of attacks. Discrete Wavelet Transform (DWT) has been applied for image transformation in one method and Discrete Cosine Transform (DCT) has been applied in the other one. Six various chaotic maps have been used with different parameters to introduce the needed encryption keys for the proposed approaches. After many extensive comparisons with other traditional techniques it has been found that the proposed algorithms have given better performance against both friendly and hard forms of complex composite attacks.
General Terms
Encryption, Encryption, Steganography, Discrete Cosine Transform (DCT), Discrete Wavelet Transform (DWT), Inverse Discrete Cosine Transform (IDCT), Inverse Discrete Wavelet Transform (IDWT), Data Encryption Standard(DES), Data Encryption Standard(TRIPLE DES), Advanced Encryption Standard(AES).
Keywords
Discrete Cosine Transform (DCT), Discrete Wavelet Transform (DWT), Inverse Discrete Cosine Transform (IDCT), Inverse Discrete Wavelet Transform (IDWT), Data Encryption Standard(DES), Data Encryption Standard(TRIPLE DES), Advanced Encryption Standard(AES).
1.
INTRODUCTION
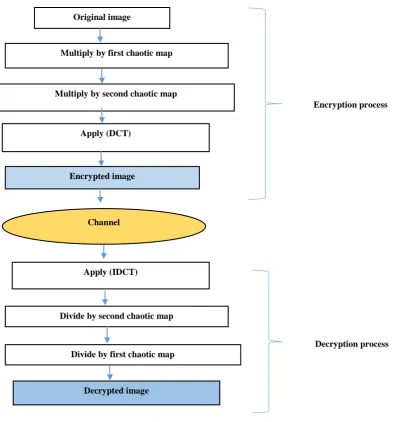
Nowadays, technological advances towards communication have highlighted the importance of security applications. Various approaches to ensure the security measures for information exchange has been studied intensively [1]. Encryption techniques have appeared as effective practical tools in validating and securing information. In this paper two encryption techniques will be provided in which the original color image has been multiplied by two chaotic maps of the same type and with different parameters and initial conditions. After that, DWT or DCT has been applied to get the encrypted image. Six chaotic maps have been used as encryption keys; (i) Chirikov, (ii) Chirikovtan, (iii) Ikeda, (iv) Henon, (v) Quadratic ,and (vi) Logistic map. The performance of the proposed schemes has been studied compared to some traditional ones against different kinds of attacks. The main challenge was to get high robustness against composite
attacks, in which three various types of attacks have been merged; noise, rotation and cropping attacks. This composite form of attacks could be imposed to the encrypted image (friendly form) or to the original one (hard form). Eight performance metrics have been used for measuring the performance against these forms of attacks. The next of this paper is organized as follows; section-2 presents survey and related work, section-3 introduces the proposed techniques, section-4 illustrates the simulation results and discussions, and section-5 demonstrates the conclusions.
2.
SURVEY AND RELATED WORK
In 2009 Battisti et al. proposed a new joint watermarking and encryption technique for color images which exploited the Fibonacci-har wavelet transform domain to increase its security [2]. In 2011 Zhang et al. introduced an encryption algorithm of embedding the color image watermark information into the color image in the DCT domain [3]. In 2012 Monika Agrawal et al. gave a detailed study of the popular symmetric key encryption algorithms such as DES, TRIPLE DES, AES, and Blowfish [4]. In 2012 Liu, et al. observed an image encryption method based on chaos logistic map and fractional Fourier transform [5]. In 2012 Wu, et al. has used the two-dimensional logistic map with complicated basin structures and attractors for image encryption [6]. In 2013 Jawad and Sulong reviewed a wide range of image encryption algorithms and classified them on the basis of full and partial image encryption schemes under spatial domain, frequency domain and hybrid domain categories [7].In 2014 Mohamed, M. A., Samarah, A. S., & Allah, M. F. concentrated on study of different optical encryption techniques and produced the main ideas of some optical encryption techniques [8]. In 2015 Benrhouma et al. presented a commutative encryption and blind watermarking scheme for digital gray scale images [9]. In 2017 Ramadan, Noha, et al. introduced a new and efficient image encryption scheme based on a combination of two chaotic encryption maps [10]. In 2018 Loan, Nazir A., et al proposed a secure and blind watermarking scheme in the DCT domain [11]. In 2018 Shaheen, Ahmad M., et al. proposed a digital image encryption technique for wireless sensor network using image transformations methods: DCT and DWT [12].
3.
PROPOSED TECHNIQUE
inverse of encryption process steps as obtained in Fig.1 and Fig.2. First the Inverse Discrete Wavelet Transform (IDWT) or Inverse Discrete Cosine Transform (IDCT) has been applied to the encrypted image, and then it has been divided by the second random key followed by dividing by the first one to get the decrypted image. The main equations of the chaotic maps used will be presented in the following subsection [14].
3.1
Chaotic Maps
3.1.1
Chirikov Map
It is a 2D map and represented by the following equations; [15]
(1.a) (1.b)
Where, K represents the external control parameter.
3.1.2
Chirikovtan Map
It is a 2D map and represented by the following equations; [15]
(2.a) (2.b)
Where, K represents the external control parameter.
3.1.3
Henon Map
This can be considered as a 2D extension of the logistic map and represented by the following equations; [15]
(3.a)
(3.b)
Where, a and b represent external control parameters.
3.1.4
Ikeda Map
Ikeda map is a 2D chaotic map and represented by the following equations; [15]
(4.a)
(4.b)
Where, m is the external parameter.
3.1.5
Logistic Map
This is a one-dimensional quadratic map defined by the following equation [6, 1]
(5)
Where, K represents the external control parameter.
3.1.6
Quadratic Map
This map is one dimensional and represented by the following equation; [15]
(6)
Where, C is the external parameter.
4.
RESULTS AND DISCUSSION
This section will illustrate the image database, the performance metrics, the simulation results and discussions of the proposed algorithms against friendly as well as hard composite attacks compared to some traditional techniques.
Original Image
Multiply by first chaotic map
Multiply by second chaotic map
Apply (DWT)
Encrypted image
Channel
Apply (IDWT)
Divide by second chaotic map
Divide by first chaotic map
Decrypted image
Encryption process
Decryption process
4.1
Image Data Base
Table 1 observes the name, type, extension, size, and entropy of each plain color image.
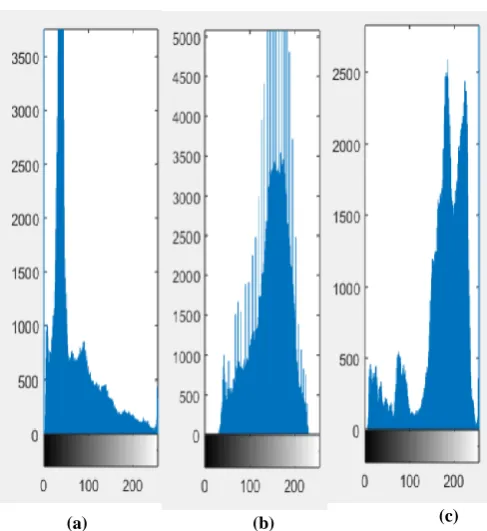
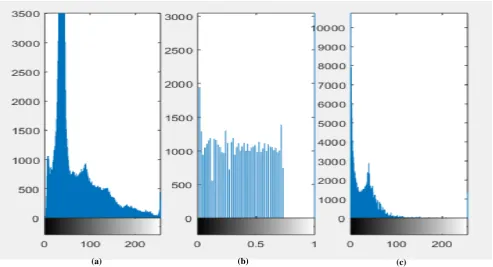
The original images and their histograms are observed in the figures (3, 4).
Fig. 3 Original Images; (a) Original Image (1), (b) Original Image (2), and (c) Original Image (3)
(a) (b) (c)
Original image
Multiply by first chaotic map
Multiply by second chaotic map
Apply (DCT)
Encrypted image
Channel
Apply (IDCT)
Divide by second chaotic map
Divide by first chaotic map
Decrypted image
Encryption process
[image:3.595.57.475.65.488.2]Decryption process
Fig. 4 Image Histogram for; (a) Original Image (1), (b) Original Image (2), and (c) Original Image (3)
4.2
Performance Metrics
In this paper, eight performance metrics have been used to measure the performance of the proposed technique and to compare it with that of some traditional ones; entropy analysis, Peak Signal-to-Noise Ratio (PSNR), Mean Square Error (MSE), cross correlation coefficient between original and decrypted images (R), histogram analysis, elapsed time, Number of Pixels Change Rate (NPCR), and Unified Average Changing Intensity (UACI).[16]. Each of these metrics will be discussed individually in the following few subsections.
4.2.1
Entropy Analysis
The entropy could be defined as in Eq. (7):
(7)
Where, p (mi) is the probability of symbol mi, and N represents the number of bits for each symbol. [15]
4.2.2
Peak Signal-to-Noise Ratio (PSNR)
The Peak Signal-to-Noise Ratio is used to measure the degradation between the plain and decrypted images. It can be computed as in Eq. (8):
(8)
Where, represents the maximum possible pixel value of the original image [16].
4.2.3
Mean Square Error (MSE)
The Mean Square Error between the original and decrypted images could be computed as in Eq. (9):
(9)
Where, M is the number of rows, N is the number of columns, f is the number of image frames, OI is the original image, and DI is the decrypted image. [16]
4.2.4
Cross correlation coefficient (R)
The cross correlation between the original and decrypted images can be defined as in Eq. (10):
(10) Where, m is the row number, n is the column number, OI is the mean value of the pixels of original image, and DI is the mean value of the pixels of decrypted image. [16]
4.2.5
Histogram Analysis
The histogram analysis shows the distribution of the pixel values in encrypted and decrypted images. To obtain an effective encryption technique, the histogram of the decrypted image must be close to that of the original one. The main equation of the histogram of an image is obtained in Eq. (11)
(11)
Where (f) is a given image represented as a matrix of size r by c of integer pixel intensities ranging from 0 to L − 1. L is the number of possible intensity values, usually 256, and pn denote the normalized histogram of image f. [16]
4.2.6
Elapsed Time
Elapsed time can be defined as the total calculation time for encryption as well as decryption processes in second for all experiments. [11].
4.2.7
Number of Pixels Change Rate (NPCR)
Table 1. Plain Color Images Database
Image Name Type Extension Size Entropy
1 Peppers True
color .png 384 512 7.0237
2 Pears True
color .png 486 732 7.2089
3 Colored chips
True
color .png 391 518 7.2985
NPCR measures the percentage of different pixel numbers between the two images and is defined as
(12)
Where, M is the number of rows, N is the number of columns, f is the number of image frames. [17]
The practical value for 1-NPCR should be about 0.99
4.2.8
Unified Average Changing Intensity (UACI)
UACI measures the average intensity of differences between the two images and is defined as
(13)
Where, M is the number of rows, N is the number of columns, f is the number of image frames. [17]
The practical value for UACI should be about 0.33.
4.3
Simulation Results and Discussions
The proposed encryption techniques have been simulated using MATLAB-2015 on a personal computer with the following specifications; (i) Intel corei5-8250U CPU @ 1.60GHz 1.08GHz; (ii) 8 GB RAM; (iii) SATA hard disk(b)
1TB. Besides all of the performance metrics stated above, the simulation results for original, encrypted, and decrypted images for each technique will be illustrated.In this section, the simulation results as well as performance metrics measurements will be depicted. The performance of each technique has been measured against friendly as well as hard composite attacks.
4.3.1
Friendly Attacks
In this subsection, the simulation results as well as the performance metrics measurements in case of friendly composite attacks will be discussed. Friendly composite attacks means that the composite form of attacks has been imposed to the encrypted image whose uniform histogram distribution.
The chaotic maps and their parameters have been as follows; (1) Chirikov map with K=0.9 for two random keys, (2) Chirikovtan map with K=0.9 for both random keys, (3) Hénon map with a=1.4 and b=0.3 for both random keys, (4) Ikeda map with m=0.9 for both random keys,(5)Logistic map with k=4 for both random keys, and (6) Quadratic map with c=1.95 for both random keys,
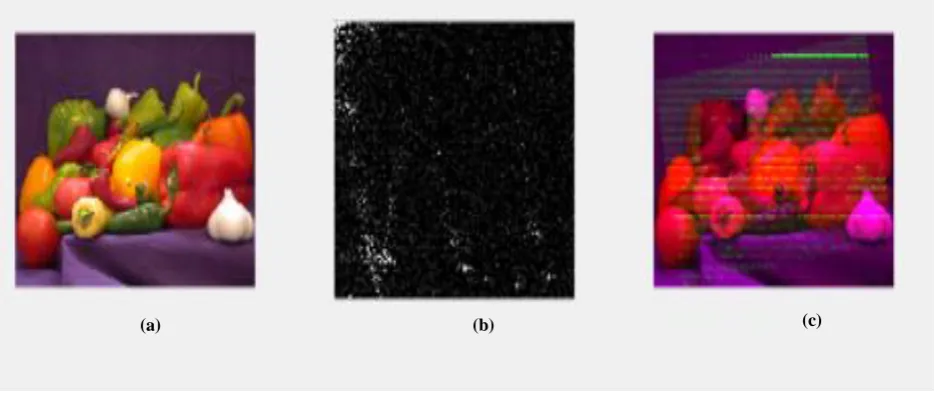
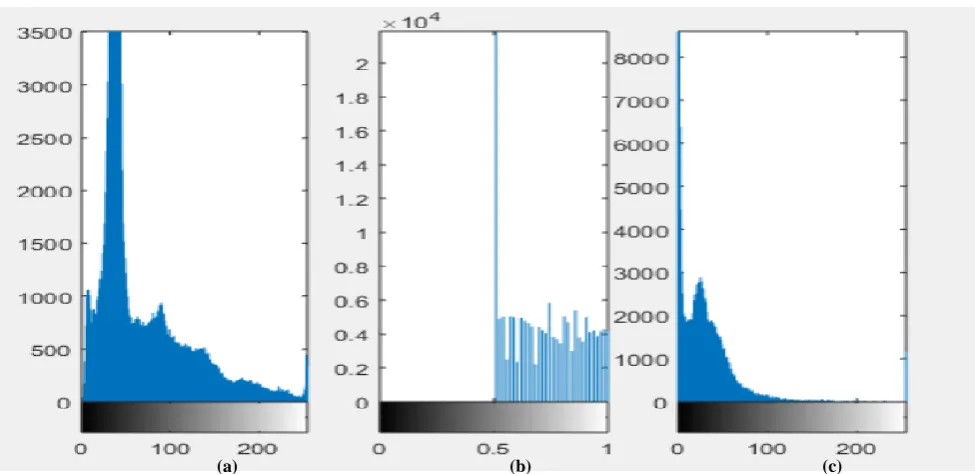
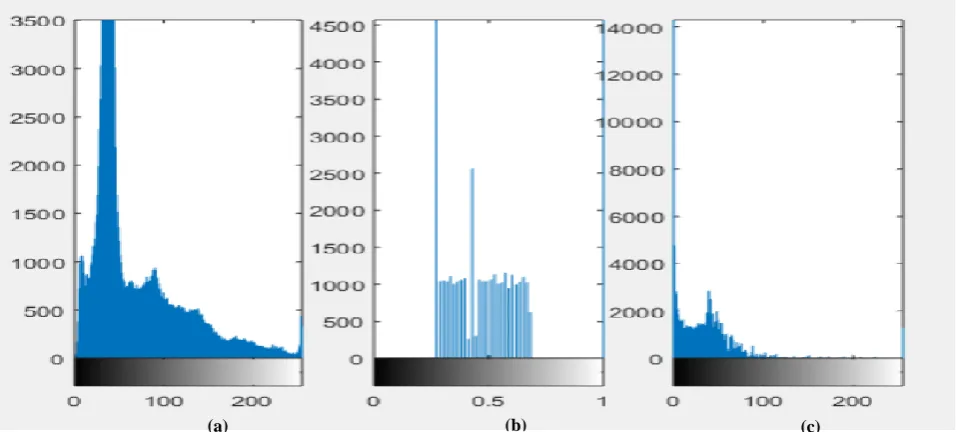
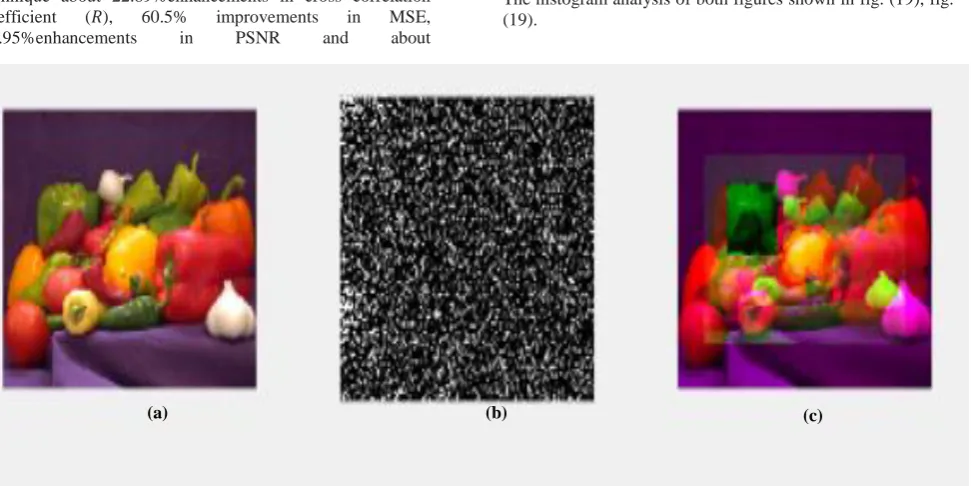
In Fig. (5) and Fig. (6), the first encrypted image, named "peppers", based on DCT in Fig. (5) And on DWT in Fig. (6) With chirikov map against friendly composite attack. The histogram analyses of both cases are shown in Fig. (7) and Fig. (8)Respectively. DCT gives more uniform histogram distribution for the encrypted image as demonstrated in Fig. (7(b)) compared to that of DWT as introduced in Fig. (8(b)). DCT based technique has given closer decrypted image histogram to that of the original one than that of DWT based one. More specific results are shown in table 2, which
indicates that DCT has a better performance metrics compared to DWT in case of friendly composite attacks.
To acquire more accurate and precise judgment when comparing DCT and DWT based techniques against composite attacks, the exact analysis using the same parameters employed for the first original image has been performed for 2 other color images. Finally, DCT based method has given superior results in MSE, elapsed time, PSNR, R, NPCR and UACI in case of using Chirikov chaotic map against friendly type of composite attacks with Gaussian noise.
As a general discussion, it is clearly found that the DCT as well as DWT based algorithms have achieved better performance than that of traditional one stated in another paper against severe composite attacks [14]. It has been found that there were significant enhancement ratios in most performance metrics values when using these techniques. DCT based approach without using filter has given about 6.34% enhancement in cross correlation coefficient(R), 681.7% improvement in MSE, 81.67% enhancement in PSNR, and about 42.87% improvement in UACI. On the other hand, DWT based technique has achieved about 87% enhancement in cross correlation coefficient (R), 46.94% improvement in MSE, 34.75% enhancement in PSNR, and about 211.47% improvement in UACI.
[image:5.595.66.535.423.621.2]After using median filter, these enhancement ratios have become in case of DCT based technique as follows; 21.6% in R, 67.59% in MSE, 78.2% in PSNR, and 44.61% in UACI, and in case of DWT based algorithm were about 87.74% in R, 44.68% in MSE, 31.74% in PSNR, and 228.9% in UACI.
Fig. 5: The Simulation Results for; (a) Original, (b) Encrypted, and (c) Decrypted Versions of Image (1) for DCT Based Technique with Chirikov Map against Friendly Composite Attack in Case of Gaussian Noise in first image
Fig. 6 : The Simulation Results for; (a) Original, (b) LL Component, (c) LH Component, (c) HL Component, (d) HH Component of Encrypted, and (d) Decrypted Versions of Image (1) for DWT Based Technique with Chirikov Map against
Friendly Composite Attack in Case of Gaussian Noise in first image
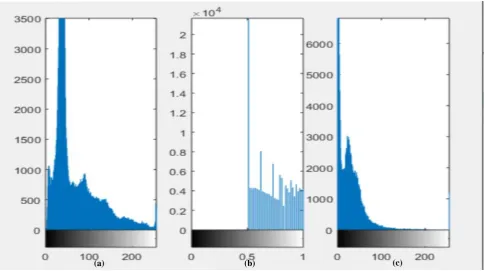
Fig. 7: The Histogram Analysis for; (a) Original, (b) Encrypted, and (c) Decrypted Versions of Image (1) for DCT Based Technique with Chirikov map against FriendlyComposite Attack in Case of Gaussian Noise in first image
(a) (b) (c)
(a) (b) (c)
[image:6.595.55.541.363.634.2]Fig. 8: The Histogram Analysis for; (a) Original, (b) Encrypted, and (c) Decrypted Versions of Image (1) for DWT technique with Chirikov map against Friendly Composite Attack in Case of Gaussian Noise in first image
Fig. 9: The Simulation Results for; (a) Original, (b) Encrypted, and (c) Decrypted Versions of Image (1) for DCT Based Technique with Chirikov Map against Friendly Composite Attack in Case of Salt & pepper noise in first image
(a)
(b) (c)
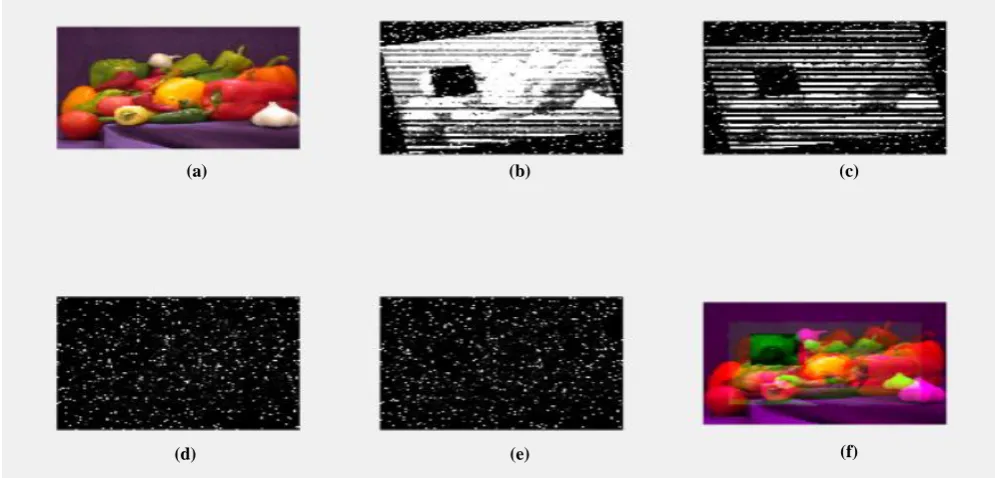
[image:7.595.55.550.377.661.2]Fig. 10: The Simulation Results for; (a) Original, (b) LL Component, (c) LH Component, (c) HL Component, (d) HH Component of Encrypted, and (d) Decrypted Versions of Image (1) for DWT Based Technique with Chirikov Map against
Friendly Composite Attack in Case of Salt & pepper noise in first image
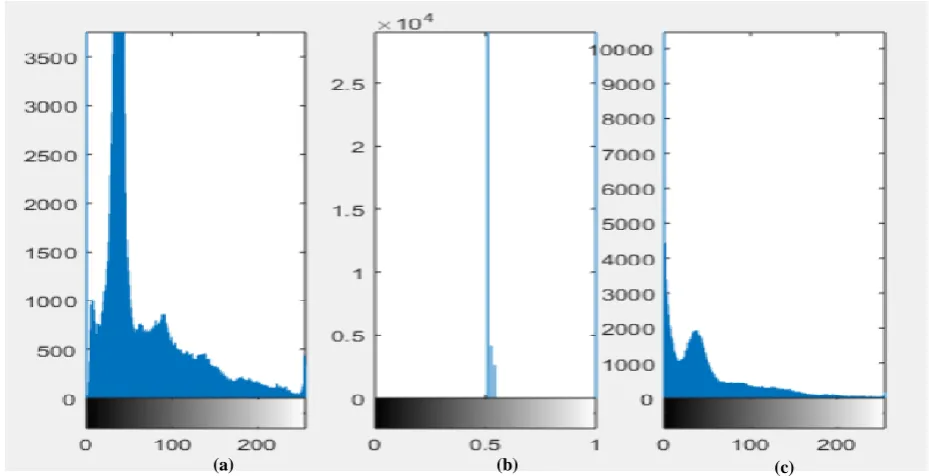
Fig. 11: The Histogram Analysis for; (a) Original, (b) Encrypted, and (c) Decrypted Versions of Image (1) for DCT Based Technique with Chirikov Map against Friendly Composite Attack in Case of Salt & pepper noise in first image
(a) (b) (c)
(a) (b) (c)
(f) (e)
[image:8.595.56.544.353.590.2]Figure 12: The Histogram Analysis for; (a) Original, (b) Encrypted, and (c) Decrypted Versions of Image (2) for DCT technique with Chirikov map against Salt & pepper noise in first image
While all these results have been demonstrated by Gaussian noise, the experiment also illustrated to include different and various type of noise such as; salt & pepper should give more insight into the final decision when comparing DCT and DWT employment in the composite attack encrypt.
Similar to the analysis done to the first image "Peppers", and for fair and accurate comparison, DCT and DWT methods are used on two other images named "pears" and "colored chips". This is done for the three different types of noise mentioned earlier, the concluded performance metrics is recorded and shown in tables in the end of the paper. As obvious, DCT has shown superior performance for different values of noise over the DWT usage. It is worth mentioning that, the best performance of either DCT or DWT is in the presence of Gaussian noise. Moreover, the DCT and DWT methods are applied to the image by using salt & pepper noise where Fig. (9) Have been shown the DCT and DWT is used in fig. (10).The histogram analysis of both figures is shown in fig. (11) and (12). While the first set of results for the "peppers" image were under the Chirkiov map with Gaussian noise, this shows the effect of the Chirkiov maps with "salt and pepper" noise. Still, the DCT gives better performance when used even under different noise conditions. More exact results are shown in tables.
From these measurements it has been found that the Chirikov
map has given the best performance against composite attacks. Our approach has obtained the minimum elapsed time which makes it suitable for real time practical applications, the closest entropy to that of original image listed in table 1, the least MSE, The largest PSNR, the maximum Cross correlation coefficient between original and decrypted images, and the least value for UACI. The value of NPCR is has been the same for all techniques 5.0863e-04 and 1-NPCR=0.9994 which achieved the practical value of it.
Also in case of salt & pepper it has been found that there were significant enhancement ratios in most performance metrics values when using these techniques. These ratios by comparing the DCT Technique without using filter were about 3.624% enhancements in cross correlation coefficient ( ), 68.23% improvements in MSE, 81.11%enhancements in PSNR and about 42%improvements in UACI and in case of DWT technique about 67.5%enhancements in cross correlation coefficient ( ), 67.3% improvements in MSE, 72%enhancements in PSNR and about 36.58%improvements in UACI .[14]
After using median filter, these enhancement ratios have become in case of DCT technique as follows: 19.3% in R, 67.3% in MSE, 77.64% in PSNR, and 43.8% in UACI but in case of DWT 89% in R, 48.62% in MSE, 30.35% in PSNR, and 236.9% in UACI [14].
Figure 13:The Simulation Results for; (a) Original, (b) Encrypted, and (c) Decrypted Versions of Image (2) for DCT technique with Henon map against Gaussian noise in first image
(a) (b) (c)
[image:9.595.72.523.607.736.2]4.3.2
Hard Attacks
Also this section will be illustrated the simulation results as well as the performance metrics measurements will be
[image:10.595.68.533.110.317.2]debated. Hard composite attacks means that the composite form of attacks has been dumped to the original image whose uniform histogram distribution.
Figure 15: The Histogram Analysis for; (a) Original, (b) Encrypted, and (c) Decrypted Versions of Image (2) for DCT technique with Henon map against Gaussian noise in first image
(a) (b) (c)
(a) (b) (c)
[image:10.595.64.529.393.631.2](d) (e) (f)
Figure 14:The Simulation Results for; (a) Original, (b) LL Component, (c) LH Component, (c) HL Component, (d) HH Component of Encrypted, and (d) Decrypted Versions of Image (2) for DWT technique with Quadratic map
Figure 16: The Histogram Analysis for; (a) Original, (b) Encrypted, and (c) Decrypted Versions of Image (2) for DWT technique with Quadratic map against Gaussian noise in first image
It has been found from Fig.(13) that the Henon map has given the best performance against composite attack in case of DCT technique and quadratic map has given the best results in case of DWT against Gaussian noise as Presented in fig.(14)The histogram analysis of both figures is shown in fig. (15), fig. (16)
Also in this case it has been found that there were significant enhancement ratios in most performance metrics values when using these techniques over reference [15]. These ratios by comparing the DCT Technique without using filter were about 116.76% enhancements in cross correlation coefficient ( ), 73.8% improvements in MSE, 94.76%enhancements in PSNR and about 63.89%improvements in UACI and in case of DWT technique about 22.89%enhancements in cross correlation coefficient ( ), 60.5% improvements in MSE,
50.95%enhancements in PSNR and about
81.4%improvements in UACI .[14]
After using median filter, these enhancement ratios have become in case of DCT technique as follows: 81.42% in R, 73% in MSE, 91% in PSNR, and 64.99% in UACI but in case of DWT 58.8% in R, 27.25% in MSE, 47.58% in PSNR, and 91.65% in UACI [14].
Moreover, the DCT and DWT methods are applied to the image by using salt & pepper noise, in case of DCT technique it has been applied by Chirikov map as it give the best performance compared to other six chaotic maps as shown in fig. (17) And in case of DWT technique it has been applied by Chirikov map as shown in fig. (18)
The histogram analysis of both figures shown in fig. (19), fig. (19).
Figure 17: The Histogram Analysis for; (a) Original, (b) Encrypted, and (c) Decrypted Versions of Image (2) for DCT technique with Chirikov map against Salt & pepper noise in first image
(a) (b) (c)
[image:11.595.64.550.474.717.2]Figure 19: The Histogram Analysis for; (a) Original, (b) Encrypted, and (c) Decrypted Versions of Image (2) for DCT technique with Chirikov map against Salt & pepper noise in first image
(a) (b) (c)
(a) (b) (c)
[image:12.595.56.555.383.688.2](d) (e) (f)
Figure 18: The Simulation Results for; (a) Original, (b) LL Component, (c) LH Component, (c) HL Component, (d) HH Component of Encrypted, and (d) Decrypted Versions of Image (2) ) for DWT technique with Chirikov map against Salt &
Figure 20: The Histogram Analysis for; (a) Original, (b) Encrypted, and (c) Decrypted Versions of Image (2) for DWT technique with Ikeda map against Salt & pepper noise in first image
Also in case of salt & pepper it has been found that there were significant enhancement ratios in most performance metrics values when using these techniques over reference [15]. These ratios by comparing the DCT Technique without using filter were about 117.34% enhancements in cross correlation coefficient ( ), 73.4% improvements in MSE,
93.72%enhancements in PSNR and about
62.76%improvements in UACI and in case of DWT technique about 22.64%enhancements in cross correlation coefficient ( ), 59.9% improvements in MSE, 50.15%enhancements in PSNR and about 87.37%improvements in UACI .[14]
After using median filter, these enhancement ratios have become in case of DCT technique as follows: 81.9% in R, 72.67% in MSE, 90% in PSNR, and 63.89% in UACI but in case of DWT 27% in R, 317.97% in MSE, 46.79% in PSNR, and 97.85% in UACI [14].
5.
CONCLUTION
Multimedia protection has become important and very effective for secure information transmission. Encryption technique has become to play a very vital rule in protection and secure the information. In this paper; the encryption algorithm is based on DCT in one method and DWT in other one. The random keys used in these techniques have been represented using six chaotic maps. The performance metrics of these algorithms have been studied. As a result of extensive comparative study it has been found that DCT based algorithms have given better performance than DWT based ones; (i) the minimum value for MSE, (ii) the maximum value for PSNR, (iii) the largest value of , (iv) the closest value of decrypted image entropy to those of the plain images, and (v) the minimum values for UACI. Finally, to acquire more accurate and precise judgement using the same parameters on two other original color images.
6.
REFERENCES
[1] MOHAMED, M., ABOU-ELSOUD, M. & EL-DIN, W. K. 2012. Hardware Implementation of Multimedia Encryption Techniques Using FPGA. International Journal of Computer Science Issues (IJCSI), 9, 290. [2] BATTISTI, F., CANCELLARO, M., BOATO, G.,
CARLI, M. & NERI, A. 2009. Joint watermarking and encryption of color images in the Fibonacci-Haar domain. EURASIP Journal on Advances in signal Processing, 2009, 938515.
[3] ZHANG, S., WANG, X. & ZHOU, S. The Research of Image Watermarking Encryption Algorithm. Computational Sciences and Optimization (CSO), 2011 Fourth International Joint Conference on, 2011. IEEE, 821-824.
[4] AGRAWAL, M. & MISHRA, P. 2012. A comparative survey on symmetric key encryption techniques. International Journal on Computer Science and Engineering, 4, 877.
[5] LIU, Y., LIN, J., FAN, J. & ZHOU, N. 2012. Image encryption based on cat map and fractional fourier transform. Journal of Computational Information Systems, 8, 7485-7492.
[6] WU, Y., NOONAN, J. P., YANG, G. & JIN, H. 2012. Image encryption using the two-dimensional logistic chaotic map. Journal of Electronic Imaging, 21, 013014. [7] JAWAD, L. M. & SULONG, G. B. 2013. A review of
color image encryption techniques. International Journal of Computer Science Issues (IJCSI), 10, 266.
[8] Mohamed, M. A., Samarah, A. S., & Allah, M. F. (2014). Optical encryption techniques: an overview. International Journal for Computer Science
Issues (IJCSI), 11(2), 125-129.
[9] BENRHOUMA, O., MANNAI, O. & HERMASSI, H. Digital images watermarking and partial encryption based on DWT transformation and chaotic maps. Systems, Signals & Devices (SSD), 2015 12th International Multi-Conference on, 2015. IEEE, 1-6. [10]MOYSIS, L. & AZAR, A. T. 2017. New discrete time 2d
chaotic maps. International Journal of System Dynamics Applications (IJSDA), 6, 77-104
[11]LOAN, Nazir A., et al. Secure and Robust Digital Image Watermarking Using Coefficient Differencing and Chaotic Encryption. IEEE Access, 2018, 6: 19876-19897.
[12]SHAHEEN, Ahmad M., et al. Digital image encryption techniques for wireless sensor networks using image transformation methods: DCT and DWT. Journal of Ambient Intelligence and Humanized Computing, 2018, 1-18.
[13]Kang, Xiao-bing, et al. "A novel hybrid of DCT and SVD in DWT domain for robust and invisible blind image watermarking with optimal embedding strength." Multimedia Tools and Applications77.11
(2018): 13197-13224.
[14] MOHAMED, M. A.; SAMRAH, Ahmed Shaaban; FATH ALLAH, Mohamed Ismail. DWT versus WP Based Optical Color Image Encryption Robust to Composite Attacks. Advances in OptoElectronics, 2017, 2017.
[15] MISHRA, M., SINGH, P. & GARG, C. 2014. A New algorithm of encryption and decryption of images using chaotic mapping. International Journal of Information & Computation Technology. ISSN, 0974-2239
[16] FU, C., CHEN, J.-J., ZOU, H., MENG, W.-H., ZHAN, Y.-F. & YU, Y.-W. 2012. A chaos-based digital image encryption scheme with an improved diffusion strategy. Optics Express, 20, 2363-2378.
[17] MOHAMED, M. A., et al. Hybrid watermarking scheme for copyright protection using chaotic maps cryptography. International Journal of Computer Applications, 2015, 126.4.
[image:14.595.44.558.357.580.2][18] Gorji, M. R. B., Shirvani, M. H., & Mooziraji, F. R. (2015). A new image encryption method using chaotic map. Journal of Multidisciplinary Engineering Scienceand Technology (JMEST), 2(2).
Table 2.performance metrics in case DCT technique against Friendly Gaussian attack for image (1)
Metrics Chirikov Chirikovtan Henon Ikeda
Logistic Quadratic Refrence no.(14) without using filter Refrence no.(14) with using median filter Elapsed time
0.1993 0.2412 0.2029 0.1945 0.2784 0.2219 0.7704 0.7911
MSE 4.9858e+03 5.9206e+03 6.2695e+03 6.5290e+03 6.5796e+03 6.5796e+03 15819 15388
PSNR 11.1535 10.4071 10.1585 10.1585 9.9032 9.9488 6.1391 6.2590
R 0.1447 0.0713 0.1392 0.1382 0.0482 0.1196 0.1545 0.1846
NPCR 5.0863e-04 5.0863e-04 5.0863e-04 5.0863e-04 5.0863e-04 5.0863e-04 0.00074 0.00074
UACI 16.1221 20.957 23.5832 24.6248 19.8354 24.1143 28.221 29.1083
Entropy of original
image
7.0237 7.0237 7.0237 7.0237 7.0237 7.0237 7.2638 7.2331
Table 3. performance metrics in case DWT technique against Friendly Gaussian attack for image (1)
Metrics Chirikov Chirikovtan Henon Ikeda
Logistic Quadratic Refrence no.(14) without using filter Refrence no.(14) with using median filter Elapsed time
0.8500 0.3440 0.3309 0.3470 0.2938 0.3101 0.6259 0.6296
MSE 5.5680e+03 6.4874e+03 6.2872e+03 6.5382e+03 7.8959e+03 6.5768+03 10495 10066
PSNR 10.6738 10.0101 10.1462 9.9762 9.1568 9.9507 7.9209 8.1021
R 0.0564 -0.0407 0.0925 0.1119 0.0990 0.1079 0.4341 0.4601
[image:14.595.43.557.611.769.2]UACI 17.4673 21.8000 23.4128 24.5642 16.0536 24.0315 5.6079 5.3108 Entropy
of original
image
[image:15.595.35.564.168.380.2]7.0237 7.0237 7.0237 7.0237 7.0237 7.0237 5.9133 5.6448
Table 4. performance metrics in case DCT technique against Friendly Salt & pepper attack for image (1)
Metrics Chirikov Chirikovtan Henon Ikeda
Logistic Quadratic Refrence no.(14) without using filter
Refrence no.(14) with
using median
filter
Elapsed time
0.2832 0.2392 0.2735 0.2356 0.2793 0.2328 0.7704 0.7911
MSE 5.0258e+03 5.9488e+03 6.2634e+03 6.5267e+03 7.3485e+03 6.5773e+03 15819 15388
PSNR 11.1188 10.3865 10.1627 9.9839 9.4688 9.9503 6.1391 6.2590
R 0.1489 0.0730 0.1403 0.1383 0.0585 0.1196 0.1545 0.1846
NPCR 5.0863e-04 5.0863e-04 5.0863e-04 5.0863e-04 5.0863e-04 5.0863e-04 0.00074 0.00074
UACI 16.3549 21.0561 23.5637 24.6179 20.1300 24.1069 28.221 29.1083
Entropy of original
image
[image:15.595.25.573.411.610.2]7.0237 7.0237 7.0237 7.0237 7.0237 7.0237 7.2638 7.2331
Table 5. performance metrics in case DWT technique against Friendly Salt & pepper attack for image (1)
Metrics Chirikov Chirikovtan Henon Ikeda
Logistic Quadratic Refrence no.(14) without using filter
Refrence no.(14) with using median filter
Elapsed time
0.3285 0.3110 0.3029 0.3052 0.2761 0.3189 0.6259 0.6296
MSE 5.17134e+03 6.5918e+03 6.270e+03 6.5332e+03 7.8802e+03 6.5726e+03 10495 10066
PSNR 10.5618 9.9408 10.1519 9.9795 9.1654 9.9534 7.9209 8.1021
R 0.0501 -0.0475 0.0918 0.1121 0.1006 0.1081 0.4341 0.4601
NPCR 5.0863e-04 5.0863e-04 5.0863e-04 5.0863e-04 5.0863e-04 5.0863e-04 0.00074 0.00074
UACI 17.8973 22.1792 23.3656 24.5492 16.0898 24.0194 5.6079 5.3108
Entropy of original
image
[image:15.595.38.565.638.763.2]7.0237 7.0237 7.0237 7.0237 7.0237 7.0237 5.9133 5.6448
Table 6. performance metrics in case DCT technique against Friendly Speckle attack for image (1)
Metrics Chirikov Chirikovtan Henon Ikeda
Logistic Quadratic Refrence no.(14) without using filter
Refrence no.(14) with
using median
filter
Elapsed time
0.2657 0.6580 0.2695 0.2580 0.2429 0.2412 0.7704 0.7911
MSE 5.0954e+03 6.0033e+03 6.3019e+03 6.5483e+03 7.3426e+03 6.5925e+03 15819 15388
R 0.1441 0.0743 0.1387 0.1363 0.0596 0.1192 0.1545 0.1846 NPCR 5.0863e-04 5.0863e-04 5.0863e-04 5.0863e-04 5.0863e-04 5.0863e-04 0.00074 0.00074
UACI 16.9110 21.4198 23.7124 24.6792 20.3251 24.1535 28.221 29.1083
Entropy of original
image
[image:16.595.20.584.192.404.2]7.0237 7.0237 7.0237 7.0237 7.0237 7.0237 7.2638 7.2331
Table 7 performance metrics in case DWT technique against Friendly Speckle attack for image (1)
Metrics Chirikov Chirikovtan Henon Ikeda
Logistic Quadratic Refrence no.(14) without using filter
Refrence no.(14) with using
median filter
Elapsed time
0.3574 0.2701 0.3522 0.3120 0.2930 0.3049 0.6259 0.6296
MSE 5.747e+043 6.5952e+03 6.3071e+03 6.5553e+03 7.8616e+03 6.5878e+03 10495 10066
PSNR 10.5411 9.9385 10.1325 9.9649 9.1757 9.9437 7.9209 8.1021
R 0.0429 -0.0508 0.0940 0.1120 0.1007 0.1079 0.4341 0.4601
NPCR 5.0863e-04 5.0863e-04 5.0863e-04 5.0863e-04 5.0863e-04 5.0863e-04 0.00074 0.00074
UACI 18.2553 22.3527 23.5403 24.6183 16.2727 24.0672 5.6079 5.3108
Entropy of original
image
[image:16.595.34.565.432.644.2]7.0237 7.0237 7.0237 7.0237 7.0237 7.0237 5.9133 5.6448
Table 8. performance metrics in case DCT technique against Hard Gaussian attack for image (1)
Metrics Chirikov Chirikovtan Henon Ikeda
Logistic Quadratic Refrence no.(14) without using filter
Refrence no.(14) with
using median
filter
Elapsed time
0.3141 0.2958 0.3173 0.3342 0.3111 0.3327 0.7704 0.7911
MSE 4.1465e+03 4.1570e+03 4.1436e+03 4.1516e+03 4.1456e+03 4.1510e+03 15819 15388
PSNR 11.9540 11.9430 11.9571 11.9486 11.9550 11.9493 6.1391 6.2590
R 0.3347 0.3329 0.3349 0.3339 0.3341 0.3340 0.1545 0.1846
NPCR 5.0863e-04 5.0863e-04 5.0863e-04 5.0863e-04 5.0863e-04 5.0863e-04 0.00074 0.00074
UACI 10.1729 10.1823 10.1892 10.1798 10.1701 10.1589 28.221 29.1083
Entropy of original
image
[image:16.595.32.567.672.763.2]6.9219 6.9219 6.9219 6.9219 6.9219 6.9219 7.2638 7.2331
Table 9. performance metrics in case DWT technique against Hard Gaussian attack for image (1)
Metrics Chirikov Chirikovtan Henon Ikeda
Logistic Quadratic Refrence no.(14) without using filter
Refrence no.(14) with
using median
filter
Elapsed time
MSE 4.1541e+03 4.1467e+03 4.1489e+03 4.1466e+03 4.1495e+03 4.1436e+03 10495 10066
PSNR 11.9460 11.9537 11.9515 11.9538 11.9509 11.9571 7.9209 8.1021
R 0.3326 0.3347 0.3344 0.3346 0.3341 0.3347 0.4341 0.4601
NPCR 5.0863e-04 5.0863e-04 5.0863e-04 5.0863e-04 5.0863e-04 5.0863e-04 0.00074 0.00074
UACI 10.1606 10.1613 10.1527 10.1650 10.1648 10.1748 5.6079 5.3108
Entropy of original
image
[image:17.595.32.566.225.436.2]6.9219 6.9219 6.9219 6.9219 6.9219 6.9219 5.9133 5.6448
Table 10. performance metrics in case DCT technique against Hard salt & pepper attack for image (1)
Metrics Chirikov Chirikovtan Henon Ikeda
Logistic Quadratic Refrence no.(14) without using filter
Refrence no.(14) with
using median
filter
Elapsed time
0.2994 0.3069 0.4033 0.3149 0.3067 0.2967 0.7704 0.7911
MSE 4.2054e+03 4.2055e+03 4.2062e+03 4.2050e+03 4.2064e+03 4.2054e+03 15819 15388
PSNR 11.8927 11.8926 11.8919 11.8931 11.8917 11.8927 6.1391 6.2590
R 0.3358 0.3357 0.3355 0.3357 0.3356 0.3358 0.1545 0.1846
NPCR 5.0863e-04 5.0863e-04 5.0863e-04 5.0863e-04 5.0863e-04 5.0863e-04 0.00074 0.00074
UACI 10.5089 10.5104 10.5078 10.5119 10.5105 10.5052 28.221 29.1083
Entropy of original
image
[image:17.595.38.567.466.679.2]6.9219 6.9219 6.9219 6.9219 6.9219 6.9219 7.2638 7.2331
Table 11. performance metrics in case DWT technique against Hard salt & pepper attack for image (1)
Metrics Chirikov Chirikovtan Henon Ikeda
Logistic Quadratic Refrence no.(14) without using filter
Refrence no.(14) with
using median
filter
Elapsed time
0.5476 0.3124 0.3630 0.3653 0.3178 0.3148 0.6259 0.7911
MSE 4.2050e+03 4.2072e+03 4.2069e+03 4.2048e+03 4.2063e+03 4.2068e+03 10495 15388
PSNR 11.8932 11.8908 11.8912 11.8934 11.8918 11.8913 7.9209 6.2590
R 0.3357 0.3354 0.3355 0.3358 0.3356 0.3355 0.4341 0.1846
NPCR 5.0863e-04 5.0863e-04 5.0863e-04 5.0863e-04 5.0863e-04 5.0863e-04 0.00074 0.00074
UACI 10.5114 10.5116 10.5072 10.5121 10.5079 10.5099 5.6079 29.1083
Entropy of original
image
Table 12. performance metrics in case DCT technique against Hard Speckle attack for image (1)
Metrics Chirikov Chirikovtan Henon Ikeda
Logistic Quadratic Refrence no.(14) without using filter
Refrence no.(14) with using
median filter
Elapsed time
0.2662 0.2762 0.2803 0.2823 0.2960 0.2812 0.7704 0.7911
MSE 4.2233e+03 4.2152e+03 4.2121e+03 4.2141e+03 4.2171e+03 4.2070e+03 15819 15388
PSNR 11.8743 11.8826 11.8858 11.8837 11.8807 11.8911 6.1391 6.2590
R 0.3326 0.338 0.3334 0.3349 0.3337 0.3351 0.1545 0.1846
NPCR 5.0863e-04 5.0863e-04 5.0863e-04 5.0863e-04 5.0863e-04 5.0863e-04 0.00074 0.00074
UACI 10.6046 10.6249 10.6235 10.6057 10.6348 10.6167 28.221 29.1083
Entropy of original
image
6.9219 6.9219 6.9219 6.9219 6.9219 6.9219 7.2638 7.2331
Table 13. performance metrics in case DWT technique against Hard Speckle attack for image (1)
Metrics Chirikov Chirikovtan Henon Ikeda
Logistic Quadratic Refrence no.(14) without using
filter
Refrence no.(14) with using median
filter
Elapsed time
0.2662 0.2762 0.2803 0.2823 0.2960 0.2812 0.6259 0.7911
MSE 4.2233e+03 4.2152e+03 4.2121e+03 4.2141e+03 4.2171e+03 4.2070e+03 10495 15388
PSNR 11.8743 11.8826 11.8858 11.8837 11.8807 11.8911 7.9209 6.2590
R 0.3326 0.338 0.3334 0.3349 0.3337 0.3351 0.4341 0.1846
NPCR 5.0863e-04 5.0863e-04 5.0863e-04 5.0863e-04 5.0863e-04 5.0863e-04 0.00074 0.00074
UACI 10.6046 10.6249 10.6235 10.6057 10.6348 10.6167 5.6079 29.1083
Entropy of original
image
[image:18.595.18.583.327.530.2]