Short-range correlations seen in the nematic phase of bent-core liquid crystals by dielectric
and electro-optic studies
Yun Jang,1Vitaly P. Panov,1A. Kocot,1,2A. Lehmann,3C. Tschierske,3and J. K. Vij1,* 1Department of Electronic and Electrical Engineering, Trinity College Dublin, Dublin 2, Ireland
2Institute of Physics, Silesian University, Katowice, Poland
3Institute of Organic Chemistry, Martin Luther-University Halle-Wittenberg, D-06120 Halle/Saale, Germany
(Received 18 August 2011; published 19 December 2011)
Three bent-core nematic liquid crystals having the same core but with different terminal groups, short (C4) and long (C7,C9) tails, are investigated by dielectric and electro-optic contrast spectroscopic techniques. C4 shows sign reversal in the dielectric anisotropyas a function of both temperature and frequency, whereas C9 shows only negative in the entire mesophasic region. The behavior of C7 is intermediate of the two. Results of a dielectric study show that both C7 and C9 exhibit strong short-range polar correlations normal to the director. The correlation lengths of these interactions are found to be similar to those from the x-ray scattering. An increased hindered rotation for C9 compared to C4 moves the dielectric dispersion for to much lower frequencies, such that C9 shows only negativeover the entire temperature range.
DOI:10.1103/PhysRevE.84.060701 PACS number(s): 61.30.Eb, 42.70.Df, 77.22.Ch
The molecular structure of a liquid-crystalline compound has been found to have a significant influence on its properties and the phase behavior. The typical structure of a calamitic mesogen consists of a rigid core having a couple of phenyl rings and one or two flexible terminal chains. The anisotropic properties of the core moiety plays a key role in the formation of the orientational order of liquid-crystalline (LC) phases, while the terminal chains stabilize positional order, reduce the melting points and extend the phase ranges. The bent-core or banana-shaped mesogens give rise to special kind of nematic phases, in addition to the well-known B1 to B8 phases [1,2], and during the past few years the isotropic-to-nematic (I-N) transition temperature has been consistently lowered and the range of the nematic phase extended [3]. These materials in their nematic phase display unusual physical properties. Some of these are giant flexoelectricity [4], unprecedented electroconvection [5], and splitting in small-angle scattering patterns [6]. The splitting in small x-ray scattering has been interpreted either in terms of a presence of smectic-C (SmC)-like nanostructures [7–9] in the nematic phase or in terms of the form factor of the banana system [10,11]. A strong debate about the appropriateness of such an interpretation is continuing [12]. In this Rapid Communication, dielectric and electro-optic spectroscopic studies of the two represen-tatives of cyanoresorcinols, 4-cyanoresorcinols (C4 and C9), specifically are compared. The results of C7, whose behavior is in between the two, are also given [13]. Interestingly we find that C9 exhibits only negative dielectric anisotropy
whereas C4 shows a reversal in from positive to negative both with temperature and frequency. We later examine in detail the various causes for the observed sign reversal in given in the recent literature. In contrast, however, we find that the Maier-Meier model, which includes the anisotropic Kirkwood correlation factors [14], explains the observed behavior extremely well. The unusual dielectric behavior of C9 is interpreted in terms of the short-range
molecular associations along and normal to the director. These show that such an association exists in both C7 and C9, which is also supported by results from small-angle x-ray diffraction.
Derivatives of 4-cyanoresorcinol bisbenzoates shown in Fig. 1 are synthesized with different chain lengths in the terminal groups [14]. The dielectric spectra for different temperatures are recorded for both homeotropic and planar cells as a function of frequency using a Novocontrol dielec-tric spectrometer. Dielecdielec-tric and optical cells are prepared using low-resistance indium tin oxide (ITO) glass substrates (20/); these substrates are further coated with the align-ment layer depending on the type of alignalign-ment needed for the experiment. The data of and⊥ of the different resorcinols are recorded as a function of frequency and temperature, and these are shown for preselected frequencies of 1 and 100 kHz for C4 and C9 as a function of T∗ =TN-I/T in Fig.2.
The experimental data of complex permittivity ( and
both for homeotropic and planar cells) are analyzed in terms of the relaxation frequencyfR and the dielectric strengthδfor each mode. As an example, the results of C4 are presented in Fig.3, which will be discussed later. The static permittivities of C4 and C9 in a homeotropic cell close to zero frequency cannot be determined since the latter leads to colossaland
values arising from double-surface layers as a result of large dc conductivity arising mainly from ions. Due to this limitation of the dielectric technique at low frequencies, the electro-optic contrast spectroscopic [13], which is insensitive to the dc conductivity, is used (Fig. 4). Here the transmittance, color coded in arbitrary transmittance units, is plotted as a function of T∗. A line on the graph implies a contour of constant transmittance. The crowded lines imply a sharp change in the transmittance, i.e., the Freedericksz transition occurs at a frequency below for the sign reversal of such that the conditionEth=(π/d)
√
K11/0is satisfied. The crossover
FIG. 1. Chemical structure of 4-cyanoresorcinol bisbenzoates.
n=4, C4: I 107 N; n=7, C7: I 111 NcybC 41 CybC 25 SmC; n=9, C9: I 104 NcybC 58 CybC 50 SmC. NcybC is the nematic
phase composed of SmC-type cybotactic clusters and CybC is a mesophase composed of elongated cybotactic clusters. The transitions temperatures (T/◦C) are obtained during cooling [3].
The total permittivity of a cell configuration is the sum of∞ and the various relaxation strengths as given in Fig.3
for C4, as an example. The static permittivity values for C4, C7, and C9 thus calculated are given in Fig.5.and⊥are also calculated from the Maier-Meier (M-M) model by taking the total dipole moment and its transverse and longitudinal components, and the temperature dependence ofSdetermined from the birefringence measurements. The M-M expressions forand⊥are given as follows [14]:
−∞=N hF 2g
3okBT
μ2l(1+2S +μ2t(1−S), (1)
⊥−⊥∞=N hF 2g
⊥
3okBT
μ2l(1−S)+μ2t
1+1 2S
. (2)
Hereμlandμtare the longitudinal and the transverse compo-nents of the molecular dipole moment.N hF3 2g
okBT and
N hF2g
⊥
3okBT are
the multiplying factors for the permittivities.N is the number density,o is the permittivity of vacuum,kBT is the thermal energy, andFandhare the internal field factors for the reaction and the cavity fields.gandg⊥are the anisotropic Kirkwood correlation factors for the director parallel and perpendicular to the electric field, respectively. For each temperature, g
FIG. 2. (Color online) Real part of dielectric permittivity of 4 -resorcinols (C4 and C9) for frequencies of 1 and 100 kHz vsT∗.,
⊥are shown as blue triangles and red circles, respectively. T∗ = TN-I/T. The red dotted vertical line represents the isotropic to the
nematic transition temperature.
FIG. 3. (Color online) Relaxation frequency fij ≈(2π τij)−1,
and the dielectric strength (δj) obtained by fitting the
mea-sured permittivity data to the Havriliak-Negami equation, for planar (red triangles) and homeotropic cells (blue circles and squares) of C4. fij and δij denote the relaxation frequency
and the dielectric strength of the i,jth mode [16]. T∗= TN-I/T. The solid lines indicate a fit to the M-M model. The black
vertical dotted line indicates the isotropic-to-nematic transition.
and g⊥ are calculated using Eqs. (1) and (2) and by using the experimental values of and⊥and the scaling factors from C4. This equation was initially introduced to describe the static dielectric properties of sticklike anisotropic systems but, within the limitations of the experiment, it describes
FIG. 4. (Color online) Frequency-temperature plot of the trans-mittance for C4 in a planar cell of thickness 5μm andE=1.0 V/μm; the color (shade) of the contour represents the transmittance level in arbitrary units. The lines are contours of constant transmittance. The crowded lines imply a sharp change in the transmittance through the cell, that is, a Freedericksz transition occurs due to a sign reversal in
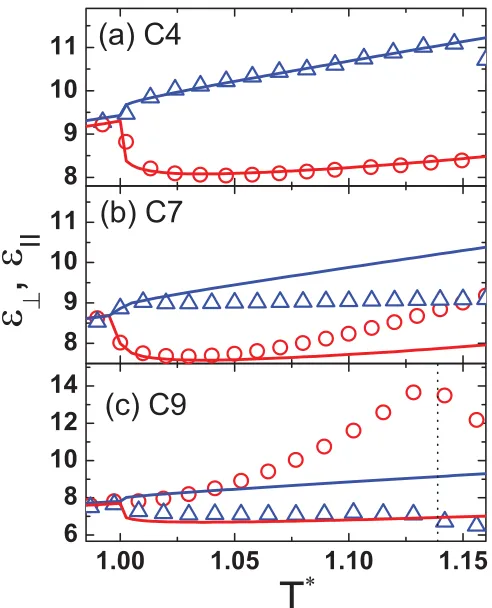
[image:2.608.49.295.72.133.2] [image:2.608.306.558.494.672.2] [image:2.608.48.293.497.691.2]FIG. 5. (Color online) Comparison of static and theoretical permittivities of C4 (a), C7 (b), and C9 (c) using the M-M model (solid lines). The blue triangles and red circles indicate
and ⊥, respectively. These are calculated by adding dielectric strengths for various processes to ∞. The blue (dark gray) and red (gray) lines denote calculated values of permittivity with
μ2
l/μ2=0.368 andμ2t/μ2=0.632, respectively. The vertical dotted
line in (c) denotes the transition from NcybC to CybC. We find
β=52.7◦.
such properties of bananalike systems fairly reasonably. The frequency dependencies of and ⊥ are determined by replacing the orientation parts due toμlandμt on the right-hand side of Eqs. (1) and (2) by the corresponding spectral densities of the relaxation functionsCmn=δmn/(1+ω2τmn2 ). Here δmn and τmn denote the relaxation strength and the relaxation time of the (mn)th mode, respectively. Analytical solutions have been found by Coffey and Kalmykov [16]. The dielectric relaxation strength for a mode will be a part of its scaling factor. A demonstration of the fitting to Eq. (1) is shown in Fig.3, from which the scaling factors forμlandμt are obtained. According to these equations, such a reversal in
can be interpreted as arising from the relaxations of the
and⊥ occurring at different frequencies.f00 is retarded while f11, f01, and f10 are accelerated due to the nematic
order.
A different reason for the sign reversal in a calamitic LC in its nematic phase with a nematic-to-SmAphase transition had been given earlier [17]. The nanosized clusters grow in the nematic phase prior to the transition to the smectic phase due to a pretransitional phenomenon. The small-angle x-ray scattering pattern in the nematic phase of bent-core
LCs has been interpreted in terms of such clusters [3]. This cause is ruled out since C4 does not exhibit any strong small-angle x-ray scattering. Another reason for the sign reversal in that has been advanced in the literature is that of a change in the dipole moment with temperature arising from a conformational change [18,19] caused by the flexibility in the core moiety. However, such a change accompanies a change in the bent angleθV and a change in the molecular dipole moment. Such a behavior is normally observed in liquid-crystalline dimers consisting of two rigid meosogenic groups linked by a flexible alkyl chain [20]. But a conformational change should also affect the birefringence, and this is not observed here. If the conformational change is the likely cause, then the angle that the dipole moment makes with the long molecular axisβ should change. Based on the ir absorbance measurements of the cyano group, we find that
β, the angle that the transition dipole moment makes with the symmetry axis, does not change with reduced temperature. Usuallyββ. If this is the case, then there is no significant change inθV and hence in the molecular dipole moment. Thus a conformational change is also ruled out for the sign inversion in.
We find that a sign reversal in in the nematic phase arises from the relaxation of the longitudinal component of the dipole moment at much lower frequencies than the transverse component. Furthermore, the dielectric strengths for are greater than for ⊥. This explains the observed behavior of the crossover temperature inas frequency dependent. The calculation of relaxation times in terms of the nematic potential andS by Saupe is extended by Coffey and Kalmykov [16], who find the exact solutions for the various relaxation times. Each of these permittivities thus shows at least two relaxation modes. The molecular dynamics can be described in terms of four rotational modesf00,f01,f10, andf11. Forinvestigated
using a homeotropic cell, the modes are (i) the end-over-end rotation f00 and (ii) the precessional motion of the long
molecular axis around the director of the phasef01. For ⊥
investigated using a planar cell, the modes are (iii) the rotation around its own long molecular axisf10and (iv) a combination
of precession around the director and the rotation around the long axisf11. The temperature dependence of the dielectric
relaxation strength for each component of the dipole moment is primarily determined by the dependence of the principal order parameterS on temperature. We find from Fig.5that results for C4 are well reproduced by the M-M model by assuming
g=g⊥=1. If this assumption is adopted, the results between the theory and experiment for C9 disagree. The only simple appropriate explanation for this disagreement is that bothg
[image:3.608.49.295.69.373.2]FIG. 6. (Color online) Cluster size L=V1/3 compared to the x-ray scattering results V1/3=(π/6L
L2⊥)1/3 (L and L⊥ from Ref. [3]) and the line representsn, the number of interacting molecules as a function of reduced temperature (T∗=TN-I/T).
written as
g =1−nμ
2cos2β3 rz
r
2
−1 4π or3kBT
, (3)
g⊥=1−nμ
2sin2β3 rx
r
2
−1 8π or3kBT
. (4)
n is the number of neighbors. For a smectic order, the average separation perpendicular to the layersrzin-plane separation, and this results ing<1. Ifrx2 <r2/3 , we get
g⊥ >1, indicating a parallel alignment of the polar axes. On using the experimental values of g⊥ and using Eq. (4), we calculate n for a smecticlike order. The average separation values perpendicular rz and parallel rx to the individual molecules are taken from the x-ray small-angle scattering and wide-angle peak positions [3], respectively. We note from Fig.6thatnis increasing almost exponentially withT∗.
The effective volume V of the correlated molecules is estimated by multiplyingnby the volume of a single molecule calculated from the molecular weight and density. The polar correlation lengthsl =V1/3for C7 and C9 are shown in Fig.6.
It is interesting to compare the above findings with results from structural analysis obtained by x-ray scattering [14]. Results agree for C7 and C9 close to theI-N transition temperature. However, the structural correlation length increases (seen for C9) more rapidly than the polar one. In the structural analysis so far, the splitting in small-angle x-ray diffraction patterns has not yet been considered. The interpretation, in terms of the tilt of the SmC-type nanoclusters, from a strong temperature dependence of splitting for both C7 and C9, is more reasonable than that based on the form factor. The association found from the dielectric results provides information about the polar interactions, whereas from x-ray scattering it depends on the size and nature of the cluster, and the results from the two are in broad agreement with each other.
We studied three bent-core liquid crystals (C4, C7, and C9) with the same mesogenic core but with different terminal groups. These show different dielectric and small-angle x-ray scattering results. C4 with short terminal groups shows a change in the sign in as a function of temperature and frequency in its nematic phase. C9 with long tails shows negative in the entire nematic range. The behavior of C7 is intermediate of the two. The temperature dependencies of permittivity are related to a change in the strong anisotropic correlations among the molecules. Interestingly, for C9, we find a large kink in the ⊥ and a small kink in at the
NcybC-CybC transition [Fig. 5(c)]. This shows that clusters in NcybC and CybC phases behave differently. In the CybC phase the macroscopic dipole of larger clusters tends to form a twisted structure to reduce the free energy, whereas in the
NcybC, dipoles of individual clusters are arranged randomly [21].
This work was funded by EU FP7BIND (216025) and SFI 06/RFP/ENE039. A.K. thanks the Polish Scientific Committee for Grant No. N202282734.
[1] H. Takezoe and Y. Takanishi, Jpn. J. Appl. Phys. 45, 597 (2006).
[2] R. A. Reddy and C. Tschierske,J. Mater. Chem.16, 907 (2006). [3] C. Keith, A. Lehmann, U. Baumeister, M. Prehm, and
C. Tschierske,Soft Matter6, 1704 (2010).
[4] J. Harden, B. Mbanga, N. Eber, K. Fodor-Csorba, S. Sprunt, J. T. Gleeson, and A. Jakli,Phys. Rev. Lett.97, 157802 (2006). [5] D. B. Wiant, J. T. Gleeson, N. Eber, K. Fodor-Csorba, A. Jakli,
and T. Toth-Katona,Phys. Rev. E72, 041712 (2005).
[6] B. R. Acharya, A. Primak, and S. Kumar,Phys. Rev. Lett.92, 145506 (2004).
[7] N. Vaupotic, J. Szydlowska, M. Salamonczyk, A. Kovarova, J. Svoboda, M. Osipov, D. Pociecha, and E. Gorecka,Phys. Rev. E80, 030701 (2009).
[8] O. Francescangeli and E. Samulski, Soft Matter 6, 2413 (2010).
[9] O. Francescangeli, F. Vita, C. Ferrero, T. Dingemans, and E. T. Samulski,Soft Matter7, 895 (2011).
[10] V. Prasad, S.-W. Kang, K. A. Suresh, L. Joshi, Q. Wang, and S. Kumar,J. Am. Chem. Soc.127, 17224 (2005).
[11] B. R. Acharya, S.-W. Kang, and S. Kumar,Liq. Cryst.35, 109 (2008).
[12] C. Tschierske and D. J. Photinos J. Mater. Chem. 20, 4263 (2010).
[13] Y. Jang, V. P. Panov, J. K. Vij, A. Lehmann, and C. Tschierske, Appl. Phys. Lett.97, 152903 (2010);A. Kocot, H. Xu, S. T. MacLughadha, and J. K. Vij,Mol. Cryst. Liq. Cryst.261, 501 (1995).
[14] H. Toriyama, S. Sugimari, K. Moriya, D. A. Dunmur, and R. Hanson,J. Phys. Chem.100, 307 (1996).
[image:4.608.50.292.69.253.2] [image:4.608.106.285.334.397.2][16] W. T. Coffey and Yu. P. Kalmykov,Adv. Chem. Phys.113, 487 (2000).
[17] W. H. de Jeu, W. J. A. Goossens, and P. Bordewijk,J. Chem. Phys.61, 1985 (1974).
[18] P. Salamon, N. Eber, A. Buka, J. T. Gleeson, S. Sprunt, and A. Jakli,Phys. Rev. E81, 031711 (2010).
[19] H. G. Yoon, S.-W. Kang, R. Y. Dong, A. Marini, K. A. Suresh, M. Srinivasarao, and S. Kumar,Phys. Rev. E81, 051706 (2010). [20] M. Stocchero, A. Ferrarini, G. J. Moro, D. A. Dunmur, and
G. R. Luckhurst,J. Chem. Phys. 121, 8079 (2004).

![FIG. 6. (Color online) Cluster size LRef. [as a function of reduced temperature (x-ray scattering results = V 1/3 compared to the V 1/3 = (π/6L∥L2⊥)1/3 (L∥ and L⊥ from3]) and the line represents n, the number of interacting moleculesT ∗ = TN-I/T ).](https://thumb-us.123doks.com/thumbv2/123dok_us/1547629.699722/4.608.106.285.334.397/cluster-function-temperature-scattering-compared-represents-interacting-moleculest.webp)
