ALUMINIUM ELECTRODE POTENTIAL
A thesis presented tor the degree ot Doctor Philosophy in Chemical Engineering
in University Canterbury Christchurch, New Zealand
by
w.
B. EARLI would like to express my thanks to Dr T. Hagyard, who supervised this work, for his time, assistance and enthusiasm over the last few years. A number of members of this department have helped in ma,ny ways and I am
most to them@
ABSTRACT i .. .. INTRODUCTION
1.1 General
1.2 Review of Previous Work in 1.3 Review of Current step Methods 2. ELECTRODE KlliETIC CONSIDERATIONS
2.1 The Peak Potential Problem EXPERIMENTAL
3.1 Voltage Measuring Equipment 3.2 Constant Current Control 3.3 Square Wave
3 .. 4 Electrodes
3 Electrolyte Solutions
4..
RESULTS AND DISCUSSIONFiald
4 .. 1 Square Wa .. ·s Polarisation Current Measurement
4 ..
2 Anodic Measurements Chloride Solutions 4.2.1 Square Wave Measurements4.2.2 Turret Method or Three-level Square Wave Measurements
4.2.3 Unpolarised Curve Analysis
4.3
Oathodio Square Wave Measurements in Chloride Solutions4 .. 4
Unpolarised Potential Trace Simulation4.5
Measurements in other Eleotrolytes4.5.1 Anodic Measurements in Sulphate and Chloride Solutions
Cathodio Measurements Sulphate Solution
4.5.3
Cathodio Measurements in pH 2.0 Solutions52
;" CONCWSIONS
54
6"
snmolS
577.
REFERENCES59
8. APPENDICES 61
8.1 Program I 61
8.2 Proof of No Overshoot 66
8.3
Program 8 ..4
ProgramABSTRACT
.
A wave current technique has been used to obtain the
08. thodic overvol tage parameters for hydrogen evolution on aluminium
but was found inadequate by i tae l.f for determining the anodio parameters i'or aluminium dissolution, mainly because of the
oomplioating effeots of solution IR drop. A method was developed, however, for the determination of and the ratio
eli
from theoa
analysis of the initial potential fall 20 during and just after cutting. By oombining the se re sul ts with the square wave results, IR drop and i were found and hence C could
oa obtained from
eli .
oa
It shown that the potential time behaviour in the first few milliseconds on freshly exposing an aluminiun, surface to aqueous sal t solutions cannot be explained simply in terms of the elec trode kinetio parameters applioable to the existing polyelectrode. The observations have been aocounted using polya leo trod.e
the ratio of cathodio to anodio area ohanges rapidly
eT.a. 0.2
ms) with time after an effective delay of approximate~1"
has been observed by at least ona author1 for many metals (Be, Mg, l i , Nb, Cr, and others) and by a number of authors2,3,4 for
tha t the electrode potentials of these metals in a number of solutions oan made 300-1000 mV more negative cleaning the
meaning in most oases merely the removal of" the
oxide Morize and Lacombe3 obtained a potential of 9v in 3/~ NaCl solution for an aluminium trode cleaned in an air- and
water-2
environmentg Some years later, one of the same
aU~10r35
obtained a potential of -1,,3'17 the same solut:.i.oll by presU!1:lably ta.king morEl care in oxygen recent workers, e .. gw Masing, and MOhling6 have obtained even moreHaCl in attempts
were made to arry present, the c trode 3 would.
certainly polyeleotrodes composed aluminium anodes polaY'ised by polarised hydrogen oathode3~ such oases the presenoe of oxide prevents investigation of" the processes ocourring on a clean aluminium electrode ..
1 .. 2
It would seem in fact that was not until the work of Hagyard and William:? that potentials of an aluminium electrode f"ree from oxide
films and oompeting reactions were obtained ve:t:y close to the t..'l-teoretioal reversible potential of aluminium.
'! '~ I
'0
Fig. 1. Potential versus time trace for an unpolarised
aluminium electrode. D, peak potential; E-F mixed potential.
o
zero volts on N.Calomel scale. 1 one Weston cell negative of O.wi th respect to the electrolyte was measured oscillographioally. It
was found that the peak potential (see Fig. 1 - Fig. 3 in ref. 7) was
affected by aluminium ion concentration but not pH and that the mixed
potential was affected by
PH
but not by aluminium ion concentration, thusshowing that the electrode was anodically active at the peak, and although
of neoes31 ty anodically as well as ca thodioally active at the mixed
Fotr:mtial, n,pparently cat.hodically oontrolled.
r~ter
work8 used theobservation above, that the peak potenttal behaved solely as an
alumInIum el~otrode to obtain anodic polarisation parameter.s i ano. a.
o
for aluminium dissolution. Further justification9 for this is disoussed
in a later seotion. It was believed at this stage that anodic param3ters
could be obtained in the very shor.t times, 20!l seo, required to reach
[image:7.595.120.420.111.357.2]to
be too slowto
affeot the anodio measurement made in these times. For the measurement hydrogen discharge parameters on aluminium another propsl"ty of the sys tern had to used because normally both prooesses would fully established by time. When an a1UIJinium eleotrode is polarised oathodica1ly to ~=--<=..--. ~--~ a potential muoh more negative tl1an the aluminium reversible potential in a solution, there can be no anodio dissolution of aluminium. Thus by polarising the newly-out surface with current densities high enough to produce potentials appreoiably more negative than the peak potential this oondition e.xisted, and the oathodic polarisation results 50 obtained -~+'", ... to an aluminiumsurface ~ none of which was anodio, i. e. to a surfaoe wholly oa thodio on whioh the feasib1a
ions~ Potassium
prohibited then it would
subs ineo1ub1a
discharge of hydrogen
in effeotively
because, firstly, if potassitllll were discharged aotivity as potassium
aluminium 10, and secondly, the· most eleotrode pot~ntial was 3till some O~5 more positive than the
expeo~ed reversible ~otent1a1 a potassium electrode in this solution~
By extrapolating the anodio and cathodio Tafel lines so obtained to the measured potential at zero external ourrent it was found that
mixed
Attempts have been made in this thesis to answer some of the questions this work, e.g .. what cause of the
relatively slow from peak to mixed potential? Does the electrode funotion start to from anodio to oathodio from the time of outting, only 1:#Q,''';U.I.,U5 the peak, quickly at peak, or slowly
during the deoay
A number of has been developed for the stu~ of fast
eleotrode oharge reactions, a major objeotive being the eliroin-ation of diffusion oontrolled effects&
A.C
e methods, used by Frumkin et alii extensively developed by n.ti.llJ.u.I.!:I 2,\r\:I
f'i-ri so h 13 er ~this the
oa,se of the
within a few remaining
decided to use a
for the present Vlorlc; step methods15 ,16 the newer method
ot' Faradaic reotifies, tion
17
were more di:f'fioul t experimentally did over a o~ent step the present time.Thus a ourrent step m~·r.I',,·\(t s, square wave
present
polarisation method used in work. T11is, as is shown in a seotion, enabled the rougnness of the cut surfaoe and its aotual area. to be eliminated as a the determination of
a,
theobtained wi thin a run .. roughness as outlined
Besides reduoing oonsiderably the effect of , the square wave teohnique could give twioe as muoh information from each run and it was hoped more insight into the basic kinetios of the eleotx'ode reactions.
1 .. .3
6
Current step methods for the eluoidation of electrode kinetics have . 1 8 19 20 21 22 1 8
been treated by a. number of authors ' , , , .. Sand and
Karaoglanoff19, however, did not take into aocount the oapaoitive portion of the ourrent used oharging or disoharging the eleotrical double layer, which is neoessar,y in many Casas and oertainly in this work. The general treatment of ~."..,.""""'''' step methods encounters serious rnathematical
diffioulties obtained a but
oomplex solution for the transfer ooeffioient, 0.,
0 .. 5 and no oonoentration ohanges ocour and Delahay2.3 have
publ~
a more traa tmant restrioted, however.to
s1.l1a.ll ampH tudes the responsetime equal for each r.l~t) aquare waves, W~jne~ Smit21 have presented a 'oyolic ourrant &step' method extending 1;;he of Berzins and
Delahay to t~e caSe of asymmetriQal square wave~, Atter their rigorous analysis it was ~nfortunate that they introduoe4 the "ellal restriotion
of
small values of o~ervoltage to enable themto
a solution to their equations, e.g. the error arising from this restriction 200% for an overvoltage of 100 mV, oa .. 1 ..8%
at 10 mVethe case of the present work it not possible to obtain
C!iiUSTCHURCH, N.Z.
2 ..
When a. oonstant ourrent density suddenly applied to an electrode it can be to divide into two components. The first,
used for the eleotrioal layer at the eleotrode solution interfaoe, second part, about transfer of charge aoross the double ei tOOl" as ions metal to solution or vice verBa, case of metal dissolution, or as ions from solution
-'
to the metal or eleotrons from the to the solUtion, the oase of gas
i
Consider oapaoitive oonstant .. then
In all cases we have:
=
io + i ta cathodio ooourring on the decreases with
by the
)
,
(13
The as i is
prooess
a
I.l:l double layer capacity (F/cm2)\II exohange ourrent for the ohat'ge (cathodic)
a
c~
cathodio electron transferooe;f~':l.oient,
0 (3 c<
1 n=
number of eleotrons transfe~red in the oathodic rateo ontrolling
oathodio overvoltage
=
V - E (volts)00
E '" l'':{'lorsible potential of the ela:otrode Were t" the same oc
·clcctrod(~ as V (volts)
Because E is cons ta.nt. then a linear relationship e:;ch.ts between
cc '
11 and V arl,:l therefore c
dV dt
If now an anodic prooess is also occurring on the electrode we have a polyeleotrode (generally 50 called; possibly better called a
di-electrode). Assuming that this reaction is also oharee transfer
controlled~ then its ourrent density is given by an expression analogous
i"e"
(e
oontr)lling prooela
the liu.'odic ovel'voltage ~ V ... E
013. )
We thulJ !kl,ve for a polc{.rised polyeleotrodo
(
1-i :::
ciY:
+ i (6-
edt 00
_ ~~11a (1-B ) zFYj a a
i (€I
:a:rr
m
+
-
e08.
i :::
- c"-
dV + i + i:fa dt :fo(5)
rate
)
)
10
aS3uming th.at whole of the electrode area is active
and each occUl'l"ing as if the other were this would loa ding. )
In field,
·of G.i;;;cra-re anodic and cathoaio areas on the was
introduced the This is
most concisely as the oathodic to anodic 'area ratio' and refer.red hereafter as area
Now, when the anodio and oathodio funotions are not ooncurrent on the same surface,
5
becomesi :::;
c
+ +1
=
cathodio proportiontotal r
Unfortunately,
6 and 7 are not known. at al 20 have solution to eqn 3 for the oaes
t3:::
0~5 and n :::; 1 ..2 2 (em /cm )
2 .2
(em /om )
ons
More I'€lcently, 3,
. 25·
Karasyl~, Law and Linford have extended to cases where n ~ 2 and
3.
For ono prooess alone (eqn 3) a solution oan be obtained anal~cically by ignol"ing the contributions of the reverse charge transfer process
This is a close approximation i f used at potentials sufficiently far from the reversible potential (as is done in section 4~2~3). For i,1'lO
processes (eqn 7) and/or in the region of a necessary to use numerical methods for solution. economioally; a 1620 computer program was w.r.'i tten method26 for integl'a ting the required equa tiona ..
potenUal 1 t is
detailed in Appendix 8 .. 1 and "'''''''"0 __ to hereafter as Program
I.
2,,1
It oan be proved (see Appendix 8 .. 2) that it is not p03sible to obtain a potential (overshoot in eleotronic terminology) in the
~olution eqns .3 and 7 for a step oOOnee in .,!.Vl."y...!.Uf'<, ourrent, i, if
the overvoltage par.ameters ( the area ratio,
r, are cons tant with time" It is possible to obtain overshoot i f the area alone ohanges with time and the rest of the parameters remain constant as shown below ..
r
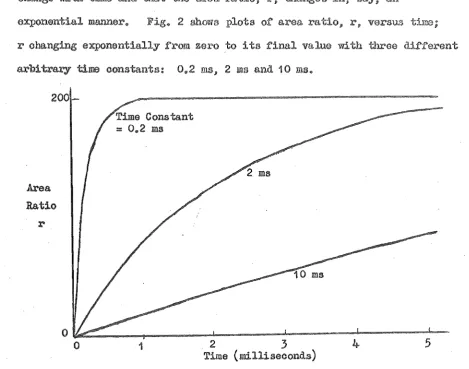
for a start that basio parameters ( 's and a's) do not
tiloo and that say, an
exponentially zero to its with three T.Y·p,1"'V time oonstants: msjO 2 ros and 10 IDS.,
200
Ratio
r
Time Constant :: 0 .. 2 ms
o~~
__
~____
~____
~----~----~o
1 2 .3 4 5Time (milliseoonds)
[image:15.595.58.528.389.758.2]i2
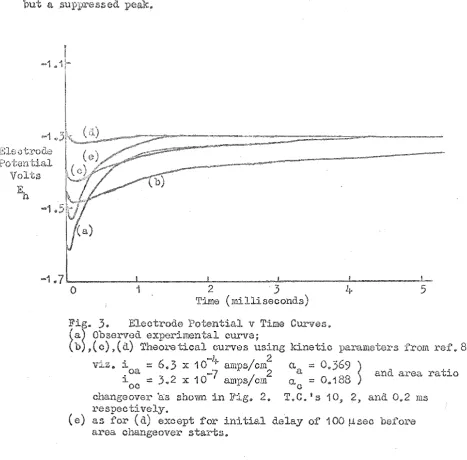
]j'ig. 3 shows a typical no-loacl curve (a)
together with various t..'1eoI'Gtical cur-ves obtained by eqn 7 (with the aid of Program I) using the above assumption conoerning areR
and the values of the anodic and cathodic paramoters (i ' 8 and 0.' s)
o
. 8
from previous work • Those curves show how easily overshoot is N ate the."G a slow a;:"~ea ch;,mgeover (e. g. 1 0 IllS T. C • ) a more negative peat\: potential 'put a much slower renu:'n to the mixed
potential; a fa return to the mixed potential
but a suppressed peak.
o
1 2 3 5Time (milliseconds) Fig.
3.
Eleotrode Potential v Time Curves. (a) Observed experimental curve;Cb) ,(0) ,(d) TheOl"etical curves using kinetic paraIl1ete.:('s from 8 'Itiz. i :::: 6.3 X 10⁻¹¹- amps/cm2 C/, ;;;:: 0.369
~
oa
7
2 a and area ratioi 00 :: 3.2 x 10- amps/em . a.::::: C 0.188
changeover 'as shown in 2.
T.e.
IS 10, 2, and. 0.2 msl~espec ti vely.
[image:16.595.57.525.304.764.2]TIns BUggeSt5~ bearing in mind the above assuluptions p tio.a-c a
as is (see (a) Fig. 3) can obtained only if' ·c:rl.ere
effectively a of ca modic p:r-oces3 and
then in a short time w~st of the area beoomes oompu ted trace 1~<3
is also shovm in
3,
OUI've (e)" Such a. in the of spontaneous hydrogen ion discharge on eleotronegative metals ispostulated from atomio theory by Basfl7 and. it would appear that Hagy-ard's and Williams' observations were the in which this phenomemn has . been experimentally recorded.
Although oan aCCOllrlt for overshoot, the
the 'curve as agree with calculated,
that are not
true For this reason and
is PO!JItpol'led 'lID til the
3.
The experimental techniques used in this re:3ea:J."oh were very similar to those used in work in this department under
Dr Hagyard" vr.l:~h the exoeption of a few points mentioned in this In the main they consist of measul~ng oscillographically the potent;illl of a
eleotrolyte solution ..
to an
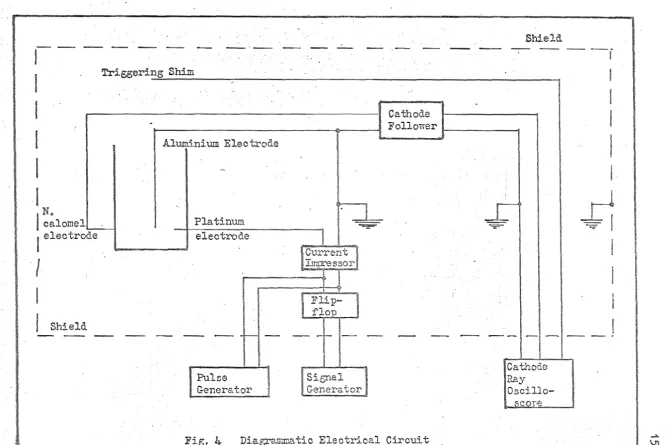
Fig. 4- shows a diagrammatic layout of the main equipment, all, except the osoillosoope and signal or pulse generator, being placed inside an earthed screening cabinet to minimise eleotrostatio and
rr~gnetic effects on the circuitry involved~
All potentials are on the hydrogen scale unless othe~dse
qualified",
A high-speed co. thode follow6l'" ( time 0.1 ~ sec I input impecla,nce
M~) (oircuit diagram Fig .. 5) in earlier measurements in this
work Vias connected to a. Cossor 1065 pulse oscilloscope for potential measurements.
[image:18.595.60.537.58.599.2]I
I
(
Trigger....ng Shim
~----~--~---~---I
I
I
N.
I
calomel~
electrode
I
Shield
Cathode
Follower 1-1---<1 Aluminium Electrode
electrode
Pulse Generator
Fig.
4-
Dia~1.tic Circuit
-=;:;=;-Cathode Ray
Oscillo-scor'S
I
...
[image:19.847.104.775.70.515.2]100SG'
_-_-q.-.1
10MSG 1K52
52 e8K52
.. 01 3~3K52
+1.5
Fig. 5 Cathode Follower Circuit
L 0 +
S11132
45v ie-rrA
e s +
-'"
[image:20.847.108.768.74.518.2]3.2
A current S30r of more advanced design (circuit diagram 6) 8
but of similar principle to that used in ~dJLL .•. eL· work was developed to
enable loads to be applied smoothly variable from cathodio to anodio~ For square "ave work it was thus possible to apply a square wave
whoBe pulses alternately oathodio
and anodic ..
For th~ a circuit (Fig.
7)
was usedto obtain a voltage wav6(:t~ise and fall times oa .. 0.1 IJ. sec) from the roughly square wave output an "Advance" audio
was
square our:t'ent wave which was used. in early part of
For ( time 0.010 JJ. sec)
was used" this main advantages over signal
flip-flop combination; these vrere (1) pulse generator could be oonnected to th~ ourrent impressor directly thus making the flip-flop unnecessarY6 (2) the square wave amplitude could varied smoothly and
easi~ (not possible with flip-flop where disorete ohanges in amplitude had to be made), and (3) the larger frequenoy range of' the pulse
generator compared with the audio osoillator (300 ko v 50 ko).
latter aspeot was essential in making anodic square wave measurements.
18
10K 52 ~ To Plo.timlill
.Elcctrode
101{Q
In G • 6 CU:>{..RE1Y1~
oU'rpUT
2 .. 7K
I i b - - - V C
100 IJ:f
S1 Fe
eu
• 0020 .0020
II
II
.. 0030 max • ,,0025 II
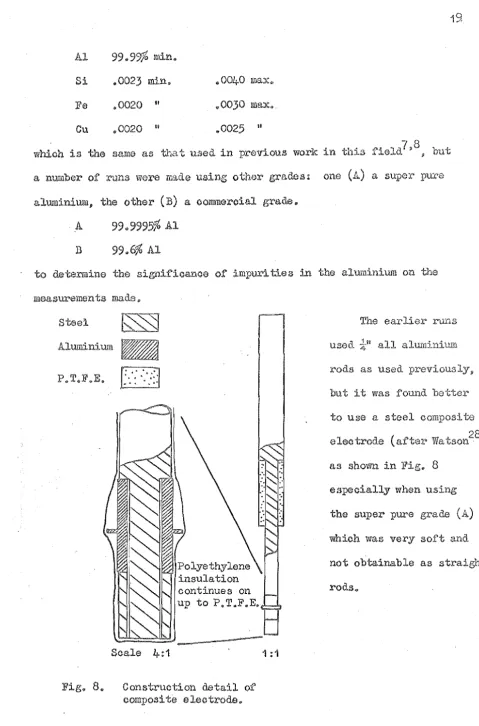
whioh is the same as used in previous work in this ,8 but a number of runs were
aluminium, the other (B) a oommeroial grade@
99 .. 9995%
AlB
99.6%
Aldetermine the significanoe of iIDPuri ties in the aluminium on the measurements
steel The
Aluminium
-
aluminitlll1P .. T.F.E. rods as
pr·evious ly, but it was found
to use a steel composite
( 28
electrode after Watson) as sho\v.n in 8
especially when using the super pure grade (A) whioh was very soft and Polyethylene not obtainable as straigh1 inSUlation
continues on rods .. up to P.T.F.E.
Scale 4:1 1 :1
[image:23.600.52.532.64.790.2]20
The reference used in all cases was a normal
eleotrode connected to the cell through a salt hZ'idge and cellophane membrane as previous 8
The loading electrode in all loaded runs was a platinum auxiliary electrode as used
All eleotrolyte solutions were prepared from "Analartl reagents and de-ionised It was not considered necessary to pre-electro lyse . or in other way specially prepare solutions • A quick oalcula tion
shows that even at maximum impurity oonoentration possible solutions for say 1/1000 of a monolaYell' low ovel'voltage s to a t the l:l"u;'c-f ace
times than the total s
more oonclusive proof of suffioient 28
obtained by Watson where he showed that eVen
diffusion is many run.30
is that
low
ovel'-voltage. solution impuri~ inoreased to times that norm~lly presentl no observable effect was obtainable even at' times 100 times
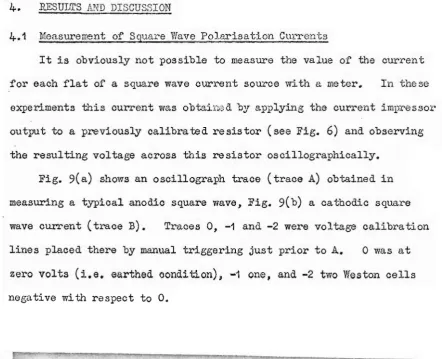
4. .RESULTS AND DISCUSSION
4.1 Measurerrent of Sg1J.ai.~e Wave Polari.sation Cu: ... ·rcn-cs
It is obviously not possible to measure the value of the current
for each flat of a square wave current source with a meter~ In these
experiments this current was obtain0d b~l applying the current impresso!'
output to a previous~ calibrated resistor (see Fig. 6) and observing
the resulting voltage across this resistor oscillographically.
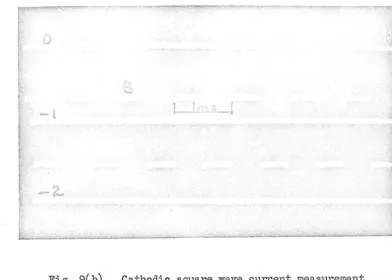
Fig. 9(a) shows an oscillograph trace (traoe A) obtained in
measuring a typioal anodic square wave, Fig. 9(b) a cathodic square
wave current (trace B). Traces 0, -1 and -2 were voltage calibration
lines placed there by manual triggering just prior to A.
o
was atzero volts (i.e. earthed oondition), -1 one, and -2 two Weston cells
negative with respect to 0.
~.
.,. l 7 .... 'I IU
I
I
!
I,
1 _ I
[image:25.595.74.517.108.467.2] [image:25.595.78.496.462.719.2]Fig. 9( b) Cathodic square wave current measurement.
A measurement such as the one described above was made just
before every square wave loaded run made, the circuitry of the cur;rent
impressor (Fig. 6) ensuring that the current as set remained cons tant
for the run,
,
4.2 Anodic Measurements in Chloride Solution
All anodically polarised square wave potential measurements were
made within the first fifty microseconds after cutting. The use of
these potential flats (some microseconds long) as anodically polarised
equili~rium
potentials is justified elsewhere29, but to reiterate very2-2
briefly: unpolarised aluminium electrode potentials in this region are
-1 .65 v 7,8 compared with the calculated Eo
=
-1. 67v quoted by La timer30 •Latimer's value refers, of course, to unit aluminium ion aotivity but
[image:26.600.83.475.111.391.2]aluminium, ion in these
7,8
solutions is not known. The agreement seems reasonable for the present purposes. Additional justificationfor these measurements is afforded by similar high-speed measurements
made by eha pman9 • In tJus work 10-30 /-Ls values of the potential of
cadmium in cadmium chloride ere compared with value s obtained by standard static potentiometrio methods. Agreement to about 10 mv VIIl ...
found.
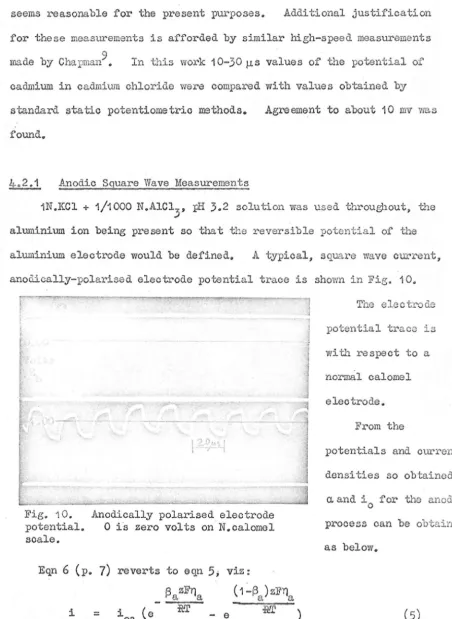
4.2.1 Anodic Square Wave Measurements
1N.KCl + 1/1000 N.AlC1
3, :p.l{ 3.2 solution was used throughout, t.~e
aluminium ion being present so that t.~e reversible potential of the aluminium electrode would be defined. A typical, square wave ourrent, anodically-polarised electrode potential trace is sho~m in Fig. 10.
Fig. 10.
potential. scale.
\ 1 ••. I !
Anodically polarised electrode
o
i's zero volts on' N. calomelEqn 6 (p. 7) reverts to eqn 5; viz:
(1~!3 ) zFYl
a a
i = ioa (e - e ft!r )
The electrode
potential trace is
with respect to a normal calomel
electrode. From the
potentials and current densities so obtained,
a. and io for the anodic
process can be obtained
as below.
[image:27.604.77.529.132.751.2]and. when only the anodic prooess i2 Vlhen
can be simplif'iea. furtber to (1 i
is than 100 fff'J
on the
( 8)
"C.i011 and in the more conventional form Tafel's equation
whare a. (1
-13 )
z aIn
(i is negative by oonvention for anodio polarisation.) Thus fOl' ODe of the polarisation square wave
for the
RT a;F
Subtraoting 11 from 10 and rearranging
RT F
the electrode area only into oaloula tion of
(10)
( 2) 2J~.
the electrode area cannot affect the calculation of a.. Thus only the ratio of impressed currents need be used in the calculation of a.. This mea us tha t the sUl"i' aoe roughne 8 S of no consequence and is effectively ruled out this oaloulation.
The exchange ou~~ent io can also measurements; from aqua 10 and 11
11a2 11
i.e. ( i ) 11a2 '" T'la1 oa
-Tl a2
i 118.1
i.e. i i
oa ca 2
"T)
a1 1/(118.1 - 11 a2)
i.e. i
-
(13)oa Yla2
To simplify the imrolved above, anD. tv calculation of the errol' into these calculatj.ons in lTeasurements of
current a computel~ ~ seo
to calculate a from frmn the current calibration curve and
electrode wavefol'm~ were made by
repeating the calculations twice; onoe measuremen ts at their t, firstly so that a minimum e of a or i is
o
so that a maximum estimate of a or i o is obtained. , Table 1 shows the values of a. and i so
o for a number of replicate runs"
a, a. NJax. a. i oe. Max" i
on
.058
.057
.060
1@44
x10 -2 1 .. 08
x1
1,,82 x 10 -2@027
.026
.0283.60
Ii3 .. 28 II i
3 .. 95
"
0.082
111078
.086
1.35 tl O. II 2.12 It 2amp/em
.045
1:-.36
tI 3 • It5.57
11..
.113 .109 .117 7.39 x 10⁻³ 6.41 x 10=3 1 ~32 II
059
.062 3.35 x 10⁻² 2 x 10⁻² 4,,91 It [image:29.595.58.502.81.335.2]A was built the program to mean and 90,% confidel10e linx'L ts from a number of similar J;:'uns. Illie;. 11 ;:;hows mean l,cUCHCU. from suocessful runs (Table 1) in iN.KCl -+
3.2 solution with the dotted lines obtained from
9Q%
confidenoe values a. and i @o
0 ...
Volta
Mixed Potential
,2 ",,1 0
log:l. (i amps/olll"'Z)
11 Anod: 0
90%
c ~ lind t:;;the lines
The variation tween runs :1.13 seen to greater than that aooountable to elTor in mea51..ll."'eIDl;:~t" Also the measu"C'ements IDade in this way are even more soattered than might expeoted
variability of eleotrode 5tU"i'aoe (e.g. work hardening) and it was realised
that
a f'ul'ther addi tiona! variation might be in drop inThis was signifioant because of the restricted current
26
is flU'ther
by tl:0 movement of tll8 alec
.... ---~,J.
f
should be developed to
I
the solution IR during the run and. drop so at any time OOl'rec t Figw 12. Eleotrode-solution-outter for i t in the calculationsgeometry just after restricted current thinlc at this
sudden jum;j?
a.,and i., The o
would. be
not possible in thi.~~ case
(a) the stray i'T1. th the Lll drop,
Cb) the the aluminium dissolution
similar time so that the fast rise ,due initially
as a is,
constant oapaoi tor-resistance, changes smoothly to t..he potential time of electrode process
the electrically ill the at Fig. 13(0) ahows
of each part (a) (0) above and tho combined re
[image:31.595.83.520.92.371.2]s
solution
Electrode double layex10
5 {
C R
Solution resistance betv'leen electrode and bulk solution mainly in restricted section.
E
Eleotrode Process
Fig. 13(a) present in cutting.
Electrical components cell immediately atter
v
Responso of 118 (
of complete syst8lli.
From e qn 9 introduo1.ng drop, one
u
where it is desired to
i/i ... o
u
apparent overJoltage.This suggested that eq~tionB could be obtained then the unknowns, a. ) a i /)
pulse generators were
Wi th this in mind, two together in such a way that a
three-level (turret) pulse was obtained$ Fig .. 14 shows the current caUbr'::1.tion photograph of a 1!5 shows the potential time truce
[image:32.595.72.533.105.558.2]o
'
-8
Fig. 14. Anodic turret or three-level current measurement trace.
o
is zero volts (i.e. shorted condition); -1, one Weston cellnegative of O.
[image:33.597.78.522.70.688.2]Eqn 14 thUB €,>l.ves eaoh
by sub3ti tuting one gets
U 1 ::::
U
2 ::::U';{
""
;;
from eqn 16
U
1
-u
2 U1 U3 eliminating b
and thus
R. ::.::
=1:0.
=
::;;:
i,.)1 + i 2R. t::. oa
In i3/1 oa. +
- 'ok +
+
b(Y1 :fro) .::. bey
1 y~) ;;
+ RCe
+
RCe
Y1 eqns 17+ R(I!)
-e )
Y'I::;;:
y Y1 U
-u
+:aCa :; a )
1 :;
y _ e 2)
(17) Y
3 )
b ( 19)
thus
b the eqn 16
R k ::::
from whence ::
very quickly becomes on run into these expre for a and
f or: the range
of ill where
say a
a and R are then calculated from the se u
7 .1238 .. 1780 .708 .881
2. II It II II .88})
16
A
In fact would ha va to be and R in
2
in 1 as Line 2 is is 8 mV
1 eOS6 1 .. 077
0,,239
-Ow7
..
~-'"..
-0~9
Volts
~
-1.1
-1.3
-1 .. 5 -1 0 5
o
log i (i amps/em 0+2)
Fig. 16. Anodic tU1~ret example from Table 2 results showing ill condition. :::: U 1.67v.
drop obtained from line 1, table 2. Line B is the Tafel line cor'rected for IR drop using the remeasured U2 (arrowed point), from line 20
When it realised that errors will present in all the other variables as well, it can be seen that the values so obtained are almost meaningless. Thus another method had to b~ fOlmd for these
[image:36.595.80.478.84.522.2]curves presented sect.ion 2.1, trJ8, t the of the potential ourve from the time of potential was reached depended very strongly on tho r:urar;.;;;ters This no. turaUy that the be able be 0 budned fr'om an
analysis of this ourve. For the anodio process alone with no polarisa tion, eqn 6 (p.9) beoame
C ::: i (€I
-
€I )00.
is positive and graa tel'" than 50 mv e is
c
;;:;: i €I a, = (1 zos. a
removing subsoripts 11 and a and integra:ting
t ::: -i~ C
I
"~
whel"e 11 :::: Tio at t ::::o.
oa
19
t (19 )
It oan easily be seen "the above equation that C and
mutually depmdent in of time and overvol tags .. Thus only a and
the -..---.;.
...
of: C to could be detennined from the allunpolariaed electrode potential curve. a simple analytioal regression solution to this equation was not known, a "hill olimbing" procedure was used determine a. and the l~atio C to involved
34
of the deviationB of the calculated times for given voltages from the
observed times for those voltages was a m:in:i.mum. i was then altered
oa
(c was held constant) by small increments until i vIas also an optimum oa
accol:"ding to this same cri tenon. a. 'l'JaS then optimi3ed avain and
subsequently i and so on until no further change in a. or i gave any
oa oa
im~rovement in fit. To accomplish this economically, the above
procedure was incorporated in a computer program (ProgY'am III, Appendix
Fig. 17 shows a photograph of a typical unpolarised electrod potential trace from about a miorosecond after cutting has started.
At a scan speed of the order used in these runs it is necessary to
trigger the trace on the ,potential fall itself, and to avoid spurio.us triggering it was found by experience that a trigger starting level of
about
0.5
volt had to be used. Thus, in spite of using the built-indelay line in the Tektronix osoilloscope, the potential is not seen
from the initiation of cutting.
[image:38.597.74.522.92.496.2] [image:38.597.108.425.500.754.2]I
-1.3~
Electrode PO'l;ential
.,,1 .. 7
o
4 8 12 16Time (microseconds) from oompletion of cutting :F'ig0 1 C of actual curve wi th fit ClU"V6 fitted
by Progt'8J!l III. (a) actual curve, (b) fitted curve.
Only points from' the flO tllal curve after outting was completed
were used in the Parameters obtained were a. :;;; 0.1 04, :;;; 7 0 x 1 0-5 F / amp
Fige 18 shows this same curve together with the theoretical curve fitted by Program III ..
Calculation of a. and the ratio e/i using only that part of the oa
curve where cutting had been completed, was done for the two runs where this was possible (cutting time was short enough), and the average
/
-5 /
values found were a. = 0.1, C i :;;;
6.5
x 10 F amp.oa It is found,
[image:39.595.67.538.70.396.2]36
a.
eli
(F/amp)08.
1 .1 C4- 7.0 x 10⁻⁵ ) MeasIJ . .:cements taken from curve after 2 .095 6.0 II ) cutting completed
3 .093 4.9 II Cutting ocourring over full measurement
4 .102
5 ..
1 II n II II half II5 .081 6 II II II
"
half Ii6 .094- 7Q6
"
Ii1'1 tI full II
7 .104- 4.8 II tl II
"
quarter It8 .096 3.4-
"
"
II II full IIMean of 3-8 .095 5.4 II
Overall mean.096
5.7
IIAnother observation which shCfw5 that outting apparently has effect is fact that, in general, no discontinuity on the ourve oan be found where outting has been oompleted. the creation of eleotrode surface as oocurs during cutting did affect the potential time curve obtained, then it would be expeoted that on cessation of outting a discontinuity in the potential time curve would be obtained.
This apparent lack of ~ffect of outting on the ldnetic pararreters is surprising and diffioul t to interpret. It suggests that the
electrode-solution capacitance, whether due to the conventional electrical double layer or not, does not change its capacity with , at least in tite potentia.l region where cutting generally finishese This may mean that the zero oharge potential for aluminium in this situation is about
-1.6v
or that the establishment of tile usual electrical double layer is a slow process oompared with that usually quoted38•
a fraction of a microsecond9 this case a disoontinuity at
oessation of cutting would appear the potential time trace obtained. The aecond explanation would show no such liiscontinui ty and is
supported slightly by the double-layer oapacities measured at this time (see table
4
oolow) which are ul1.uswclly low; nearly an ordel~than the double-lD,yer capacities measured a millisecond le. tar in this potential region (section 4~4)o
Further slight support for the second possibility is offered by earlier measurements on those runs in whioh outting was completed before measurements were made (i$e. 1 and 2, Table
3).
If these earlierpoints on the curve before outting was complete were used in the
(Program III) then lower values of ~and
eli
were oa obtained (e.g. of 1, Table 3, with ~:::: 093 andell
o If now t~e a obtained above is used in conjunc or ordinary square wave
6.5
x
1wi th the turret
the differenoe in a between these is due to solutim1
IR
fu~opthen this can be detem.ined using eqn 11+ and hence i can be obtained. oa
If this is then used with the value of .
eli
oa ratio found also from the unpolarised runs, a value for the double-layer capacity for the alumini~~leleotrode at this time is obtained. (The electrioal double-Layer capacity could not be obtained from the initial slope of the potential jump in the anodio Squal~ wave measurements for the same reason that the solution III drop could not be simply obta,ired (see sec tion 4.2.1), viz. beoause of the capacitanoe of the insulated electrode with respeot to the solution together with the stray circuitl:'y capaoitances in parallel with this. Thus the initial slope if used for a capaoitanoe determination would give the insulated eleotrode plus stray capacitance and not the
Values of' i and C determined in this way are tabulated below oa
(Table 4).
orig. orig. i i ( vii thout IR drop) C
20a oa 2
IlF/cm2
a amps/em amps/em
.. 058 1 .. 44 x 10 -2 1_7 x 10 -2 1.10 ,,027 3 .. 60 x 10 -2 2.0 x 10 -2 1.30 ,,082 1 .. 35 x 10 -2 1..3 x 10-2 0.,85
..
~ 4 .. 36 x 10 -2 3.6 x 10⁻² 2 ..34-cathodically-polarised square wave potential measurements 38
were maCLs vii thin the fir five milliseconds after outting~ This time was sufficient to allow the electrode to clear the cutter, allow the hydrogen discharge process to become established and yet short. enough so'that ooncentration polarisation would not affect the measurements
8
ma~ •
A solution of' iN.KCl pH 3.2 was throughout (cf. section 3.2.1, no Al ion)' so that the only feasible cathodic process was the disoharge . of hydrogen as disoussed in section 1 .. 2.
-1.00
Fig. 19.
IMS
Typical square wave cathodically polarised electrode potential trace in 1 N.KCl pH 3.2.
The oondi tions with regard. to current oonsi ty and potential for
.the potential flats are similar to those obtained in seotion 3.2.1 except that the process is purely cathodio. Thus eqn 6 reverts to
eqn 2 at steady state ; .1. when only the cathodio process occurs on the
eleotrode and so equations analogous to 10,11, 12, 13 are obtained
with i , ~ , n irt place of i ,~ and z respeotively.
00 0 oa a
Program II (discussed in 3.2.1) was therefore used to oaloulate
values of ~ and i and the measurement error:~ in these.
o Another small
seotion of Program II W,aS used to m9.lce a correction for the IR drop
which affected the parameters obtained and was most signifioant in the
solution olosest to the eleotrode. For this correction the resistance of a segment of a sphere (radius 0.2 om) whose angle was equal to the
[image:43.595.110.452.131.362.2]40
area spherical with radius such that the' electrode area in this model was equal to the apparent electrode area as measUl~od under the rnicroscopeg
As, wi th the anodic results. the mean values and 90};'; confidence values COl:'r'ected in some measure rOl" IR drop as outlined above, were detepminerl (see Table 5) and the Tafel lines rosul are plotted in 20.
a. :MirLO, Max. a. i IVan. i Iv~x$ i
00 DC 00
.23' .212 .262 1 2::.::10 -8 2 .. 7.x1 0-10 1.8.x10-7 .177 .222 3 ",)x -I 10-7 2 .2x:1 0 -8 2.1J.X10 -6 .233 .. 201 .. 281 9.0:7.10-9 4.5x10⁻¹¹ 2,,9x10-7
.. 257
.218 .317 1.2x10 -9 3.2x1 2 5.2x10 -8239 .. 228 .252 3.7x10 -8 3.1x10⁻⁹ 2.7x10⁻⁷ .. 1 .183 .210 9.2:7.1 0-0 1.6x10 -8 1j-.. OX10-7
In
this case the davia tion between runs could well be accounted for 'Py the error in rnea;;mrement (see Table 5) so that the mostprobable values for i and a, are 2.3 x 10=8 and 0,,225 respectively with o
90ft confidence values of 1 .. 2 x 10⁻⁹ and 4.4 x 10⁻⁷
fo~
i , and .262 and o.188 for a. for hydrogen evolution on aluminium in 1N.KCl pH 3.2.
o
,~---~~---~---~---~--______ ,
Rev. H2 potential in pH 3.2 soln.
~
Volts
-2~---~--
______
~______
~________
~~~__
-J-10 -8 -6 -~
log i (i amps/ cm2)
-2 0,
Fig .. 20 .. Cathodic Tafel line
~
=
0.225 and i = 2.3x10-890)b confidenoe limits a, ,,188 and • ~62
[image:44.595.72.526.408.780.2]The potential time trace obtained using the best estimates of anodic and cathodic pal~ameters and assumine; that the eleotrode function changes fail"ly rapidly (exponentiallY with T;:;: 2 rna) from anodic to cathodic (st<;i.2'ting to do so after a 20 ~1.S dela,y) was calculated and is
~ 21. Curve (a) is a t7pioal no-load CUl~e obtained experimentally (curve (a), 3 ).. The anodic parameters
( ) seotion 4.2.3 were -2 .1 2 / 2
CL :::: 0.10, i :;;: 2.15 x 10 amp/om and C :::: 1.411.F em,
a oa
The best cathodic parameters (section 4.3.1) were a. :;;; 0 .. 225, i == 2.3 :-::.10-8
(': oc
2
amps/em.. C used for that part of the curve after the area changeover
~tarts» was too t measured from square wave polarisa tiona in the mixed
(viz ..
7.6
~/cm2)
two curves (0) and (d) were obtained using the9Q%
oonfidence for the-1 .. 1
Electrode Potential·
Volts ~ -1 .. 5
-1.7~0---~1~---~2~---~3~---4~---
Time (milliseoonds)Fig. 21.. Predic no-load ourves compared with experill1ental curve. (a) Experin:ental ourve. (b) Predicted curve using best estimates of anodic and cathodio parameters with 20 j.L sec
[image:45.595.75.505.431.770.2]Curve (a) in Fig. 22 is the same curve as (a) in Fig .. 21. The remaining curves show the results of (b) area ratio changing more slowly (viz. T
=
2 IDS) still starting to do so after 20~s, (0) starting the change :\ . .:tio :':com time zero with T = 0.2 ms and not from 20 ~secafter c the in area ratio from time zero wi th r, tb; .. ~~ the area. ratio changes with T :::: 0.2 ms after 20 ,usee del<..<,..j or i .'- by a step after this same delay makes no
sigrilfioan <~ to the resulting curve. However, if the peak is e" by expanding the time scale, then the ins tan tane ous change over seen to cause a break in the computed curve whereas the more gradual changeover s a smooth curve. As no brealc
was observed traces this suggests that the
changeover was smooth and not disoontinuous,.
-1,,1
Eleotrode Potential
Volts Eh
-1.7~--
____
~______
~______
~______
~__ __
o
1 2 34-Time (milliseoonds)
Fig. 22. Predioted no-load curves compared with
(a) Experimental curve (b) Predicted cvrve slower area ratio
changeover (T.C. :: 2mB) still 20 ~sec. delay •.. (0) and.(d) no delay (c) T .C .. of changeover 0 .. 2 msec
[image:46.595.38.520.427.765.2]is entirely f'easible and indeed probable that the previously assumed delay before changeover commences is not a pure delay as postulated earlier but that the area ratio changes over as a second or higher order exponential type cu:rve as shovn1, in Fig$ The
Max
Area Ratio
r
o
o
0.1 2 00Time (milliseconds)
23.
Possible area changeover.obtainable at Be,,"lt does not permit re30lution of point and no a ttempt has been L,ads to determine
coefficients for such a function as suggested above. Providing the
:rat:io is
zero some 20!l sec s or so after cutting and then rapidly increases to its maximum value, the
observea potential time traoes are explained. It would comparatively easy to inoorporate a more complicated changeover function into
Program I when became justified.
The reasons for this delay in initiation of area changeover are difficult to surmise. The phenomenon of ,the peak potential is not confined. to aluminium but certainly occurs with magnesium and titanium
and presumab~ with many other metals of high electronegativity so that
the explanation of area funotion chrulgeover would apply on these me~~ls
Fig. 24. No-load electrode potential trace for magnesium in 1 N.KCl pH 3.2.
It might be thought that a possible cause of ~~is delay could
be the necessity for accumulation of .adsorbed hydrogen atoms on the
metal surface, the hydrogen a toms so adsor~8Cl. inhi bi ting the anodio
dissolution process and concurrently aiding the hydrogen discharge
process possibly by the Electrochemical Mechanism of Bockris and
Potter41,viz:
+ e
+ MH +
where M is a metal atom on the electrode surface.
'l'his possi bili ty is e<lf3ily ruled out by a simple caloula tion
which shows that less than 2J/o of a monolayer of hydrogen atoms could
be deposited in 200u,Sec at which time it has been found that the
electrode surface should be 9~/o cathodic. Another point which count;:;
strongly against the above argument is that :if the cathodic process
producing this adsorbed hydrogen were occurring at anyyvhere near the
[image:48.595.85.472.91.358.2]A reasonable explanation for this could involve the orientation of the adsorbed water molecules at the surface of the metal" At relatively positive potentials, molecular water is presumably adsorbed wi th the negative end of the dipole to'tu~:cds the metal surface (see Fig. 25( ); at relatively negative ,Ii .. tb the posi ti ve end
towards the surface (see at a140 show
tha. t oonsiderable doubt arlsta conoerning the potential at which
reversal of the dipole ocours even on mercury, the most commonly studied metal ir!, this field. No informa. tion
METAL SURFACE
Fig. 25(a) Water Moleoule Adsorbed oxygen end to metal@
available for aluminium.
Fig. 25(b) Water Molecule Adsorbed hydrogen end to metal"
If it is now assumed that hydrogen discharge oannot effeotively occur with the oxygen end of the water molecule adsorbed and that the reversal or reorientation prooess is a prooess taking longer than, say,
20 ~seoJ then the observations made are partly explained. Thus, iJ;'"
[image:49.595.70.517.151.522.2]somehow stifle the anodic dissolution process. This argument is
supported slightly by the fact that there is no observable delay in
the initiation of the hydrogen ion discharge process when the
eleotrode is cathodically loaded, i.e. maintained much more negative
before and during cutting (aee Fig. 26).
-2 .. 0
fVolt3
E
h
,-3. ..
0-1-4 .. 0
Fig. 26. Cathodically polarised electrode potent~al trace on coarse volt scale showing no apparent delay ~n ~nit~ation
of cathodio process.
Another possible explanation of the del~ is that the adsorption
of water no matter the orientation is a relatively slow process
( somewha t greater than 20 I-L seo , say) and that this adsorption both
stifles or inhibits the anodio dissolution prooess and is neoessary
for the hydrogen disoharge prooess to ooour at all; the water or other
moleoule being an intermediary in the eleotron transfer prooess.
Further support for the adsorption of water theories is given
by the no-load behaviour of the aluminium electrode in
98%
methanol [image:50.595.62.513.74.785.2]Fig. 27. No-load electrode potential trace in methanolic solution •
.
J
1
cathodic parameters in methanol solutions, although not very
reproducible, suggest that the decay to the mixed potential should
be faste~ than in 1N.KCl aqueous solution as is observed in sulphate
solutions (section 4.5.2). Lower overvoltages in methanolic solutions
have been reported42 previously for
o~1er
metals. The fact that the decay to the mixed potential is much slower oould be explained by the.adsorbed methanol moleoules reorientating at a much slower rate than
water molecules, whioh seems reasonable in view of the larger size of
the me~hanol molecule. This would account for the slower decay to
the mixed ~otential in spite of the probably more favourable disoharge
[image:51.600.107.431.109.377.2]In an attempt to determine which, if any, of the foregoing re sul ts were specific to chloride ion or
r:H
in solution, a number of runs were done in sulphate solutions and in solutions of pH. A few runs were made in chloride solutions using aluminium of a different purity" No dH'ference was observed among runs using aluminium of Oiffc;'ent grades, at least in the range of three ties available here (see section3.4).
This indicates that the impurities present are oertainly not present as pure components for if iron, were present as normal metallic at the minimum ooncentration speoified, for instance, then current oarried by the iron at the usualpotentials measured (assuming i'U~-JlJ~.J_ overvoltage would be about 1000 times that
measured) at the same potentia,l ..
of' pH 2, 3, 4 and 1N.KCI + .. 0003,; N.AlC1
3 solutions of
for h'on)
2 and 4 within the 50 ).Lseo cutting were not significantly different from eaoh other or from the similar runs in chloride solution
Iii
3 .. 2That the anodic reaotion appears independent of pH in this range is expected. ThuS the observations so far made in this respect suggest that the anodic reaction probably only involves aluminium ions, viz:
Al --iJo AI +++ +
or Al Al + + e
at least in the time and potential region oovered by these .1~8.
Sque~re wave runs were made in 1 N.~S04 pH 3.2 solution in a manner identical to those made in 1 N",l{CI (.section 4.3.1) with the
result that be significantly larger and ~
signifioantly than the comparable results in chloride even when drop oorrections are rna using the slightly higher resistivity of the sulphate solution. These results are:
-6 2
best estimatei::: 7.9 x 10 amps/em a = 0.131. o
_c 5
9C!}b confidenoe limits 2 x 10 0 and 3 x 10- for i ? 0.175 and .01.58 for a..
o
This means that even though the current density is less in sulphate than in chloride solutions in -2.0 volt region, the current required by the cathodio process at the mixed potential is higher in the case of sulphate than chloride, assuming of course straight Tafel line behaviour to the mixed potential region. Beoause of this, one would expect the decay
to the mixed potential for an unloaded trace to be much faster in sulphate than in chloride solution. This is, in fact, observed.
50
ctrode Potential
Volts
-1.7~---~---~---~~---~---3
o
1 2Time (milliseconds) 28. Comparison of potential CUl~es. actual trace in chloride solution «a) actual trace in sulphate solution predicted trace in sulphate solution:
(c), and an unloaded potential obtained in
from Fig. 21)
(a) as in Fig. 21. was difficult at sight see why hydrogen ion should
be more easily discharged (Shown by the larger i ) from sulphate solutions o
than chloride solutions of the same ~I. at least at potentials more
positive than ca. -1.7, as the only difference between them was the anion. This increase in i was possibly due to the difference in the struoture
o
of the electrioal double layer as it seeillS unlikely that either anion would enter directlY into the hydrogen disoharge reaction. The most
like~ change in double layer structure speoific adsorption and, as
It is well lmovm from Grarlume' s
worl~5
that chloride ion is speoifically adsorbed on meroury whereas sulphate is not. Bookris36
has evidence that cr~oride ion is quscli ta. ti vo ly in the same way on Pt, eu, Ni and Fe.It seem unlikely at sight 1;he.t ion would ·be specifically adsorbed at potentials as negative as se for as the eleotrode becomes more negative would tend to repel anions and presumably desorb anions already adsorbed. Watson28 has slight evidence this might oocur when he obtains hydrogen discharge
parameters on aluminium in 1 N.KCl at very much times than those used in present work and
sulphate solutions by Kolotyrkin
37
hasare remarkably
evidence fOl" decreasing the rate of the hydrogen oadmium, and thalliume He also shows that
on these metals was even at -1 .. Ov. It would thus seem tha t chloride
to those obtained
halide ion process on adsorption of
as negative as was being
cally adsorbed on allmdnium and also hindering the hydrogen discharee on this metal as suggested by the values of i
o
This seems very much more probable than. adsorption of sulphate
The ohange in a. with anion suggests thB,t a different step
exerting more control this disChal'ge most probably due again to the effect of speoifical~ adsorbed
Square wave runs were made in solutions of 1 N.KCl 2.0 and 1 N"K
2S04 pH 2.0 in a similar fashion ~to section 4.3.1 with the expected result that hydrogen ion was more easily discr.arged from
52
solutions of 2.0 than solutions of is significantly
larger. Best e were i
00
-6
.
8 x 10 " C1::;:; .183 111 the chloride solution and i
oc
-5
= 6 e 2 x 1 0 ,a,::.1 62 in the sul pl1a te
solution. However, the validity of these figures is doubtful as it was difficult to polarise the electrodes in these solutions to potentials muoh more negative than the expected reversible potential of aluminium.
was therefore possible that aluminium waaionising and adding to the current impressed. The difficulty of polarisation is in agreement with the higher values of ioc obtained and aluminium ionisation was
assisting the impressed current, then the true values of i will be
00
even higher (true values of CL lower) as can be seen from
29.
A.pparent i o
log i
Actual potentials observed
Apparent impressed ourrent densities
Possible true impressed oux'ren t densi tie 5
Fig. 29. Effect of aluminium ionisation assisting impressed current on i and a •
00 0
o
This strong dependenceof i on pH points to the
o
0primary dis::;barge step,
i.e@ the oharge transfer step, as being the controlling step in the overall discharge reaction.
The higher values of i oc in solutions of lower PH
obtained here are in agreemel,t with the no-load traces
[image:56.595.73.533.363.762.2]W3,./0 current method has been used SUCCE:ssfully to obtain
the c;"t0dic ovorvol tage parameters fOl' evolution on almninium but found inadequate by itself for deteX';;nining the anodic parameters for aluminium dis ,:m, nudnly 'beoau38 of the complicating effects of solution IR drop. However, a method was developed for the
determination of
a
and the ratio e/i from the analysis of the initiala o~
potential in the 20 ~seos during and just after cutting. By combining these results with the square wave results, it was found poasible to obtain the drop i ,and hence C from G/i •
oa oa
It is shown that the no-load potential trace obtained cannot be explained unless there is a, change in pal"ameters or area function
time It was found that the more comren:'Lent way of :tng this change with was with t..l-J.e changeover in area funotion. Vlhether this concept
is
real or not in the physioal sense is not kl10wn for as yet" no visual microscopio evidence for discrete anodic and cathodic areas has been obtained. Even though a simple calculation shows that a single discrete anode on an unloaded electrode after minutes in solution at the mixed potential should be within the resolution of' a good optical rnicroscope, thi~i5 not so there are quite a number of anodes (say 100). Thus whether the anodic and cathodic areas are disorete or not not resolved. If they are discrete the area change-OVel" ooncept is directly applicable; if they are not the area changeover oonoept is still a.pplicable theoretioally but, when thought ofpractically, results a rather complicated concurrent change in io
both the cathodic and anodic processes; roughly ioo must increase and i decreasEl.with time in a manner similar to that given by the area
ratio changeover.
In aqueous sol.utions the decay from peak to mixed potentials seems detern::'med by the double layer capacit,y C and i ~
oc This is most easily seen by the po"tential from peak to mixed potentials for a normal calculated no-load CUL~e (T@C~ of changeover 0 .. 2 IDS or faster) with the potential decay through the same potentials
obtained by making a step change in current loading for a simple aluminium electrode acting solely as a hydrogen discharging cathode .. They are effectively coincident (see Fig.
30).
This means that the area changeover or change in parameter,oocUTs rapidly enough not to oontrol the potential decay.Electrode Potential
-1.5
Volts
-1.7~---~---+---~---~---o
1 2 3Time (milliseconds)
Fig. 30.
(a) Potential time curves; predicted no-load curve and predicted potential with appropriate step change in cathodic loading; these are coincident. (b) Actual no-load methanol trace. [image:59.595.62.531.339.775.2]the case of the methanol solution i t seems that the deoay in potential is controlled by the changeover in area function, thus lending support to the idea that the area ratio change is due to re-orientation of solvent molecules on tJ.1e eleotrocte surf'e.c6. An actual metha::lOl potential curve is plotted and compared wi"ch that :oxpected area ocourred as rapidly as in aqueous solutions (see Fig. 30 on previous page) •.
Cathodic measurements in sulphate show that at potentials more positive than
-1.7
volts, hydrogen appears to be more easilydischarged frOID sulphate than chloride solutions of the same pH. The most likely explanation for seems to be that specUia adsorption of '~iloride ion hinders hydrogen discharge in the latter
solution.
b slope of Tafel line
i
ic
i o
impressed current density: caulodic if
anodic if negative capacitive current
ourrent
exchange current density
n number of electrons transferred in the cathodic rate-controlling prooess
r cathodio to anodic area ratio
Y i
z of alec
ra t'. -controlling
c
electrical double-layer capadtypotential of the e 0 trade on the hydrogen scale
reversible of the electrode vdth respect to the same reference electrode as V
F Faraday
f r ' universal gas oonstant R resistance of solution T absolute temperature
u
al:JFaI"Ant ovewol tage=
11 - iR.V potential of the electrode vdth respect to a reference electrode
2 (ampa/em )
(amps/cm2) 2 (amps/em) (amps/om2)
(farads/cm2) ( VOlts)
(volts) (ooulombs)
(joulesrK) (ohms cm2) (OK)
(VOlts)
a. overall t:cansfer coeffioient electron tr·:'1Xlsfer ooeffioient overvoltage
Subscripts a anodic c cathodi.o
::: V - E o
1. Clark and Akimov, Compt. Rend. acado sci., uRSS, 805-9
(1941)
2@5.
6.
7.
8.
9"
10 ..
Brown and Mears, Trans. Electrochem. Soc. ~
495
(1938) Moriss and Lacombe, Compt. Rend., 658-9 (19lj..6)Masing and Altenpohl, Z. Metallkunde, 404 (1952)
Chandron, Lacombe and Youssov, Compt. Rend., 229, 201 (1949) Ergang, Masing and Mohling, Z. Electrochem., 160 (1951) Hagyard and Williams, Trans. Soc., 2288 (1961) Earl, E.(Hons) Thesis, Univ. of Canterbury (1960) Ragyard and Chapman, in press.
Smi thells, "Metals reference book", 294, Butte~vorths (1962) Frumkin, Doln and A c t a . Chim. URSS, 793 (1940) 12. Randles, Disc. Soc., 11 (1943)
13.
'"'0c~:scher,z.
Phys. Chern., 286 (1951)14. Delahay, tlNew Instr1.:unental Methods in Electroohemistry, It Interscienc69 N. Y.
15. Vielstich and Delahay. J.A.C.S ••
11,
1874 (1957)16. Garisoher and Stanbach, Z. Electroohem., 789
(1957)
17. Barkar, Trans. Syrup. Electrode Prooesses, Yeager , 325, Wiley(1961) 18. Sand, Phil. Mag.,
45
(1901)19~ Karaoglanoff, Z. Eleotrochim., 5 (1906) 20. Rojter, Juza and Polujan, Aota Phys. URSSJ 21. W1jnan and ~mit, Reou1l.,
22. Ger1soher, Z. Electrochim., Berzins and Delahay. J.A.C.S.,
22 (1960) 604 (1955)
6448
(1955).
389.
845
(1939)Bockris. uModern Aspects of Electroohemistry ,II 180,
60
25. Karasyk, Law and Linford, J. Electroehem. Soc.,
111,
237 (1964) 26. Gill, Proc. Camb. Phil. Soc., ~, 96 (1950)27. Bass, Proc. Roy Soc.,
151,
125 (1964)28. Watson, Dept Chemical Eng' g, Univ. of Canty, Private communication" 29. Hagyard and Earl, in press.
30. La timer 1 1I0xida tiol1 Potentials", 263, Prentice-Hall
31.
Delahay, Ree. Chern. Prog.,12.
38 (1958)32.. Reilly and Strwn, "Progress in Polarography",
1,
81. Interscience, N.Y. (1962)33.. Frumkin, Nikololayora-Fedorovich, Ivanova, Can. J. Chern., 253 (1959)
34. Kolotyrkin, Trans. Syrnp. Eleotrode Prooesses, 191 (1961) 35 Grahame .. Chem. Revs., 41~1 (1947)
36.. Bockcis, Proceedings 1st Aus Pergamon (1965)
cont. on Blectrochem •• 705,
37" Kolotyrkin, C. T.C. 9th meeting, 406, Butterworths, London (1959) 38. Barker, Trans. Syrup. Electrode Prooesses, Yeager Ed., 336» Wiley(1961)
39.
Wakelin, M.E. Thesis, Dept. Chemical Englg, Univ. of Canty (1964) 40., Bookris, Devana than and Muller, Proceedings 1 s t Australian C emf '"on Electrochem., 832, Pergamon (1965) '41. Bookcis and Potter, J.E.S.,