CERAMIC-IMPREGNATED SOLID OXIDE FUEL CELLS
(SOFC
S)
Chengsheng Ni
A Thesis Submitted for the Degree of PhD at the
University of St Andrews
2014
Full metadata for this item is available in St Andrews Research Repository
at:
http://research-repository.st-andrews.ac.uk/
Please use this identifier to cite or link to this item:
http://hdl.handle.net/10023/6387
This item is protected by original copyright
(SOFCs)
A thesis presented for the degree of PhD
by
Chengsheng NI
University of St Andrews
May 23th 2014
i
Acknowledgement
My years at St Andrews as PhD student have been priceless, fulfilling my greatest
aspiration for professional and personal growth. I would like to thank those who have
played important roles in the process to the completion of this thesis.
First, I would like to thank my supervisor, Prof. John Irvine, for his guidance,
encouragement and trust, which are essential in accomplishing this work. It was a
privilege to work with him. The guidance from Professor Ray Gorte and Professor
John Vohs of UPenn is also appreciated. I also want to express my gratitude to the
examiners of this thesis: Dr Richard Baker from university of St Andrews and Dr
Alan Atkinson.from ICL.
Second, the group members in JTSI group also contribute a lot to my work. Without
their help and advice, this work will carried out on a more zigzag trail. The help from
research fellows Dr Mark Cassidy, Dr Maarten Verbraeken, Dr David Miller and
Dr Cristian Savaniu is highly appreciated. I will also be grateful to the assistance from
Thuy Muhl, Lanying Lu, and Akshaya Satapathy.
Third, I am also much obliged to the working of the technician team: Julie, Candy,
Ross and Sylvia.
Finally, I especially thank my mom, dad, wife, brother and sister-in-law. Without the
help of my hardworking parents, I would never have the opportunity to arrive at this
stage of PhD study. The constant support from my wife, brother and sister-in-law
iii
Abstract
Solid oxide fuel cells (SOFCs) are the most efficient electrochemical devices to
directly convert stored chemical energy to usable electrical energy. The infiltration of
ceramic conductors and catalytic metals (e.g. Ni, Pt and Pd) into porous scaffolds that
had been pre-sintered onto the electrolyte is regarded as an effective way of
promoting the electrode performance via producing nano-scale particles by in-situ
sintering at relatively low temperatures. Large-scale fuel cells (5 cm x 5 cm) are
prepared with this method and tested to demonstrate its scalability so as to achieve
industrial applications. Four configurations are examined in respect of variation in the
thickness of cathode, anode and electrolyte to investigate their effect on the
infiltration process and electrochemical losses. To further improve infiltration as a
method of fabricating high-performance electrodes, much effort is also devoted to
optimising and understanding the microstructure of pre-sintered scaffold and its effect
on infiltration using image analysis and electrochemical impedance.
First, we have prepared the nano-structured electrodes on the 200-m thick electrolyte-supported planar fuel cell with a 5 x 5 cm dimension. The 8YSZ scaffold
is impregnated with La0.8Sr0.2Cr0.5Mn0.5O3 (LSCM) for the anode and La0.8Sr0.2FeO3
(LSF) for the cathode. The large planar cell achieved a maximum power density of
116 mWcm-2 at 700 oC and 223 mWcm-2 at 800 oC in humidified hydrogen. Moreover, with the addition of catalyst of 10 wt.% CeO2 and 1 wt.% Pd, the cell performance
reached 209 mWcm-2 at 700 oC and 406 mWcm-2 at 800 oC. Compared to the cell without catalysts, ceria and Pd are efficient in decreasing the electrochemical reaction
resistance but making the diffusion resistance more obvious.
Second, supported thin electrolytes are prepared by scalable tape casting to reduce the
ohmic losses as that in electrolyte-supported cell. The cell with thick LSF-infiltrated
support is very efficient in decreasing the ohmic loss thanks to the high solubility of
its nitrate precursors in water and fairly high electric conductivity, but the thick
cathode causes higher diffusional losses, especially at 800 oC. Even though with thinner electrolyte, the ohmic loss from the cell with thick infiltrated anode is
comparable to that of 200-m electrolyte supported cell. The extra ohmic loss can be attributed to the compositional segregation of La0.7Sr0.3VO3 (LSV) in the infiltration
iv
diffusional loss from the cathode and the extra ohmic loss from the thick anode can be
achieved by sandwiching the electrolyte between electrodes with identical thickness.
A flat large area cell prepared with this method can achieve a high performance of
300 mW cm-2 and 489 mW cm-2 at 700 oC and 800 oC, respectively, if Pd-ceria is added to the anode LSV as catalyst.
Third, image analyses and modelling are performed on the constrained sintering of
porous thin film on a rigid substrate to study the evolution of pores at different stages.
Result shows that both the anisotropy of the pore former/pores in the green body and
transport of materials during the sintering process have effect on the orientation of the
final microstructure. Specifically, the in-plane orientation of large-scale pores will be
intensified during the constrained sintering process, while those small pores whose
shape are subjected to materials transport during sintering tend to erect during the
constrained sintering process at 1300 oC.
Fourth, image analyses and semi-quantification are used to predict the correlation
between the microstructure and performance of the LSF-infiltrated electrode. Two
types of YSZ powders, Unitec 1-m powder with a broad particle-size distribution
having two maxima at ~ 0.1 m and 0.8 m, and Unitec 2-m powder with only one
at ~1 m are selected to fabricate the porous scaffold for infiltration. The porous
structure using Unitec 2-m powder shows finer YSZ grains and a higher boundary
length than the 2-m powder. Ac impedance on symmetrical cells was used to evaluate the performance of the electrode impregnated with 35-wt.% La0.8Sr0.2FeO3.
At 700 oC, the electrode from Unitec 2-m powder shows a polarization resistance (Rp) of 0.21 cm2, and series resistance (Rs) of 8.5 cm2, lower than the electrode
from Unitec 1-m powder does. The quantitative study on image indicates that Unitec
2-m powder is better in producing architecture of high porosity or long triple phase boundary (TPB), which is attributed as the reason for the higher performance of the
LSF-impregnated electrode.
Finally, oxides of transition metals are doped into the YSZ-infiltrated LSF electrode
and the impedances of symmetrical cells are tested to evaluate their effect on the
ohmic and polarization resistance. Cobalt oxides are able to reduce the ohmic
resistance and polarization resistance only when it is calcined at 700 oC, but nickel oxide can reduce both the ohmic and polarization resistance if it is well-mixed and
v
LSF-YSZ electrode slightly changes the ohmic resistance but significantly increases
the polarization resistance. Detailed analyses of the impact of infiltration process on
vii
Content
Acknowledgement ... i
Abstract ... iii
Content ... vii
Chapter 1 Introduction ... 1
1.1 Background and basics of SOFC... 1
1.1.1 Basic principles of fuel cells ... 1
1.1.2 SOFC thermodynamics ... 2
1.1.3 The three phase boundary (TPB) ... 4
1.2 Materials for a fuel cell ... 5
1.2.1 Electrolyte ... 5
1.2.2 Perovskite cathode materials ... 8
1.2.3 Ni(O)-YSZ cermet for SOFC anode... 10
1.3 Direct oxidation of hydrocarbon ... 10
1.4 Alternative anode for carbonaceous fuel... 12
1.4.1 Cu-based anode ... 12
1.4.2 Ceramic anode ... 12
1.5 Infiltration as a method to fabricate composite electrode ... 13
1.6 Structure of a fuel cell ... 14
1.7 Objective of this work ... 14
Chapter 2 General experimental techniques ... 17
2. 1 Ceramic processing techniques ... 17
viii
2.1.2 Tape casting ... 17
2.2 Electrochemical characterisation ... 18
2.2.1 Current-voltage performance measurement (IV) ... 18
2.2.2 Electrochemical spectroscopy (EIS) ... 19
2.2.3 Testing workstation ... 21
2.3 Materials characterisation ... 23
2.3.1 X-Ray diffraction (XRD) ... 23
2.3.2 Scanning electron microscope (SEM) ... 24
2.3.3 Focused ion beam (FIB) ... 25
2.3.4 Particle size analysis (PSA) by laser ... 26
2.3.5 Dilatometery ... 26
2.3.6 Thermogravimetric analysis (TGA) ... 27
Chapter 3 A large area electrolyte-supported SOFC prepared by ionic infiltration. ... 29
3.1 Introduction ... 29
3.2 Experimental ... 30
3.3 Results and discussion ... 33
3.3.1 Overview of the arrangement of electrolyte supported fuel cell ... 33
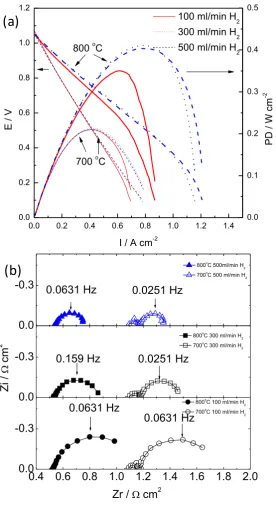
3.3.2 Effect of ceria-Pd catalyst and flow rate on the performance . 35 3.3.3 Air vs. oxygen as the oxidant on the cathode ... 39
3.3.4 Microstructure of the impregnated electrode before and after testing ... 40
3.4 Conclusion ... 41
Chapter 4 Sintering and controlling of the shape of the scaffold ... 43
ix
4.2 Sintering of the green tapes ... 47
4.2.1 Determining the sintering program ... 47
4.2.2 Firing setter arrangement ... 50
4.3 Conclusion ... 53
Chapter 5 A large area SOFC with thick cathode ... 55
5.1 Introduction ... 55
5.2 Experimental ... 56
5.2.1 Fabrication of large-area scaffold for impregnation ... 56
5.2.2 Infiltration and testing under hydrogen or methane as fuel ... 56
5.3 Result and discussion ... 58
5.3.1 Structure of the scaffold ... 58
5.3.2 Microstructure after testing ... 60
5.3.3 Performance of the fuel cell under hydrogen as fuel ... 62
5.3.4 Stability test at 800 oC ... 66
5.3.5 Testing under methane as fuel with Versa jig ... 68
5.4 Conclusion ... 69
Chapter 6 A large-area SOFC with thick anode ... 71
6.1 Introduction ... 71
6.2 Experimental ... 72
6.3 Result ... 73
6.3.1 Compositional segregation of infiltration and phase analysis . 73 6.3.2 SEM image of LSV-Ni electrode ... 78
6.3.3 Electrochemical performance under hydrogen and methane as fuel ... 80
x
Chapter 7 A large area SOFC with thin electrode on bi-electrode support .... 85
7.1 Introduction ... 85
7.2 Experimental ... 87
7.3 Result and discussion ... 89
7.3.1 Images and structure of bi-electrode supported fuel cell ... 89
7.3.2 Electrochemical characterization ... 90
7.3.3 SEM images of the nano-structured electrodes ... 93
7.4 Conclusion ... 94
Chapter 8 Image analysis and modelling of the orientation of pores in constrained sintering process: a balance of scales and stages ... 95
8.1 Introduction ... 95
8.2 Experimental ... 97
8.2.1 Materials... 97
8.2.2 Sample preparation and image analysis ... 100
8.3 Modelling of the rearrangement of PFA/pore ... 102
8.4 Results and discussion ... 108
8.4.1 Image analysis of the anisotropy of the film without PFA .... 108
8.4.2 Image analysis of the constrained film with plate-like pore former ... 111
8.4.3 Image analysis of the constrained film with spherical pore former ... 114
8.5 Conclusion ... 115
Chapter 9 Image analysis of the porous yttria-stabilized zirconia (YSZ) structure for the impregnated electrode of SOFC ... 117
xi
9.2 Experimental ... 119
9.2.1 Materials and ink making ... 119
9.2.2 Image Processing and analysis ... 119
9.2.3 Impregnation and electrochemical tests ... 120
9.3 Results and discussion ... 121
9.3.1 Image analysis of the microstructure of the porous zirconia 121 9.3.2 SEM of the infiltrated electrode ... 126
9.3.3 Impedance measurement ... 128
9.4 Conclusion ... 131
Chapter 10 Study of the oxides of transitional metal as dopants for the strontium-doped LaFeO3 ... 133
10.1 Introduction ... 133
10.2 Experimental ... 135
10.3 Results ... 136
10.3.1 XRD analysis ... 136
10.3.2 Microstructure analysis ... 138
10.3.3 Impedance measurement at 700 oC ... 143
10.3.4 Temperature dependence of the impedance ... 149
10.4 Discussion ... 154
10.5 Conclusions ... 156
Conclusion ... 159
1
Chapter 1 Introduction
1.1 Background and basics of SOFC 1.1.1 Basic principles of fuel cells
Fuel cells are capable of converting chemical energy in fuels directly into electrical
energy, so its energy efficiency is not limited by the Carnot cycle as in the
conventional turbine power plant. The maximum efficiency of a thermal power plant
is represented in Equation 1-1
=W
Q =1-Tc
Th 1-1
where W is the work done by the system (energy exiting the system as work),Q is the heat put into the system (heat energy entering the system), Tc is the absolute
temperature of the cold reservoir, and Th is the absolute temperature of the hot
[image:16.595.98.491.386.624.2]reservoir.
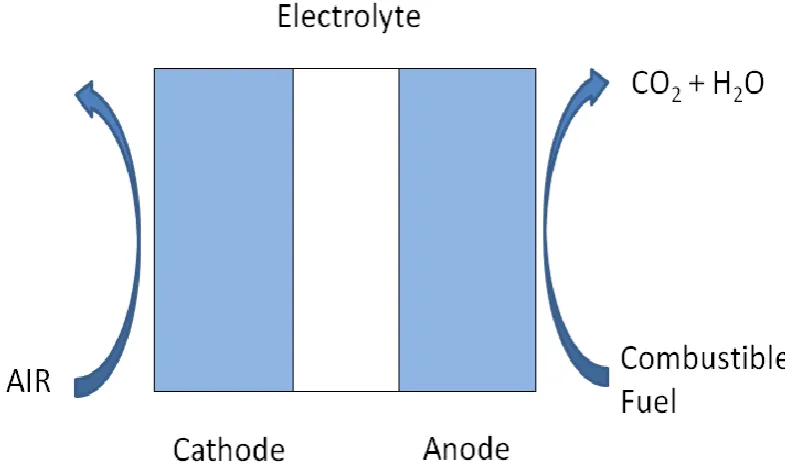
Figure 1 Schematic of the components of fuel cell: an electrolyte is sandwiched by an anode and a cathode.
A fuel cell, as shown in Figure 1, is generally composed of three core parts: an
electrolyte, an anode (or fuel electrode) and a cathode (or air electrode). Five kinds of
typical fuel cells are classified by the types of electrolytes: 1) polymer electrolyte fuel
2
molten carbonate fuel cell (MCFC), and 5) solid oxide fuel cell (SOFC). Broadly, the
electrolyte dictates the operating temperature of the fuel cell. For SOFC, the
electrolyte is an ionic conductor while electronic insulator. While proton-conducting
ceramics are known, the vast majority of work on SOFC has been performed with
ceramics that are oxygen-anion conductors. Of the various electrolytes,
yttria-stabilised zirconia (YSZ) is the state-of-the-art electrolyte for SOFC thanks to its
stability in both oxidising and reducing atmosphere, good durability and relatively
high ionic conductivity1. The anode contacts with the fuel on one side and electrolyte on the other. It is the place where fuel is oxidized, giving out electrons. On the
contrary, the cathode serves to dissociate the oxygen molecules to form oxygen
anions.
The electrochemical reactions on both sides of electrolyte involve the transit of ions
or molecules in three phase boundaries (TPB). Taking the reactions on a cathode
working with a YSZ electrolyte as an example, the oxygen molecules have to reach
the surface of the cathode where they break up to form oxygen anions and give out
electrons. The oxygen ion will transport through the electrolyte to the anode, while
the electrons will pass through the cathode materials and go to current collector. On
the anode side of a hydrogen-fuelled SOFC, water vapour will be produced from the
combination of proton and the incoming oxygen anion from the electrolyte. To
produce proton, the hydrogen molecules need to be dissociated on the anode materials.
A major advantage of SOFCs is that they are highly fuel flexible. Polymer membrane
based fuel cells rely on the conduction of protons which requires that hydrocarbons
must be reformed and purified to remove carbon monoxide prior to use as fuel.
Because SOFCs are based on an O2- conducting electrolyte, this allows the direct use of many higher hydrocarbons without a pre-reforming step.
1.1.2 SOFC thermodynamics
The maximum efficiency of an ideal fuel cell, , is quoted as shown in Equation 1-2,
Go being the Gibbs Energy and Ho Enthalpy for the reaction of fuel with oxygen to produce water vapour and carbon dioxide, respectively. However, the energy losses
in practice are significantly higher than the maximum efficiency because of the heat
production and the enthalpy of water vaporisation if the fuel cell is operating higher
3
G
H 1-2
Since the electrons produced at the anode are at a higher potential than those
consumed at the cathode, they are therefore able to do work on an external circuit.
The equilibrium voltage, E, of a fuel cell is determined through the Nernst equation as in
Enernst= Eo +
RT
F ln(
P(O2 cathode)1/2P(H2 anode)
P(H2O anode) ) 1-3
In this equation, Eo is the equilibrium potential for oxidation of H2 at standard
conditions (in Kelvin), which can be calculated by Go/2F. F is Faraday’s constant, R gas constant, and P(O2 cathode), P(H2 anode) and P(H2O anode) represents the partial
pressure of cathodic oxygen, anodic hydrogen and water vapour, respectively.
For a fuel cell with hydrogen in the anode side, the open circuit voltage is very close
to the Nernst equation predicted in Equation 1-3, However, when the fuel cell is under
load, the potential is to be lower because of the irreversible process in the electrode
and electrolyte. The loss from the electrolyte is easy to anticipate, mainly due to the
joule heat from its ohmic resistance (Rohmic), and can be calculated based on the
resistivity and thickness of the electrolyte. The loss from the electrolyte can be
minimised by using a thinner electrolyte.
The losses from the electrode contain two parts: ohomic losses and polarization losses.
Generally, the ohmic losses for the electrodes are quite small since the electrode
materials are typically made from materials with good electronic conductivity, like
nickel in the anode and strontium doped LaMnO3 for the cathode in a state-of-the-art
SOFC. Mass transport of the gaseous reactants to the electrolyte interface and slow
reaction kinetics for the electrode reactions (e.g. the transfer of electrons) can lead to
potential drops, referred to as electrode overpotentials cathode and anode. The voltage of the fuel cell under current density, i, is
4
1.1.3 The three phase boundary (TPB)
Figure 2 Common strategies for SOFC cathodes: (a) porous single-phase electronically conductive oxide such as (La,Sr)MnO3 (LSM); (b) porous
single-phase mixed conductor; (c) porous two-single-phase composite. Images are taken from reference 2.
The reactions take place in the vicinity of the three phase boundaries (TPB), which
are the dots or lines of the conjunction of the gas, electrolyte and cathode materials2. Figure 2 illustrates the TPB in the cathode where oxygen, which wishes to be reduced
to O2-, diffuses into the open pores of the electrode and is reduced somewhere within this matrix. For a cathode with negligible ionic conductivity, e.g. LSM in Figure 2(a),
reduction of oxygen is generally thought to be confined close to the
electrode/electrolyte interface, where the gas has simultaneous access to both the
electronically and ionically conductive phases. On the contrary, if the cathode is a
mixed ionic and electronic conductor (MIEC), e.g. La0.8Sr0.2FeO3 3, the reaction sites
can be extended to the surface of the MIEC, as shown in Figure 2(b). Another way of
extending the reaction site for a purely electronically conductive material is to mix the
ionic conductor with electronic conductor to make a composite electrode, as shown in
Figure 2(c). The MIEC can also be used to produce such composite electrode. It is
important to note that the connectivity of all three phases is essential in order for the
reaction site to be effective. If any of the three phases are unable to reach a particular
TPB site, the reaction will be unable to proceed at that site. It is a process of achieving
balance among the volume and distribution of the three phases to optimise an
5
1.2 Materials for a fuel cell 1.2.1 Electrolyte
Various oxides, which conduct oxide ions (O2−) or protons (H+), have been found so far. To be a viable electrolyte for SOFC, it should show high ionic conductivity, low
electronic conductivity, and chemically stability in both reducing and oxidizing
environment. Of the available oxygen ion conducting materials, three main material
systems for the electrolyte are partially cation-substituted ZrO2, CeO2 and LaGaO3
and their conductivities are illustrated in Figure 3.
Figure 3 Conductivity of selected oxides. Doped ceria, zirconia, and lanthanum gallate are oxygen ion conductors, whereas doped barium zirconate is a proton conductor. Image is taken from reference 4.
Yttria-stabilised zirconia is highly stable over wide ranges of oxygen partial pressure
and temperature, shows high ionic and low electronic conductivity, and has sufficient
mechanical strength. Stabilized zirconia has been the major candidate for the
electrolyte material ever since SOFC was proposed. Other oxide ion conductors, CeO2
or LaGaO3 based oxides, for example, have been considered as alternative electrolytes.
Most SOFC stacks currently on the demonstration run utilize yttria-stabilized zirconia
6
Figure 4 Crystal structure of yttria-stabilized zirconia.
Zirconia has a fluorite structure at high temperatures as illustrated in Figure 4, with
eight-coordinate cations for A-site of Zr4+ and four-coordinate anions for B-site of O2-. In the unit cell, the cations occupy the corner and face-center lattice sites, while
oxygen atoms are located at eight tetrahedral sites. Zirconia is not a competitive
electrolyte candidate due to low ion conductivity and low phase stability under
operating conditions. Substituting Y3+ for Zr4+ on the A site increases not only ionic conductivity but also the stability of zirconia in oxidizing and reducing atmospheres.
The ionic conductivity is increased by creating a large concentration of oxygen
vacancies due to charge balance as shown in the following Kröger-Vink notation:
Y2O3 ZrO2 2YZr’ + 3Oo x
+ Vo●● 1-5
The number of oxygen ions is increased and subsequently increases oxygen ion
conductivity. Oxygen ion conductivity varies as dopant concentration changes. It
initially is increased and then decreased at higher dopant concentration due to defect
ordering or electrostatic interaction. Usually, 8 mol% Y2O3 doped zirconia (8YSZ) is
used as the practical SOFC. Operating temperature is attributed to ion conductivity of
7
pressure does not have a strong effect on ion conductivity of YSZ due to small change
in oxygen vacancy concentration at the practical partial oxygen pressure range (0.21
atm.- 10-25 atm).
Doped ceria is another fluorite well known for its ionic conductivity. The ionic
conductivity of ceria is an order of magnitude higher than the conventional electrolyte
YSZ (Figure 3), but CeO2 has not been considered viable for fuel cell applications
because of its high electronic conductivity, especially over 600 oC. Fortunately, the ionic transport number is higher than 0.9 at a temperature below 700 oC (and at an oxygen fugacity of 10-18), a value that results in good fuel cell efficiency. The dopants in ceria show a significant effect on the conductivity. In particular, the conductivity
increases and then decreases across the rare earth dopants series from Yb to La,
peaking at Sm5.
Figure 5 Perovskite lattice structure of a cubic structure. Yellow: A site atom; blue: B site atom; green: oxygen atom.
Strontium and magnesium co-doped LaGaO3 (LSGM) is a perovskite showing high
ionic conductivity (Figure 3) and the ionic transport number is close to one6. The perovskite oxides shows the general formula ABO3 (A is a divalent or trivalent cation
and B is a tetravalent or trivalent cation). The ideal perovskite structure is cubic, as
shown in Figure 5. The easiest way to visualize the structure is in terms of the BO6
8
and symmetric structure. The A cations occupy every hole which is created by 8 BO6
octahedra, giving the A cation a 12-fold oxygen coordination, and the B cation a
6-fold oxygen coordination. In the case of LSGM, the doping of divalent strontium on
the A site and magnesium on the B site induces a large number of oxygen vacancies
that facilitates significant bulk ionic oxygen transport.
1.2.2 Perovskite cathode materials
For fuel cell applications, the electrical conductivity of the oxides is often enhanced
by substituting acceptor- or donor-type cations for either the A or B sites. The
rare-earth perovskites, e.g. strontium doped LaFeO3, LaCoO3 or LaMnO3, are commonly
used as cathode materials for SOFC thanks to their ready availability and acceptable
kinetic properties at high temperature.
LSM has been extensively used as cathode material in SOFC. Undoped LaMnO3 is
orthorhombic at room temperature, and shows an orthorhombic/rhombohedral
transformation at about 600 oC because of the oxidation of Mn3+ to Mn4+ ions. LSM has a rhombohedral structure at room temperature, because doping divalent Sr on
trivalent La site already causes the transition of Mn3+ to Mn4+ ions. LaMnO3 might
have oxygen excess, stoichiometry, or deficiency depending on the preparation
conditions. At high temperatures, the oxygen stoichiometry of LaMnO3 varies as a
function of oxygen partial pressure and temperature. For example, at 1200 oC, the oxygen stoichiometry of LaMnO3 ranges from 3.079 to 2.974 under oxygen partial
pressure of 1 to 10-11.6 atm. For LSM, the level of oxygen excess decreases with increased dopant content. For SOFC applications, significant change in oxygen
stoichiometry of LaMnO3 should be avoided to minimize undesired dimensional
changes. In addition to oxygen stoichiometry, LaMnO3 can also show La deficiency
or excess. LaMnO3 with La excess may contain La2O3 second phase, but LaMnO3 can
have up to 10 % La deficiency without any second phase formation.
LaMnO3 has intrinsic p-type conductivity due to the formation of cation vacancies.
The material has an electrical conductivity of 10-4 S cm-1 at room temperature and about 0.1 S cm-1 at 700 oC. LSM is the most widely used SOFC cathode because of its relatively high conductivity and matched CTE with other cell components. The
electrical conductivity of LSM takes place via the small polaron conduction
mechanism. The electrical conductivities of doped and undoped LaMnO3 show little
9
Composites of LSM-YSZ are the standard materials for the cathode of SOFC.
Strontium doped LaMnO3 shows high electronic conductivity (greater than 200 S cm-1
at 800 oC) under typical cathode conditions but has negligible ionic conductivity. LSM will not react with YSZ until the firing temperature is above 1250 oC and is stable under the operating condition of SOFC.
LSC or LaCoO3 possesses both high oxygen ionic conductivity and sufficienct p-type
electronic conductivity at elevated temperature. This makes LaCoO3 a mixed
ionic/electronic conductor (MIEC). Compared with YSZ+LSM composite cathode,
MIEC cathode materials extend electrochemical active sites from one-dimensional
TPB to two dimensional surfaces as shown previously. Similar to LaMnO3, the
conductivity of LaCoO3 can be improved by doping Sr on the La site. LSC exhibits
even higher electronic conductivity than LSM under the same condition. Although
more attractive in conductivity, LaCoO3 shows significant disadvantages on YSZ
electrolyte compared with LaMnO3, including the CTE mismatch and chemical
reaction with the YSZ electrolyte. LSC is more noted as cathode materials for ceria-
or lanthanum gallate based electrolyte due to its extraordinary catalytic activity at
intermediate temperatures. Even so, the CTE mismatch between LSC (16-22×10-6 K-1) and the potential electrolytes is still a problem.
Sr-doped LaFeO3 (LSF) cathode offers the best compromise between performance
and stability for electrode. The electronic conductivity of LSF is lower than that of
LSM but still higher than 50 S cm-1 under normal SOFC operating conditions. LSF may not be suitable for the conduction layer of the electrode but its conductivity
would appear to be sufficiently high for use in the functional layer of SOFC cathodes.
The lack of electronic conductivity should be more than compensated by the high
ionic conductivity of LSF, reported to be 5 x 10⁻³ S cm-1 at 800 oC at atmospheric pressures for La0.8Sr0.2FeO3. Even higher ionic conductivities are possible with
increased Sr doping. These values are an order of magnitude lower than that of YSZ
but many orders of magnitude higher than that of LSM. LSF does not seem to react
with YSZ at a temperature lower than 1200 oC, so it can be used with YSZ to form a composite electrode as a stable cathode for SOFC. In this work LSF is used as the
10
1.2.3 Ni(O)-YSZ cermet for SOFC anode
Nickel is used extensively in SOFC because of its wide availability and good catalytic
effect on the oxidation of hydrogen in the anode environment. In order to maintain
porous structure and longer TPB length, YSZ is incorporated into nickel as support.
YSZ serves to inhibit the coarsening process of YSZ and adjust the coefficient of
thermal expansion (CTE) of the support to match that of YSZ electrolyte.
A variety of methods are used to make the Ni(O)-YSZ cermet anode, including screen
printing, tape casting, chemical vapour deposition, et al.. In most cases, the SOFC
anode is first made with NiO and YSZ. The NiO is then reduced in situ to nickel
metal when exposed to the fuel in the fuel cell. The reduction of nickel oxide
produces some porosity, because of the weight loss and density increase in the process
of NiO/Ni conversion. The thus produced porosity is depending on the volume
percent of NiO in the composite, and pore former is used to produce higher porosity if
needed.
The main concerns with the stability of the nickel/YSZ anode relate to the electrode
dimensional change in reduction-oxidaton (redox) cycle and the sintering of nickel
particles in long-term operation at elevated temperatures. The dimensional change of
the Ni electrode causes the gas leaking problem because of the cracking of electrolyte.
One practical problem in Ni(O)-YSZ cermet is that if the YSZ net work is not able to
provide a support to the electrode, the dimension of the electrode is going to change
with time.
1.3 Direct oxidation of hydrocarbon
For the fuel cell using hydrocarbon as fuel, the reaction on the anode side can be
represented as Equation 1-6, if alkane is taken as the example.
CnH2n+2 + (3n+1)O2- nCO2 + (n+1)H2O + (6n+2) e- 1-6
The relationship between the partial pressure and equilibrium cell potential is the
following
Enernst= E° +
RT (6n+2)F ln
P(O2 cathode)(3n+1)/2P(CnH2n+2 anode)
P(H2O anode)n+1 P(CO2 anode)n 1-7
The standard potentials for oxidation, Eo, are similar for methane (1.05 V at 700 oC) and for H2 (1.01 V at 700 oC). For the calculation, the alkane is assumed to be
11
A primary issue in the operation of any fuel using hydrocarbon fuels, whether or not
steam is present with the hydrocarbon fuel, is the requirement that the fuel cell not be
fouled by deposition of carbon-containing residues. At the high operating
temperatures of an SOFC, hydrocarbons can react on the surface of the anode, on the
interconnect plates, and on the tubing leading into the anode. Hydrocarbons can also
react in the gas phase via free-radical cracking and polymerization, forming tars that
can then deposit on the anode surface. Because of this issue, it is common to map the
region of stability for hydrocarbon fuels based on thermodynamic calculations of the
carbon stability. However, these stability maps must be viewed with great caution
since kinetics, not thermodynamics, are primarily responsible for stability. For
example, thermodynamic calculations imply that one could steam reform n-octane
over a traditional Ni catalyst using a H2O:C ratio of two so long as the temperature is
above 473 K. However, attempts to perform steam reforming using a H2O:C ratio of 2
on Ni catalysts will result in catastrophic formation of carbon for hydrocarbons other
than methane. Furthermore, the choice of catalytic materials used for steam reforming
strongly affects the parameter space over which materials are stable, showing that one
must look more carefully at the mechanism that is responsible for carbon formation in
a given system. Finally, the chemical nature of the carbonaceous deposits differs with
the catalysts present in the systems.
The formation of carbon over Ni, Fe, and Co has been extensively studied, both for
catalytic applications and for “dusting” or “drying corrosion”, the problem of pitting
when steels are exposed to hydrocarbons at high temperatures. Recently, the
properties of Ni for forming carbon have even been proposed for use in manufacture
of carbon nanofibers7. The mechanism on each of these metals, involves deposition of a carbon source onto the metal surface, dissolution of the carbon into the bulk of
metal, and finally precipitation of carbon as a fibre at some surface of the metal
particle. It is important to recognize that with this mechanism the nickel is physically
“lifted” from its initial surface and is not merely covered by carbon8
. The mechanism
also explains why it is necessary to use very high H2O:C ratio for steam reforming of
hydrocarbons lager than methane on nickel catalysts. Filament formation on Ni occurs
when carbon deposition onto the Ni surface occurs more rapidly than carbon removal
by steam, even if thermodynamic calculations show that carbon will not be stable in
12
Two basic strategies can be used to directly convert hydrocarbons to electrical energy
in an SOFC. The first one is to operate the fuel cell with high concentration of steam
or at high temperature regime that inhibits the formation of carbon on the surface of
Ni-YSZ cermet anode9. Alternatively, the anode that does not catalyze the formation of carbon can be used for an SOFC system10.
1.4 Alternative anode for carbonaceous fuel
1.4.1 Cu-based anode
Copper is chosen to be the alternative anode because of its poor catalysis in the
deposition of carbon and high electronic conductivity. Copper overtakes gold (another
metal inactive in catalyzing carbon deposition) because of its relatively lower cost.
The problems of Cu as a wide-spread anode are associated with the low melting point
of CuOx, which causes a problem in the process with YSZ as cermet, and the growth
of particle sizes under fuel environment. The infiltration of precursors for Cu into the
pre-formed YSZ porous structure that is supporting a thin electrolyte is the beginning
of infiltration as a method to prepare alternative electrode for SOFC11. The recent work reported by Tucker and et. al. shows that the sintering of Cu-YSZ cermet under
a reducing atmosphere at a temperature above the melting point of metallic Cu
produces good a Cu network12. The growth of Cu particles would damage the interconnection between the particles that decreases the electronic conductivity13. The addition of oxidation catalyst is also necessary for the enhancement of the
performance of the Cu-based electrode.
1.4.2 Ceramic anode
Limitations of cermet anodes for direct hydrocarbon utilization led to the exploration
of oxide anode materials, which is effective in decreasing the deposition of carbon. To
be a good ceramic anode, it should satisfy the following criteria14;
1) Good electronic conductivity (preferably > 100 S cm-1) at anode operating
potentials (0.7-0.9 V);
2) Predominant anion lattice disorder to enhance oxygen diffusion coefficients;
3) Good oxygen surface exchange kinetics;
4) Fabrication of porous adherent films with minimal processing problems;
13
There are several types of ceramic anodes in terms of crystal structure including
fluorites, rutiles, pyrochlores and perovskites15. Unfortunately, there are few oxides fulfilling all the criteria, but the exploration in this area leads to the discovery of
ceramic materials satisfying some of them. For example, ceria shows fairly high ionic
conductivity in fuel environment and decent catalysis to the oxidation of hydrogen,
but the electronic conductivity if fairly low (<0.02 S cm-1 at 700 oC). On the contrary, lanthanum doped strontium titanate (an n-type conductor) shows high conductivity in
reducing atmosphere (>10 S cm-1) at 800 oC, but its catalysis towards the oxidation of hydrogen is poor. La0.75Sr0.25Cr0.5Mn0.5O3 (LSCM) is a p-type perovskite that is stable
and fairly conductive in fuel atmosphere (1.5 S cm-1 at PO2 = 10-21 atm at 900 oC16)
and shows good catalysis and stability in CH4 as a fuel.
Composite anodes of the ceramic with ionic conductor or catalysts are generally used
in real practice for high performance electrode. This leads to processing issues at the
ceramic anode with the electrolyte materials and the mixing materials, such as thermal
expansion coefficient (TEC) match, chemical compatibility during high temperature
sintering and physical robustness in the redox environment.
1.5 Infiltration as a method to fabricate composite electrode
The conventional approach for fabricating composite electrodes involves sintering the
mixture of YSZ and electrochemically active materials, such as YSZ-LSM (Sr-doped
LaMnO3) for cathode and YSZ-Ni for anode, at elevated temperature to ensure the
connectivity of YSZ. The choice of the sintering temperature should be above the
minimum sintering temperature of YSZ, above 1000 oC, but below the maximum temperature at which the solid-state reaction between YSZ and the active materials
happens. This will constrain the choice of electrode materials. For example, Sr-doped
LaCoO3 (LSCo) is so good a mixed electronic and ionic conductor (MEIC) that it
gives a better cathode performance than LSM and LSF (Sr-doped LaFeO3) do, but it
is not widely used because it reacts rapidly with YSZ at temperature of 1000oC. However, the fabrication of composite electrodes by infiltrating the electron
conductive materials into the well-sintered porous scaffold and sintering again at
relatively low temperature is able to solve this problem and brings about some
accompanying advantages.
First, because of the addition of the conductive phase to the pores of the existing
14
conductivity with volume fractions lower than 30% can be achieved, resulting in the
percolation for random composites, thereby leading to greater possibility to optimize
the microstructure of the electrode17. Because of the existence of the non-random structure, the coefficient of thermal expansion (CTE) of the electrode is compatible to
that of the YSZ component, rather than the weighted average of the two phases. As a
result, the choice of electrochemically active materials is not limited by the close CTE
match. Second, the low sintering temperature decreases the grain growth of the active
materials and thus is beneficial to produce long TPB. Finally, the sequential adding of
active materials or catalyst to the porous structure makes the effect of each component
clearer to be singled out. In addition, the layered structure can also decrease the
solid-state reaction of the separated layers with a layer in between.
1.6 Structure of a fuel cell
A typical SOFC is composed of three parts as described previously: anode, cathode
and electrolyte. Any one of these three parts can be used as the support for the fuel
cell. For the SOFC operating at high temperature, a thick YSZ electrolyte can be
chosen to provide support for the thin anode and cathode since the conductivity of the
electrolyte at high temperature (above 800 oC) is high enough to provide low ohmic resistance. Over the past decade, considerable progress has been achieved in bringing
the temperature down to an intermediate temperature (IT) range of 650 to 800 oC so that metallic interconnects could be used to reduce cost18. The thickness of the electrolyte needs to be reduced to decrease the ohmic loss by employing cathode- or
anode-supported thin electrolyte. The support needs to be strong but porous enough to
allow the fast transport of reactant and product (water vapour, carbon dioxide, etc.)
between the gas phase and electrode/electrolyte interface.
1.7 Objective of this work
Since the impregnation of active materials has the aforementioned advantages, it
would be quite promising if it can be used in a real fuel cell stack. Tests on button
cells are extensively reported, but the scale-up of the fuel cell fabrication using
impregnation has not been proven.
Electrolyte-supported fuel cells are fabricated by screen printing a porous YSZ
scaffold plus impregnation. In order to achieve an optimized microstructure of the
15
evolution during sintering process and the selection of raw materials for better
infiltrated electrodes. Image analyses and modeling were also performed to quantify
the porous structure.
Tape casting of supported thin electrolytes on porous structures is also carried out in
an attempt to enhance the performance of the large scale fuel cell. The techniques of
making flat porous structures are also developed for a simpler process and higher
17
2. 1 Ceramic processing techniques 2.1.1 Screen printing
Figure 6 Basics of screen printing process. Image is taken from reference 19.
Screen printing uses a quantity of ink or other viscous compound and deposits it in a
film of controlled pattern and thickness. In the case of screen printing this entails
squeezing ink through a gauze or mesh onto a surface beneath. Screen printing can
produce thin films in an efficient and reproducible manner, so it can be used to
produce thin electrode of SOFC. Figure 6 illustrates the working process of a screen
printing machine. The screen is placed over and just above the article to be printed so
that it is accurately aligned to deposit the printing layer in the desired position. The
gap between the substrate and screen is called printing gap (about 1-2 mm). The mesh
of the screen is brought into line contact in a short time with the article by the
squeegee as it is moved across the screen. Ink is pushed into the open area forming
the pattern and the surplus is removed by the edge of the squeegee. The mesh should
peel away from the surface immediately behind the squeegee, leaving all the ink that
was through the mesh deposited on the printing surface. The screen printing process
was performed using a computer-controlled machine (248 Dek Printing Machines
(Shenzhen) Co. LTD. China).
2.1.2 Tape casting
Tape casting has matured into a full-blown manufacturing technique for the formation
18
produced as a powder. It allows production of a wide variety of controlled
morphologies, from highly porous to fully dense microstructures, such as electrodes
and electrolytes. Green layers can be easily superimposed if one wants to co-sinter the
multilayer in a one-step operation20.
Figure 7 Schematic of a laboratory tape-casting setup
Organic additives are added to the powder to form the slurry. The slurry is then mixed
and ground mostly by ball-milling to ensure homogenization and destruction of
agglomerates. The slurry will be cast on a MylarTM paper to produce the green tape after the evaporation of solvent. The casting process is illustrated in Figure 7. The
different layers with solvent can then be cast on top of the others via dedicated
technical systems, which is called co-casting. The organics including solvent, binder
and plasticisers are used in this study to make a flexible green tape after the
evaporation of the solvent. To fabricate a scaffold with graded porosity, two different
ceramic contents are used to co-cast on top of the green tape of electrolyte, step by
step.
2.2 Electrochemical characterisation
2.2.1 Current-voltage performance measurement (IV)
The performance of the fuel cell is measured by IV curves and calculation of power
generation. An external circuit was connected to the electrical lead wires from the cell.
When no current is drawn from the cell, the potential that can be read by connecting a
voltmeter between the anode and cathode is the open circuit voltage (OCV). The OCV
usually is lower than the theoretical potential provided by the Nernst equation due to
the crossover of gas or the slow reaction process that impedes the equilibrium of
oxygen partial pressure. When a current is drawn from the cell, the potential is
reduced due to the irreversibilities occurring in the cell. For each point of the IV curve,
19
curves are plotted as a function of the current density (A cm-2), meaning that the current is divided by the cell active area.
2.2.2 Electrochemical spectroscopy (EIS)
There are different kinetic processes involved in SOFC electrochemical reactions. EIS
is a powerful technique that can provide information for separating these different
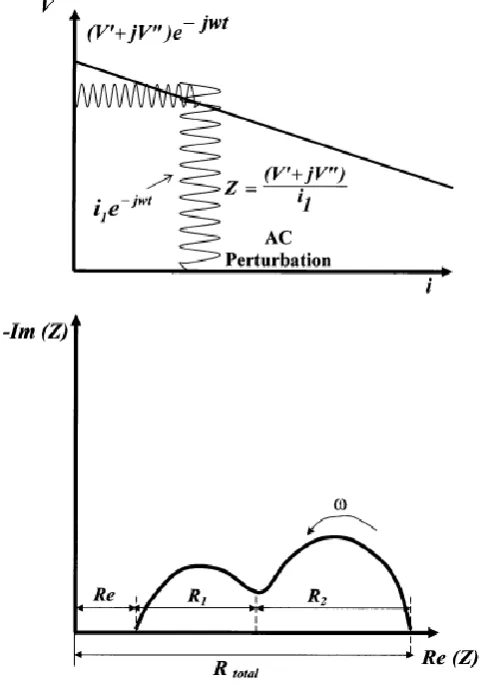
[image:34.595.115.364.235.582.2]processes. Essentially, this technique imposes a sinusoidal current perturbation, I (t), onto the working SOFC while monitoring the frequency-dependent, sinusoidal output.
Figure 8 Schematic of EIS principle (top) and typical Nyquist plot (bottom)
For time independent processes, such as one observes with simple resistors, ratio of
potential and current is a constant and the phase of the perturbation and the output are
the same. But processes involving chemical reactions, gas-phase diffusion, and charge
diffusion are time-dependent and exhibit a phase-shifted output. By varying the
frequency of the current perturbation, , the frequency-dependent impedance can be measured and presented as a Nyquist diagram. The principle and typical Nyquist plot
20
Ideally, impedance spectraon a Nyquist plot consist of semi-circles and arcs or
straight lines. The first real axis intercept at high frequency corresponds to the cell
ohmic resistance, which primarily comes from the fuel cell electrolyte. However, for
the fuel cell with thick electrode and ceramic anode, a large ohmic resistance from the
electrode is also possible. The intercept at the very low frequency corresponds to the
total resistance. Between these two intercepts are fuel-cell losses coming from the
electrodes. The characteristic frequency, identified from the peak point within each
arc, provides kinetic information.
The ac impedance measurement was carried out on a Solartron 1260 frequency
response analyzer (FRA) by applying a sine signal of 10 mV in the range from 10 kHz
to 0.04 Hz. In each frequency decade, more than five points were retrieved to give
21
2.2.3 Testing workstation
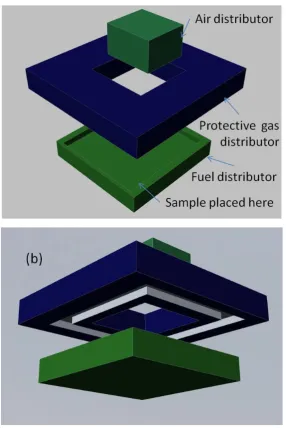
Figure 9 Schematics of the ECN jig. (a) shows the assembly of the ceramic components for holding the fuel cells; (b) is the bottom view to show the channels of the protective gas distributor. The current collectors on the fuel and air distributor are not shown.
Figure 9 shows the schematics of the ECN testing workstation whose core
components are made of alumina ceramics except the Pt current collector on the air
distributor or the nickel mesh on the fuel distributor. These three parts will be
assembled to provide sealing and current collection for the testing. The protective gas
distributor contains a channel on the marginal area of the cathode side as
[image:36.595.91.378.88.517.2]22
while the oxidant from the top. The gas from the cathode and anode side will mix in
the end on the way to leave the reaction chamber along with protective nitrogen gas.
Figure 10 Schematics of the Versa jig. The current collector is silver wool placed on both sides of the fuel cell.
The Versa jig (Figure 10) is made of nickel based superalloy and is much safer to be
used for the testing with methane. A porous alumina paper (Zircar Ceramics, Inc.) is
used to prevent the short-circuiting of the anode and cathode and also to provide the
cushion for a possible uneven fuel cell. Silver paste on the fuel cell is used for the
current collection and better contact can be provided by twisting the bolt to apply
force on the spring. Because the force controls the microstructure of the soft alumina
paper on the anode side, the diffusion of gas may be blocked by too much pressure on
the fuel cell.
Fuel tube
Air tube
Spring
23
2.3 Materials characterisation 2.3.1 X-Ray diffraction (XRD)
Figure 11 The Bragg equation derived by treating layers of atoms as reflecting planes: X-rays interfere constructively when the additional path length 2dsinis
equal to the wavelength .
Diffraction is the interference between waves that occurs as a result of an object in
their path. Diffraction of X-rays that have a wavelength in the range of 0.01 to 10
nanometers can be used to detect the repeated arrangement of atoms in a crystal. If we
think of two adjacent parallel planes in a crystal is separated by a distance d (Figure 11) then the incidental angle of the X-ray at which constructive interference between
waves of wavelength is given by the Bragg equation:
2dsin = 2-1
The intensity of the diffraction depends on the details of the crystal structure and the
identity of the atoms. How well an atom scatters X-ray is related to how many
electrons it possesses and its location in the unit cell. Thus measurement of diffraction
angles and intensities allow us to work backwards to structure information.
In this study, XRD is used to identify the phases produced in the solid state reaction
or impregnation. The reflective XRD pattern was recorded on a PANalytical X-ray
24
2.3.2 Scanning electron microscope (SEM)
Figure 12 Schematic of an SEM.
In an SEM, an electron beam is emitted from an electron gun fitted with a cathode.
The electron beam, which can have an energy ranging from 0.2 keV to 40 keV, is
focused by one or two condenser lenses to a spot about 0.4 nm to 5 nm in diameter as
shown in Figure 12. The beam passes through pairs of scanning coils in the electron
column, typically in the final lens, which deflect the beam in the x and y axes so that
it scans in a raster fashion over a rectangular area of the sample surface. Other than
the standard tungsten filament, electron emitters include lanthanum hexaboride (LaB6)
cathodes can be used if the vacuum system is upgraded. The field emission gun (FEG)
can produce high primary electron brightness and small spot size even at low
accelerating potentials in the range of 0.3- 4 kV.
When the primary electron beam interacts with the sample, the electrons lose energy
by repeated random scattering and absorption within the interaction volume (0.1- 5
m into the sample) that depends on the electron's landing energy, the atomic number
of the specimen and the specimen's density. The energy exchange between the
electron beam and the sample produces the reflection of high-energy electrons by
25
emission of electromagnetic radiation. All these emissions and the beam current
absorbed by the specimen can be detected in respective detectors to create images.
The emissions from the atoms at the top surface can be detected to give an image of
the surface and is called Secondary Electron Imaging (SEI). On the other hand the
re-emerged beam, which is sensitive to the mass of the atoms that scatter the incident
beam, can be used to create an image (called Back-Scattered Imaging, BSE) that is
efficient in distinguishing heavy atoms. Each pixel of computer video memory is
synchronized with the position of the beam on the specimen in the microscope, and
the resulting image is therefore a distribution map of the intensity of the signal being
emitted from the scanned area of the specimen.
The microstructure and composition of the electrodes is inspected by SEM on a JEOL
6700F FEG-SEM with an Energy-dispersive X-ray spectroscopy (EDS). Some of the
samples were mounted in an epoxy, and then cut, polished for back-scattering electron
imaging.
[image:40.595.93.506.385.650.2]2.3.3 Focused ion beam (FIB)
Figure 13 Principle of FIB
Focused ion beam (FIB), is a technique used particularly in the semiconductor
industry, materials science and increasingly in the biological field for site-specific
26
that is similar to a scanning electron microscope (SEM), except that an ion beam
rather than an electron beam is used as the incidental beam. In most commercially
available systems, Ga ions are used thanks to its low melting point (30 oC), low vapor pressure (1 Pa at 1310 K) and narrow energy distribution (concentration ratio of
Ga2+/G+ is about 10-4 at 10 m). The gallium (Ga+) primary ion beam hits the sample surface and sputters a small amount of material, which leaves the surface as either
secondary ions (i+ or i-) or neutral atoms (n0), as is shown in Figure 13. The primary beam also produces secondary electrons (e-). As the primary beam rasters on the sample surface, the signal from the sputtered ions or secondary electrons is collected
to form an image.
Since very little material is sputtered at low primary beam currents, the modern FIB
systems can easily achieve 5 nm imaging resolution (imaging resolution with Ga ions
is limited to ~5 nm by sputtering and detector efficiency). At higher primary currents,
a large quantity of material can be removed by sputtering, allowing precision milling
of the sample down to a sub micrometre scale. In this work, FIB is used to mill the
sample and then SEM is used to observe the morphology of the sample.
2.3.4 Particle size analysis (PSA) by laser
Laser diffraction is the most widely used technique for particle size analysis. In laser
diffraction particle size analysis, a representative cloud or ‘ensemble’ of particles
passes through a broadened beam of laser light that scatters the incident light onto a
Fourier lens. This lens focuses the scattered light onto a detector array and, using an
inversion algorithm, a particle size distribution is inferred from the collected
diffracted light data. Sizing particles using this technique depends upon accurate,
reproducible, high resolution light scatter measurements to ensure full characterisation
of the sample. The particle size analysis (PSA) of the two 8-YSZ powders is
performed on a Mastersizer 2000 particle size analyzer (Malvern Instruments LTD)
2.3.5 Dilatometery
A dilatometer is a scientific instrument that measures volume changes caused by a
physical or chemical process. To determine the thermal expansion and density change
of the material, the pellet of samples is analyzed with a high-temperature dilatometer
(Netzsch, DIL 402C) in a flowing air atmosphere. The measurement is conducted
27
2.3.6 Thermogravimetric analysis (TGA)
TGA is a type of testing performed on samples that determines changes in weight in
relation to a temperature program in a controlled atmosphere. TGA is commonly
employed in research to determine characteristics of materials such as polymers, to
determine degradation temperatures, absorbed moisture content of materials, the level
of inorganic and organic components in materials, and solvent residues. The TGA in
29
Chapter 3 A large area electrolyte-supported SOFC prepared by
ionic infiltration
3.1 Introduction
The conventional SOFC uses 8 mol % ytrria-stabilized zirconia (8YSZ) as electrolyte,
Ni(O)-YSZ cermet as anode and LSM-8YSZ composite as cathode. Heat treatment at
a temperature above 1100 oC is preferred to obtain a well-sintered electrolyte. However, the high sintering temperature may preclude the utilization of some
alternative conductors other than Ni(O) or LSM by causing a solid-state reaction with
8YSZ to form the insulating phases21 and/or the undesired growth of grain size of the active materials22. Therefore, an alternative method for fabrication is performed by impregnating the liquid precursors into the porous 8YSZ scaffold and then sintering at
low-temperature to form the oxide phase23 , 24 , 25 , 26. Studies have shown that La0.8Sr0.2FeO3 (LSF) from the impregnation of nitrate solution forms particles of less
than 100 nm diameters when sintered at 850 oC, while forms a dense layer on 8YSZ at 1100 oC 27,28,29. Since the electrochemical reactions of the electrodes involve ions, electrons and gas molecules in three distinct phases, the polarization loss from
electrode reaction may be minimized by carefully optimizing the triple-phase
boundary (TPB)30. The nano-particle-sized electrode is critical to high-performance SOFC operating in the intermediate temperature range between 500 and 800 oC2,31. Moreover, the impregnation of the functional materials into the well-sintered and
stablised 8YSZ porous scaffold on the dense 8YSZ electrolyte will also resolve the
mismatch in CTE values between the electrolyte and the functional materials due to
this non-random structure17,32. In addition, the percolation limit of the conductive materials will be lower than 30 vol.% in conventional electrode since they sit on the
surface of the 8YSZ grains17. For a system where more than one material is added to the porous scaffold, the contribution of an individual material can easily be examined
by investigating the effect on the performance and characteristic of the cell by the
sequential addition of the material 32. For instance, the addition of a catalyst (e.g. Pd, Ni and Fe) has been reported to decrease significantly the polarization loss of
La0.8Sr0.2Cr0.5Mn0.5O3 (LSCM) –8YSZ electrode without changing the ohmic loss33.
The development of impregnation as a method to fabricate high-performance
30
important to scale-up the impregnation process for the industrial feasibility. Even
though the impregnation of LSCF into the porous 8YSZ as cathode has been tested on
a large anode Ni(O)-8YSZ-supported fuel cell (81 cm2) 34, the high sintering temperature of the NiO-8YSZ support prevents the use of ceramic anode due to the
potential solid state reaction.
In this study, an electrolyte-supported fuel cell is prepared by impregnating on both
the anode and cathode sides, and the achieved performances of these cells are
compared to the reported results on the button cells with similar electrodes. In
addition, this study also investigates the performance of the large fuel cells with
respect to diffusion polarization at different fuel flow rates of humidified H2 or
oxygen partial pressures of oxidant.
3.2 Experimental
Figure 14 Images of the fuel cells before (a) and after (b) the impregnation of LSCM. The dimensions of the electrolyte and electrode are 50 x 50 x 0.2 mm and 40 x 40 x 0.04 mm, respectively.
Dense 8YSZ electrolytes in the dimension of 50 x 50 x 0.2 mm were purchased from
Kerafol Keramische Folien GmbH. Four layers of ink containing 8YSZ (UCM
Advanced Ceramics GmbH, Laufenburg, Germany) and pore forming agent (PFA)
(a)
[image:45.595.95.403.328.604.2]31
(graphite and glassy carbon) were screen-printed onto both sides of the electrolyte to
produce a 40 x 40 mm active area and then sintered at 1300 oC for 3 hours to form the porous scaffolds for impregnation, as shown in Figure 14(a). The porosity of scaffold
is determined to be ~ 62 vol. %. In order to determine the porosity, the weight of the
porous structure was calculated by deducting the weight of dense pellet from the total
weight of the sample and then the volume of porous structure, Vp, is determined using
the density of YSZ, 6.0 g cm-3. De-ionized water is impregnated into the porous structure to occupy the open pores and the volume of water, Vw, is calculated using
the density of 1 g cm-3. The open porosity, , is calculated with the formula
Vw/(Vw+Vp) 3-1
La(NO3)3•6H2O (Aldrich Chemistry, 99.99% ), Sr(NO3)2•9H2O (Aldrich, 99 + %),
Cr(NO3)3•9H2O (Sigma Aldrich, 99 %), Mn(NO3)2•xH2O (Alfa Aesar, 99.98 %, x is
assumed to be 6) and citric acid (Fisher Scientific, 99.5%, one mole per mole cations)
were used to prepare the 1 M (total concentration of metallic ions) aqueous solution
for La0.8Sr0.2Cr0.5Mn0.5O3. The promising ceramic anode, La0.8Sr0.2Cr0.5Mn0.5O3, was
chosen because it has successfully demonstrated excellent redox stability under both
cathode and anode condition35. The solution was impregnated into the porous structure then heated up to 450 oC to decompose the nitrate. About 20 impregnation cycles were repeated to reach a desired loading of 45 wt.% LSCM and then sintered
at 1200 oC for 4 h to form the pure oxide phase, as demonstrated in reference 33. The perovskite material for the cathode, La0.8Sr0.2FeO3, was impregnated using also 1 M
(total concentration of metallic ions) solution from La(NO3)2•6H2O (Aldrich
Chemistry, 99.99% ), Sr(NO3)2(Aldrich, 99 + %), Fe(NO3)3•9H2O (Fisher Scientific,
Analytical agent grade) and citric acid. Multiple cycles were infiltrated into the
cathode to obtain a final LSF loading of 35 wt. %. Finally, it was fired at 850 oC for 4 h to form the pure oxide phase. XRD was used to verify the phases of the perovskite
materials. For the fuel cell impregnated with 10 wt.% CeO2 and 1 wt.% Pd, the
nitrate solution was used sequentially to infiltrate into the LSCM-8YSZ anode and
then heat treated at 500 oC to completely decompose the nitrate. Pt paste (Gwent, C2000904P3) was painted on the whole surface of both electrodes and then sintered at
850 oC for 30 min.
The fuel cell was loaded into the ECN jig and heated up to the testing temperature at a
32
the active area to provide sealing and to prevent any leaking H2 from the anode to mix
with any outflow oxygen from the cathode. Pt meshes of size 3.5 x 3.5 cm were used
as current collector. On one side of the Pt meshes, a thick Pt wire was used to conduct
the current while a thin one to measure the voltage. The pure H2 was saturated with
4.2 vol. % of H2O by following the fuel through a 30 oC humidifier before entering
the anode chamber. In order to investigate the effect of the fuel flow rate on the
performance of the cell, tests were carried out at different flow rate between 100 ml
min-1 and 500 ml min-1 on the anode side while keeping a constant 500 ml min-1 flow of air on the cathode side. For the impedance spectroscopy, a sine ac perturbation of
10 mV was applied to the cell at the frequency ranging from 104 to 0.05 Hz using a Solartron 1260 frequency response analyser (FRA). The IV curve was retrieved by a
Kikusui Electronic Load and the area of Pt mesh was used to calculate the current
density. The microstructure of the electrodes was observed using the JEOL 6700F
scanning electron microscope (SEM). Some of the samples were mounted in the
33
3.3 Results and discussion
[image:48.595.93.414.110.637.2]3.3.1 Overview of the arrangement of electrolyte supported fuel cell
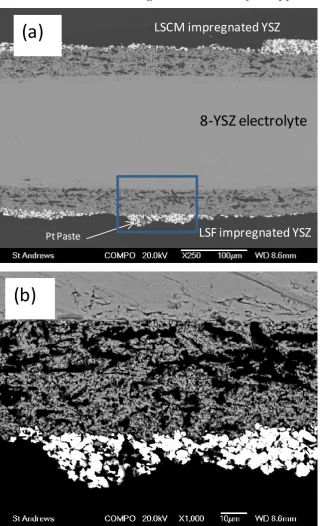
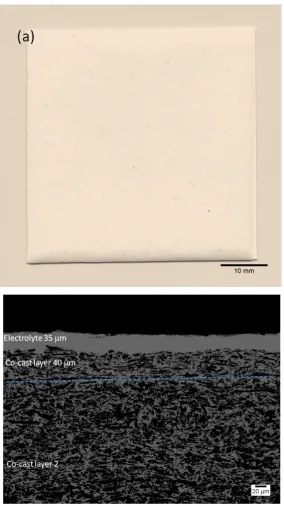
Figure 15 Back-scattering-electron (BSE) images of the 200-m 8YSZ electrolyte-supported fuel cell impregnated with LSCM and LSF. (a) is the general view and (b) the enlarged area of the rectangle in (a).
LSCM impregnated YSZ
LSF impregnated YSZ
8-YSZ electrolyte
Pt Paste
(a)
34
Screen-printing is a scalable and effective method in producing thin films on rigid
substrates. It can be used as an industrial process for the mass production of the
scaffold. The back-scattering electron image of the cross-section of LSF- and LSCM-
impregnated porous electrodes is shown in Figure 15. The image shows a dense
electrolyte with a thickness of 200-m. The 40-m thick porous scaffold support has
particles less than 10 m that form interconnected large pores as well as small ones. The porous electrode after the impregnation of perovskites still maintains good
adhesion with the electrolyte as shown in Figure 15(b). The porous Pt paste on the
surface is less than 20 m (shown in Figure 15) to assist the current collection, while allowing the transport of gas. The catalytic effect of Pt on the electrode may be a
concern, but this Pt paste has been specially designed purely for current collection and