Prediction of Construction Project Performance
using Regression Analysis and Artificial Neural
Network
Anupama S1 1
M.E in Construction Engineering and Management, Department of Civil Engineering, R V S Technical Campus Coimbatore-641402, India
Abstract: Assessing project management (or mismanagement) has become an important part of our professional challenge in construction industry today. The unexpected cost overruns and implementation delays result cost overruns and schedule delays of the construction projects and it gives a new meaning to the word performance for project management.Project performance is predicted mainly based on the four performance metrics i.e., cost, schedule, quality, and satisfaction performance. The objective of this research is to develop regression models and neural network models to predict cost performance, schedule performance, quality performance and satisfaction level. Multiple Linear Regression (MLR) and Artificial Neural Network (ANN) technique are used to construct the models to predict project performance, and these models are then compared and validated. This helps to understand the factors that must monitor closely in order for the project success and to forecast performance during the course of the project.
Keywords: Construction Project performance, regression, artificial neural Network, SPSS, MATLAB
I. INTRODUCTION
Forecasting project performance is one of the most demanding tasks in predicting whether the project will be successful. The effective performance of construction project cannot be achieved without challenges and obstacles. This research In most of the construction projects in Kerala, the estimation of cost and schedule is based on a guess work or rough estimate rather than proper calculated effort. Quality performance and satisfaction are often neglected in construction industry. These results in cost and time overrun in construction projects. Multi Linear Regression (MLR) and Artificial Neural Network (ANN) will help the estimator to predict the cost performance, schedule performance, quality performance and overall satisfaction level of the construction projects as MLR and ANN are technique where previous data is used to develop a model using training.
Current research enables practitioners to estimate cost performance, schedule performance, quality performance and overall satisfaction level even before the construction stage. In addition, it provides researchers with the methodology of designing regression models and models for construction project performance, its limitations, and future suggestions. This study is important because project team members will know the important variables that they must pay closer attention to, in order that their construction projects can be completed within budget and schedule, to acceptable level of quality, and to achieve satisfaction.This research introduces the project performance in terms of four performance metrics i.e., cost, schedule, quality, and satisfaction level.
II. OBJECTIVES
A. To identify and group particular factors (variables) which are significantly related to cost, schedule, quality and client satisfaction performance.
B. To design the project performance models for cost performance, schedule performance, quality performance and satisfaction level using softwares i.e. regression model (SPSS 16) and ANN model (MATLAB-2015b) .
C. To validate the models and compare the results to select appropriate models for predicting project performance.
III. RESEARCH METHODOLOGY
Table 1 Input factors for cost performance model Sl. No Factor
reference
Factor
1 X1 Gross floor area of the project 2 X2 Presence of special issues
3 X3 Adequacy of contractor’s plant and equipment 4 X4 Contractor’s ability in financial management
5 X5 Contractor’s technical expertise 6 X6 Availability of trained resources
7 X7 Favorable working conditions
8 X9 Type of building
9 X11 Contractor’s track record for completion on time 10 X13 Contractor’s track record for completion to acceptable quality
11 X14 Contractor’s staffing level
12 X15 Level of specialization required of contractors
13 X16 Subcontractors’ experience and capability
14 X20 Contractor’s track record for completion on budget 15 X21 Design completion when budget is fixed
[image:2.612.93.520.431.728.2]16 X26 Level of design complexity 17 X28 Climatic conditions at site 18 X37 Level of construction complexity
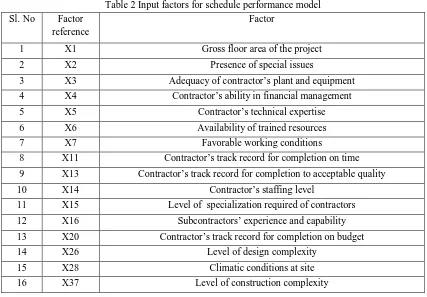
Table 2 Input factors for schedule performance model Sl. No Factor
reference
Factor
1 X1 Gross floor area of the project 2 X2 Presence of special issues
3 X3 Adequacy of contractor’s plant and equipment 4 X4 Contractor’s ability in financial management 5 X5 Contractor’s technical expertise 6 X6 Availability of trained resources 7 X7 Favorable working conditions
8 X11 Contractor’s track record for completion on time 9 X13 Contractor’s track record for completion to acceptable quality 10 X14 Contractor’s staffing level
11 X15 Level of specialization required of contractors 12 X16 Subcontractors’ experience and capability 13 X20 Contractor’s track record for completion on budget 14 X26 Level of design complexity
Table 3 Input factors for quality performance model Sl. No Factor
reference
Factor
1 X1 Gross floor area of the project 2 X2 Presence of special issues
3 X3 Adequacy of contractor’s plant and equipment 4 X4 Contractor’s ability in financial management 5 X5 Contractor’s technical expertise 6 X6 Availability of trained resources 7 X7 Favorable working conditions
8 X9 Type of building
9 X11 Contractor’s track record for completion on time 10 X13 Contractor’s track record for completion to acceptable quality 11 X14 Contractor’s staffing level
12 X15 Level of specialization required of contractors 13 X16 Subcontractors’ experience and capability 14 X20 Contractor’s track record for completion on budget 15 X26 Level of design complexity
16 X28 Climatic conditions at site 17 X37 Level of construction complexity
Table 4 Input factors for satisfaction level model Sl. No Factor
reference
Factor
1 X1 Gross floor area of the project
2 X2 Presence of special issues
3 X3 Adequacy of contractor’s plant and equipment
4 X4 Contractor’s ability in financial management
5 X5 Contractor’s technical expertise
6 X6 Availability of trained resources 7 X7 Favorable working conditions
8 X11 Contractor’s track record for completion on time
9 X13 Contractor’s track record for completion to acceptable quality
10 X14 Contractor’s staffing level
11 X15 Level of specialization required of contractors
12 X16 Subcontractors’ experience and capability
13 X20 Contractor’s track record for completion on budget
14 X26 Level of design complexity
15 X28 Climatic conditions at site
16 X37 Level of construction complexity
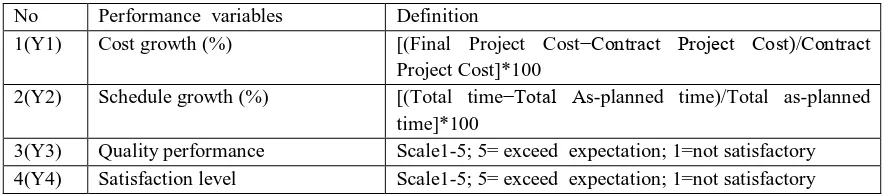
Table 5. Performance Variables No Performance variables Definition
1(Y1) Cost growth (%) [(Final Project Cost−Contract Project Cost)/Contract Project Cost]*100
2(Y2) Schedule growth (%) [(Total time−Total As-planned time)/Total as-planned time]*100
3(Y3) Quality performance Scale1-5; 5= exceed expectation; 1=not satisfactory 4(Y4) Satisfaction level Scale1-5; 5= exceed expectation; 1=not satisfactory
A. Regression model development
Regression models, a subset of linear models, are the most important statistical analysis tool. In order to examine how the obtained linear regression equation represents the data, two sets of parameters, R and R² are calculated. Firstly, the linear correlation coefficient, R, measures the strength and the direction of a linear relationship between two variables. The value of R ranges between -1 and +1.R value close to +1 indicates that two variables have strong positive linear correlation. The value of R² lies between 0 and 1. Regression models can be linear or nonlinear, which represent a relation between dependent variables and independent variables. For simple linear regression, only two variables, independent and dependent variables, the fitted linear equation is written as Y = a + bX .The coefficient of determination, R², is a statistic that is widely used to determine how well a regression fits the data. R² explains how much of the variability in the dependent variable can be explained by the fact that they are related to the independent variable.The SPSS Software has been used to build all the regression models
B. Artificial Neural Nertwork (ANN)model development
MATLAB is used to develop a neural network that will create the proposed model. Artificial Neural Networks is use as a modelling tool that can enhance current automation efforts in the construction industry. The structure of the neural network model includes an input layer that receive input, hidden layers that serve the purpose of creating an internal representation of the problem, and an output layer, or the solution of the problem. Before solving a problem, neural networks must be ‘‘trained’’. Networks are trained as they examine a smaller portion of the dataset just as they would a normal-sized dataset. Through this training, a network understands the relationships among the variables and establishes the weights between the nodes. Once this learning occurs, a new case can be entered into the network resulting in solutions that offer more accurate prediction or classification of the case. In this study separate MATLAB Based NEURAL NETWORK models are developed for predicting cost performance, schedule performance, quality performance and satisfaction level. Out of forty significant factors considered a set of important factors were identified which effect each performance metrics using Spearman’s correlation as explained earlier. These identified set are used as input data and are imported and can load datasets.
C. Comparison of Regression and ANN Models
The model was validated by comparing the cost growth,Schedule growth,quality and satisafaction level obtained from the model and that occurred for the construction project. Five new project data sets were collected, and used to validate the constructed models. The predicted results were then compared with actual results.
Generally, the aim of this analysis was to come up with the comparable models results obtained based on artificial neural networks and regression analysis. The relative measure of accuracy are used to compare the results. Percentage error(PE), Mean Square Error(MSE), Root Mean Square Error(RMSE),Mean Absolute Percentage Error( MAPE) values of both regression and ANN are compared for the same data. Lower these error better the prediction accuracy.
( ) = (( − ) ÷ ) × 100
eanSquareError(MSE) = ((Actual value -Predicted value)2 ) ÷ n
Root Mean Square Error (RMSE)=√MSE
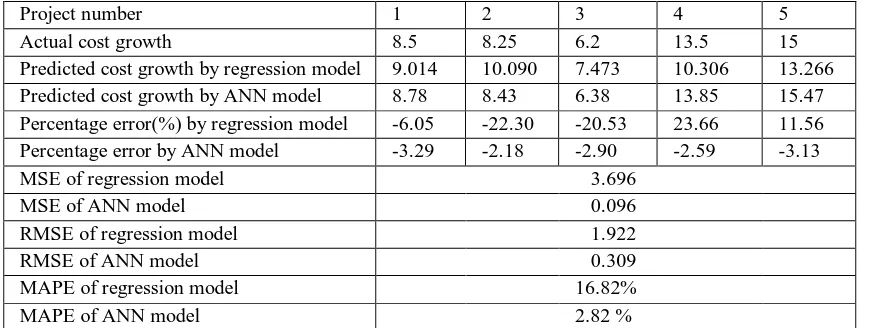
Table 6.Comparison of cost performance models
Project number 1 2 3 4 5
Actual cost growth 8.5 8.25 6.2 13.5 15 Predicted cost growth by regression model 9.014 10.090 7.473 10.306 13.266 Predicted cost growth by ANN model 8.78 8.43 6.38 13.85 15.47 Percentage error(%) by regression model -6.05 -22.30 -20.53 23.66 11.56 Percentage error by ANN model -3.29 -2.18 -2.90 -2.59 -3.13
MSE of regression model 3.696
MSE of ANN model 0.096
RMSE of regression model 1.922
RMSE of ANN model 0.309
MAPE of regression model 16.82%
MAPE of ANN model 2.82 %
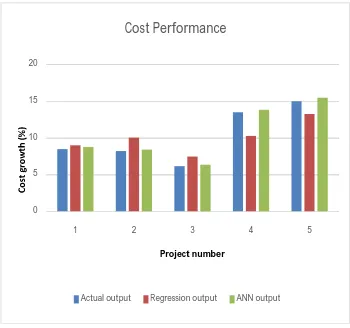
Cost growth predicted by regression has more deviation from the actual cost growth than the ANN models. Error values of ANN is also very low compared to regressionmodel. Cost growth model can be thus better predicted with ANN model. NSimilarly schedule performance, quality performance and satisfaction level models are also compared as follows.
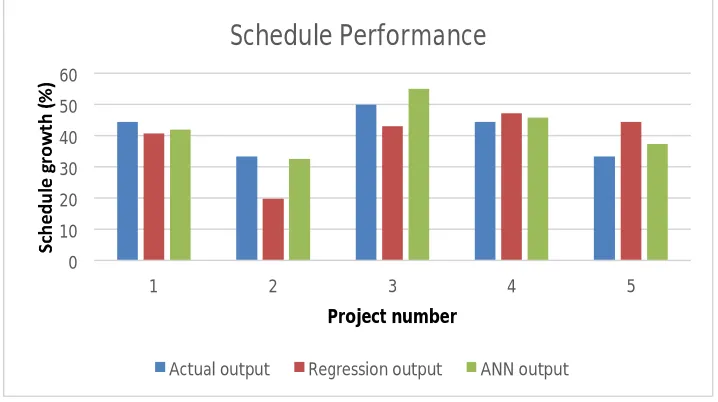
Table 7 Comparison of schedule performance models
Project number 1 2 3 4 5
Actual schedule growth 44.44 33.33 50 44.44 33.33 Predicted schedule growth by regression
model 40.747 19.827 43.115 47.096 44.475 Predicted schedule growth by ANN model 41.896 32.52 55.025 45.901 37.28
Percentage error(%) by regression model 8.31 40.51 13.77 -5.98 -33.44
Percentage error by ANN model 5.72 2.43 -10.05 -3.29 -11.85
MSE of regression model 74.93
MSE of ANN model 10.02
RMSE of regression model 8.66
RMSE of ANN model 3.17
MAPE of regression model 20.40%
MAPE of ANN model 6.67 %
Table 8 Comparison of quality performance models
Project number 1 2 3 4 5
Actual quality performance 4 3 4 4 4 Predicted quality performance by
regression model 2.88 3.58 2.79 2.67 2.61 Predicted quality performance by ANN
model 4.5 3.4 4.3 4.1 3.7
Percentage error(%) by regression model 27.92 -19.48 30.25 33.18 34.71
Percentage error by ANN model -12.50 -13.33 -7.50 -2.50 7.50
MSE of regression model 1.35
MSE of ANN model 0.12
RMSE of regression model 1.16
RMSE of ANN model 0.35
MAPE of regression model 29.11%
Table 9 Comparison of satisfaction level models
Project number 1 2 3 4 5
Actual satisfaction level 4 3 3 3 4
Predicted satisfaction level by regression
model 2.19 1.45 2.11 1.72 1.29
Predicted satisfaction level by ANN model
4.23 2.99 3.38 2.73 3.8
Percentage error by regression model 45.22 51.67 29.70 42.52 67.83
Percentage error by ANN model -5.75 0.33 -12.67 9.00 5.00
MSE of regression model 3.09
MSE of ANN model 0.06
RMSE of regression model 1.76 RMSE of ANN model 0.25
MAPE of regression model 47.39% MAPE of ANN model 6.55%
Percentage error obtained from all regression models are high compared to ANN models. Actual performance is more close to the performance predicted by ANN models than the regression models. MSE, RMSE, MAPE are the relative measures of accuracy. They are also very low compared to regression models.
Figure 1. Cost performance by ANN model and regression model
0
5 10 15 20
1 2 3 4 5
Project number
Cost Performance
[image:6.612.129.479.382.710.2]Figure 2. Schedule performance by ANN model and regression model
Figure 3. Quality performance by ANN model and regression model
0
10 20 30 40 50 60
1 2 3 4 5
Project number
Schedule Performance
Actual output Regression output ANN output
0
1 2 3 4 5
1 2 3 4 5
Project number
Quality Performance
Actual output Regression output ANN output
0
0.5 1 1.5 2 2.5 3 3.5 4 4.5
1 2 3 4 5
Project number
Satisfaction Level
[image:7.612.124.488.559.707.2]From the analysis of the results obtained from ANN models and regression models we can conclude that the ANN models fit the construction project performance models value more than the regression models.
IV. CONCLUSION
The aim of this research was to identify the most important factors affecting construction project performance. The factors were identified through literature survey and 40 significant factors were selected for second round data collection. After the correlation analysis factors which have high degree of correlation with performance metrics are selected for developing regression and artificial neural network models that would predict the cost growth, schedule growth, quality performance, quality performance and satisfaction level. Regression is the method of statistical calculation to predict a value in terms of the past information. Regression analysis performed in this attempt developed based on the historical data. Regression models were developed with the help of SPSS. Artificial Neural Network is a machine learning technique suitable for complex cases requiring large number of parameters to be considered in parallel. Models were developed with the help of MATLAB. The models were trained and tested using the data collected from different projects. At the current state of building construction in the region, ANN is most suitable for predicting the construction project performance.
REFERENCES
[1] Adnan Enshassi, Sherif Mohamed and Saleh Abushaban (2009), Factors Affecting the Performance of Construction Projects in The Gaza Strip, J. Constr. Eng. Manage., 15(3), 269-280
[2] Aftab Hameed Memon, Ismail Abdul Rahman and Ade Asmi Abdul Azis (2012), Time and Cost Perfomance in Costruction Projects in Southern and Central Regions of Penisular Malaysia, International Journal of Advances in Applied Sciences, 1(1), 45-52
[3] Albert P. C. Chan, David Scott and Edmond W.M. Lam (2002), Framework of Success Criteria for Design Build Projects, J. Manage. Eng., 18(3), 120-128 [4] Albert P. C. Chan, C. M. Tam and Danny C. K. Ho (2001), Design and Build Project Success Factors: Multivariate Analysis, J. Constr. Eng. Manage., 127(2),
93-100
[5] Al-Tabtabai, H.M (1996), Modelling Knowledge and Experience to Predict Project Performance, Project Management Institute 27th Annual Seminar/Symposium, Boston, Massachusetts, 95-9
[6] Ann T.W. Yu, John Kelly, Kirsty Hunter and QipingShen (2007), An Empirical Study of The Variables Affecting Construction Project Briefing/Architectural Programming, International Journal of Project Management, 25(2) , 198–212
[7] Ashraf M. Elazouni, Amal E. Ali, and Refaat H. Abdel-Razek (2005), Estimating the Acceptability of New Formwork Systems Using Neural Networks, J. Constr. Eng. Manage., 131(1), 33-41
[8] Chien-Ho Ko and Min-Yuan (2007), Dynamic Prediction of Project Success Using Artificial Intelligence, J. Constr. Eng. Manage., 133(4), 316-324
[9] David Riley, LipikaSwarup, and SinemKorkmaz, A.M (2011), Project Delivery Metrics for Sustainable, High-Performance Buildings, J. Constr. Eng. Manage., 137(12), 1043-1051
[10] Dissanayaka S.M. and Kumaraswamy M.M. (1999), Evaluation of Factors Affecting Time and Cost Performance in Hong Kong Building Projects, Eng. Constr. Archit. Manage.,6(3), 287–298
[11] D. K. H. Chua , Y. C. Kog, and P. K. Loh (1999), Critical Success Factors for Different Project Objectives, J. Constr. Eng. Manage.,125(3), 142-150 [12] Dr. K. Subramanian and S. Shanmugapriya (2013), Investigation of Significant Factors Influencing Time and Cost Overruns in Indian Construction Projects,
International Journal of Emerging Technology and Advanced Engineering , 3(10), 734-740
[13] Emsley M. W., Lowe D. J., Roy Duff A., Harding A., and Hickson A. (2002), Data Modelling and The Application of A Neural Network Approach to The Prediction of Total Construction Cost, Constr. Manage. Econ., 20(6), 465–472
[14] Florence Yean Yng Ling, Sui Pheng Low, ShouQing Wang, and TemitopeEgbelakin (2008), Models for Predicting Project Performance in China Using Project Management Practices Adopted by Foreign AEC Firms, J. Constr. Eng. Manage., 134(12) ,983-990