prognostic values of HCC based on gene
expression microarray
Ding Li
1*, Fu-Biao Ni
1*, Heng-Jie Tang
1, Chong-Chu Huang
1, Cheng-Yang Liu
2, Ji-Cai Chen
11Department of General Surgery, The First Affiliated Hospital of Wenzhou Medical University, Wenzhou, Zhejiang,
China; 2Department of Surgery, School of Medicine, University of Pennsylvania, Philadelphia, PA, USA. *Equal
con-tributors.
Received March 6, 2019; Accepted May 13, 2019; Epub August 15, 2019; Published August 30, 2019
Abstract: Liver cancer is a common malignant neoplasm worldwide, causing high morbidity and mortality globally. The molecular mechanisms of hepatocarcinogenesis remains unclear. The goal of our study is to elucidate the mechanism which could improve the prognosis of liver cancer. GSE121248 was downloaded from the GEO
data-base, which is a gene expression profile data including 70 tumor samples and 37 adjacent normal samples from he -patocellular carcinoma (HCC). The differentially expressed genes (DEGs) between cancer tissues and normal tissues were screened. Subsequently, the enriched GO terms, KEGG pathways and Database for Annotation, Visualization and Integrated Discovery (DAVID) were analyzed by on-line tools. Finally, STRING database and Cytoscape software were used to construct protein-protein interactions (PPI) network and genes with high degree. Kaplan-Meier plotter (KM plotter) was used to explore the predictive prognostic value of gene expression to overall survival (OS). The re-sults showed that there were 202 DEGs between the case samples and control samples, including 59 up-regulated genes and 143 down-regulated genes in HCC tissue samples. The study obtained a total of 132 enriched GO terms and 16 KEGG pathways, such as extracellular region, organelle membrane, extracellular space, epoxygenase P450 pathway, retinol metabolism, metabolic pathways, caffeine metabolism, tryptophan metabolism and drug metabo-lism-cytochrome P450. PPI suggests that BUB1B, CCNB1, EZH2, NUSAP1 and CDC20 were the top 5 core genes. The patients with high expression of 5 core genes had poor OS according to online database. Using comprehensive
bioinformatics analyses, our study attempts to identify DEGs and find potential biomarkers to predict the occurrence
and development of HCC.
Keywords: Molecular mechanism, biomarkers, prognostic values, HCC, gene expression microarray
Background
Primary liver cancer (namely hepatocellular
car-cinoma, HCC) is one of the fifth most common
cancer which takes up the third top cause of
cancer mortality [1]. In 2016, it afflicted in ex-
cess of 1 million people and caused 800,000
deaths globally [2]. HCC has interesting
epide-miologic features and a couple of
well-substan-tiated environmental potentially preventable
risk factors have been confirmed for the
dis-ease [3]. Despite active research [1, 4, 5], the
molecular mechanisms that induce HCC remain
unclear.
Gene expression profiles measure the
expres-sion of thousands of genes to build a global
pic-ture of cell function. Gene expression profiling
may become an important diagnostic test [6,
7]. Such new technique may have positive
influ-ence in improving our knowledge of
carcinogen-esis and facilitate screening and early
detec-tion of diseases.
10423
Int J Clin Exp Med 2019;12(8):10422-10432
Materials and methods
Gene expression microarray data
In this research, the gene expression
microar-ray data set GSE121248 was downloaded from
GEO database (GEO, http://www.ncbi.nlm.nih.
gov/geo/), including 70 tumor samples from
HCC patient and 37 adjacent normal samples
[8]. We used k-nearest neighbors algorithm
(k-NN) for classification and regression in
pat-tern recognition [9]. In addition, a supplement
work was conducted for other genes with
simi-lar expression profiles as those with deletion
value.
Differentially expressed genes (DEGs)
In the preprocessing section, the unwanted no-
ise of the original microarray data was screened
out. The original data and background
correc-tion were dealt with by the Affy [10] package in
R. The
differentially
expressed mRNAs between
tumor tissue and normal tissue samples were
inspected using the Limma [11] package with
the following criteria: |Log2 (fold change)|>1.5
and false discovery rate <0.05. Morpheus is an
on-line tool used to deal with heatmap (https://
software.broadinstitute.org/morpheus).
Functional and pathway enrichment analysis
The gene product function is supplied from The
Gene Ontology website [12] (GO, http://www.
genneontology.org), a community-based bio
informatics resource using ontologies to
repre-sent ontologies to reprerepre-sent biological
knowl-edge. GO provides a framework and a suit of
concepts for describing the functions of gene
products from all living organisms. KEGG (Kyoto
Encyclopedia of Genes and Genomes, http://
www.kegg.jp/ or http://www.genome.jp/kegg)
is used for interpretation of high-throughput
data and other biological genome sequences
[13]. DAVID [14] (https://david.ncifcrf.gov) is al-
so a bioinformatic resources, consisted of
ana-lytic tools and biological knowledge base, ai-
med at organically extracting biological activity
from huge gene protein statement. GO terms
and KEGG pathway analyses were accompli-
shed with DAVID to recognize DEGs. P<0.05
was executed as the cut-off value.
Protein-protein interactions (PPI) network con
-struction and analysis of modules
The STRING database (http://string-db.org) is a
web resource aimed to predict protein-protein
interactions and provide critical assessment,
which includes physical and functional
associa-tions [15]. Cytoscape [16] is an open-source
software platform for visualizing biomedical
networks exploration and offering researchers
utility and coactive visualization interface. The
tools is used for exploring interconnections of
complex biological networks supported by
vary-ing annotation and experimental results,
there-fore accelerating research works such as there-
fore-casting gene function and reconstructing
path-ways. The STRING was used to evaluate PPI
network mapped DEGs and Cytoscape for
visu-alization. The combined score of greater than
0.15 was executed as the cut-off value. Finally
the cut-off criterion for screening hub gene was
defined as node degree 10.
Exploring overall survival
‘Kaplan-Meier plotter’ (KM plotter), online
data-base, was used to explore the predictive
prog-nostic value of gene expression to overall
sur-vival (OS) in different clinical data, such as
clini-cal grades, cliniclini-cal stages, gender and race in
liver cancer patients.
Statistical analysis
Matrix data were analyzed by one-way ANOVA,
and statistical significance was determined as
p<0.05. The results were compared between
normal and tumor groups with Mann-Whitney
Rank Sum Test.
Results
Differentially expresses gene (DEGs)
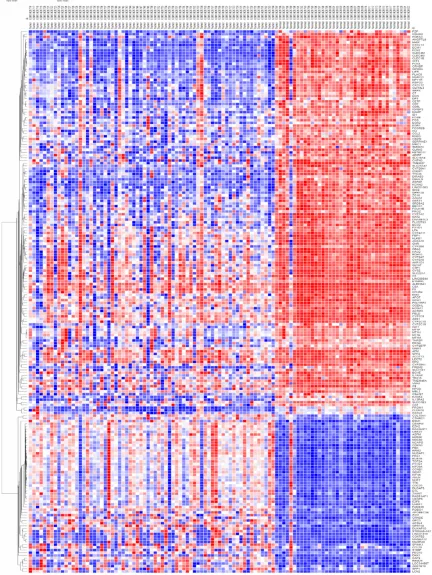
There were 202 DEGs between tumor samples
and control samples. Comparing with adjunct
tissue samples, 59 up-regulated and 143 do-
wn-regulated genes were selected in case
tis-sue samples. The heatmap of the DEGs was
shown in
Figure 1
.
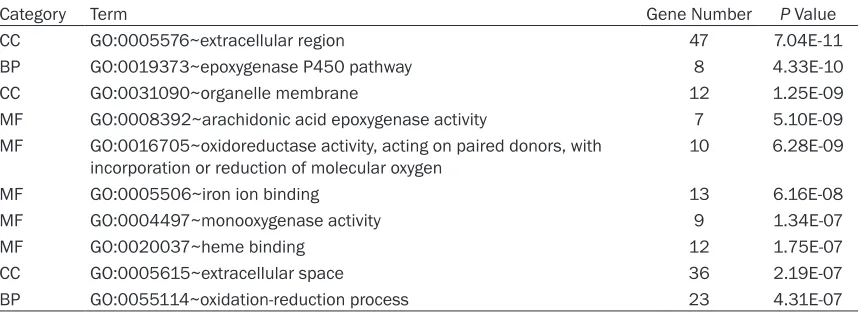
GO enrichment terms and KEGG pathway
analysis
The study obtained totally of 132 GO
enrich-ment terms and 16 KEGG pathways. The first
10 GO enrichment terms of the DEGs following
biological process (BP). Arachidonic acid
epoxy-genase activity, oxidoreductase activity, iron
Figure 1. Heatmap of 202 DEGs. 70 tumor cases and 37 normal group had 202 DEGs, including 59 up-regulatedgenes and 143 down-regulated genes in HCC samples.
10425
Int J Clin Exp Med 2019;12(8):10422-10432
ion binding, monooxygenase activity and heme
binding composed the molecular function (MF)
of the cell.
[image:4.612.93.523.85.241.2]The KEGG pathways were demonstrated in
Table 2
. The top 10 KEGG enriched pathways
were mostly related to metabolism, such as
retinol metabolism, metabolic pathways,
caf-feine metabolism, tryptophan metabolism and
drug metabolism-cytochrome P450. Further-
more, the other pathways may also influence
on the progression of cancer via some
biologi-cal process, such as the complement and
coag-ulation cascades, Prion diseases, chemical
car-cinogenesis, p53 signaling pathway and
miner-al absorption.
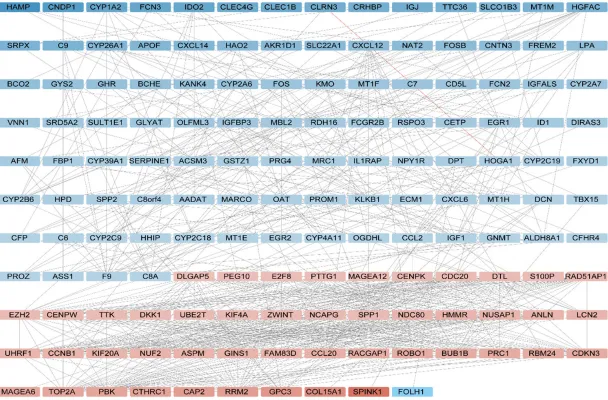
PPI network and core genes in network
The PPI (
Figure 2
) network included 190 nodes
(DEGs) and 756 edges (interactions) between
the DEGs. The core genes, had higher degree in
the PPI network, might had a stronger
correla-tion with liver cancer.
Table 3
has shown the
cores genes’ solid degree. Among those core
genes, CDC20 had 33 degrees and 21 gene’s
node degree were beyond 30.
Overall survival based on core genes
Firstly, the prognostic value of BUB1B was
accessed in the database. The RNA-seq ID is
701 for BUB1B. OS curves were plotted for all
liver cancer patients (n=364) (
Figure 3A
), BU-
B1B has related to poor OS in HCC patients,
HR=2.01 (1.42-2.86),
P
=6.6e-05. Next, the
prognostic significance of CCNB1 was
evaluat-ed in the database. The desirevaluat-ed RNA-seq ID is
891. CCNB1 revealed a remarkable correlation
with worse OS among liver cancer patients,
HR=2.34 (1.55-3.54),
P
=3.4e-05 (
Figure 3B
).
Similarly, EZH2 (RNA-seq ID 2146) exhibited a
Table 1.
Top 10 enriched GO terms are sorted in ascending order by
P
value
Category Term Gene Number P Value
CC GO:0005576~extracellular region 47 7.04E-11
BP GO:0019373~epoxygenase P450 pathway 8 4.33E-10
CC GO:0031090~organelle membrane 12 1.25E-09
MF GO:0008392~arachidonic acid epoxygenase activity 7 5.10E-09
MF GO:0016705~oxidoreductase activity, acting on paired donors, with
incorporation or reduction of molecular oxygen 10 6.28E-09
MF GO:0005506~iron ion binding 13 6.16E-08
MF GO:0004497~monooxygenase activity 9 1.34E-07
MF GO:0020037~heme binding 12 1.75E-07
CC GO:0005615~extracellular space 36 2.19E-07
[image:4.612.91.524.274.462.2]BP GO:0055114~oxidation-reduction process 23 4.31E-07
Table 2.
The top 10 KEGG pathways in DEGs
Category Pathway Name Gene Number P Value KEGG_PATHWAY hsa04610: Complement and coagulation cascades 8 3.84E-05 KEGG_PATHWAY hsa00830: Retinol metabolism 7 2.20E-04 KEGG_PATHWAY hsa05020: Prion diseases 5 1.11E-03 KEGG_PATHWAY hsa01100: Metabolic pathways 30 1.26E-03 KEGG_PATHWAY hsa00232: Caffeine metabolism 3 1.80E-03 KEGG_PATHWAY hsa00380: Tryptophan metabolism 5 2.05E-03 KEGG_PATHWAY hsa05204: Chemical carcinogenesis 6 4.59E-03 KEGG_PATHWAY hsa04115: p53 signaling pathway 5 1.30E-02 KEGG_PATHWAY hsa00982: Drug metabolism-cytochrome P450 5 1.37E-02
Figure 2. The PPI network of 190 nodes and 756 edges. The 47 red nodes had higher expression in the tumor samples; whereas the 103 blue nodes have lower
10427
Int J Clin Exp Med 2019;12(8):10422-10432
to screen 202 DEGs fr-
om HCC tissues and
nor-mal liver tissue,
includ-ing 59 up-regulated ge-
nes and 143
down-regu-lated genes in tumor
samples.
Enrichment GO analyses
identified significant on-
tology categories
includ-ing epoxygenase P450
pathway and
oxidation-reduction process. The
human liver microsome
metabolizes arachidonic
acid in NADPH and
pro-duces
epoxyeicosapen-taenoic acid and its
hydrated metabolite di-
hydroxyeicosapentaeno-ic acid as the main
reac-worse correlation with OS within liver cancer
patients, HR=2.23 (1.56-3.19),
P
=6.8e-06 (
Fi-
gure 3C
). The prognostic value of NUSAP1 was
also determined in the database, RNA-seq ID
51203. A strong association was identified
between NUSAP1 expression and poor OS for
liver cancer, HR=1.67 (1.17-2.4),
P
=0.0046
(
Figure 3D
).
Figure 3E
demonstrated the
prog-nostic value of CDC20 in the database. The
RNA-seq ID is 991. CDC20 was significantly
correlated with poor OS for liver cancer patients,
HR=2.49 (1.72-3.59),
P
=5.1e-07.
Discussion
HCC’s mortality has steadily increased in the
last few years. It is now the fifth most common
malignant tumor worldwide [17]. Hepatitis vi-
ruses, gene mutations, cell damage, alcoholic
liver diseases and aflatoxin poisoning have all
been identified as risk factors for HCC [18]. As
a potential diagnostic tool, tumor markers have
been widely used in the early diagnosis of HCC.
Alejandro Forner claimed that α-Fetoprotein
was a brilliant star for HCC diagnosis [19]. Mo-
reover, severe alpha-1-antitrypsin deficiency
(AATD) played a key role in the development of
liver disease [20]. However, further study on
the mechanism of hepatocellular carcinoma is
necessary for early diagnosis and optimal tr-
eatment.
In this work, a high-throughput method for ge-
nome-wide gene expression analysis was used
tion product [21]. These bioactive eicosanoids
play a role in maintaining homeostasis in the
liver. Under normal and pathophysiological
conditions, human P450 cyclooxygenase (also
known as CYP) and its derivatives arachido-
nic acid metabolites may be expressed
differ-ently, thus affecting regulation of vascular fu-
nction [22]. In one study, it was found that
CYP2C9 was highly expressed in patients with
esophageal adenocarcinoma (including pa-
tients with early tumor stage and highly
differ-entiated tumors). Additionally, selective
inhibi-tion of CYP2C9 was shown to reduce the
prolif-eration of low tumor cells in in vitro experiments
[23].
[image:6.612.92.398.84.306.2]KEGG pathway analyzed DEGs and 13
path-ways were screened out, such as retinol
olism, tryptophan metabolism and drug
metab-olism-cytochrome P450, complement and co-
agulation cascades. Previous studies have
cov-ered that majority of these pathways were
com-prised in cancer progression. In human cancer
cell lines of skin, oral cavity, kidney and breast,
retinol acyltransferase (LRAT) was reduced co-
mpared with the normal counterparts, thus
implicating aberrant retinoid metabolism in
car-cinogenesis [24]. Cytochrome P450 are
hepat-ic enzymes that may activate some
procarcino-gens. Studies have shown that CYPIA1
increas-es the risk of peripheral adenocarcinoma type
lung cancer [25]. And its polymorphism might
be an important factor in the optimal use of
selected anticancer drugs for cancer treatment
[26].
Table 3.
The cores genes and solid degree according to the PPI network
Gene symbol Node degree symbolGene degreeNode symbolGene degreeNode symbolGene degreeNode CYP26A1 10 C8A 15 CDKN3 30 ZWINT 31 CYP2B6 10 F9 16 HMMR 30 BUB1B 32 ALDH8A1 11 IGF1 16 KIF4A 30 CCNB1 32 C6 11 SPP1 17 PTTG1 30 EZH2 32 CYP1A2 11 GINS1 20 ASPM 31 NUSAP1 32 CYP2C9 11 CENPW 22 DLGAP5 31 CDC20 33 EGR1 11 E2F8 22 DTL 31
Figure 3. The prognostic HRs value of BUB1B, CCNB1, EZH2, NUSAP1 and CDC20 in liver can-cer in www.kmplot.com. (A: BUB1B, HR=2.01 (1.42-2.86), P=6.6e-05. B: CCNB1,HR=2.34 (1.55-3.54), P=3.4e-05. C: EZH2, HR=2.23 (1.56-3.19), P=6.8e-06. D: NUSAP1, HR=1.67 (1.17-2.4), P=0.0046. E: CDC20, HR=2.49
10429
Int J Clin Exp Med 2019;12(8):10422-10432
The complement system is responsible for
kill-ing bacteria that infect the host. The secretion
of proinflammatory mediators and ingestion of
opsonized particles were led by complement
activation [27]. On the other hand, coagulation
activation occurs through two pathways, one
exogenous and the other through an internal
(contact activation) pathway that seems to be
involved in inflammatory processes [28, 29]. In
the occurrence and progression of tumor,
tumor-promoting inflammation plays an
impor-tant role [30, 31]. The connection between
inflammation and cancer can be made both
externally and internally. The external pathway
increases the risk of inflammation driving
can-cer, while the internal pathway is driven by ge-
nes for inflammation and tumorigenesis [32].
In addition, PPI suggests that the top 5 core
genes were BUB1B, CCNB1, EZH2, NUSAP1
and CDC20, which might serve as potential
tar-gets for therapy. In normal cells, BUB1B (coding
BUBR1) has been shown to prevent duplication
of chromosome segregation, but its role has
been controversial in cancer pathogenesis.
BUB1B has overexpression in prostate cancer
[33], adenomatous polyposis coli [34], HCC
[35] and other cancer [36, 37], which is
consis-tent with our data; while low expression of
BUB1B contributes to embryonal
rhabdomyo-sarcoma [38], colorectal cancer [39] and other
cancers [40, 41]. CCNB1 (Cyclin B1), tumor an-
tigen, is overexpressed in many cancers [42].
The autoimmune response of CCNB1 in HCC
may include the aberration of CCNB1
regula-tion leading to changes in product or its
expres-sion resulting in immune stimulation [43]. Wu
suggest that CCNB1 may be a key target
pro-tein of human HCC cell line Lnc00312 [44].
Enhancer of zeste homolog 2 (EZH2) is a
his-tone-lysine N-methyltransferase enzyme, whi-
ch participates in histone methylation and
tran-scriptional repression [45]. In some reports,
inhibition of EZH2 function shrank malignant
tumors because the tumor suppressor genes
were not inhibited by EZH2 [46]. In HCC, EZH2
partially inhibits the immune response and
plays a carcinogenic role [47]. Nucleolar and
spindle-associated protein 1 (NUSAP1)
main-tains normal cellular division and participates
in regulating spindle assembly through
microtu-bule-binding and DNA-binding domains, which
is an important regulator of mitosis and cell
proliferation [48, 49]. Previous study indicated
that the expression of NUSAP1 at the margin of
liver cancer surgery was closely related to early
postoperative recurrence and can be used as
an index to predict early recurrence of HCC
[50]. As a cell cycle regulating kinase, CDC20,
an essential cell cycle regulator, is necessary to
complete mitosis. Some studies have reported
that CDC20 plays a key role in gastric cancer
[51] and HCC [52]. CDC20 may potentially be
used as a biomarker and therapeutic target in
HCC [53].
Finally, our results showed that high expression
of the top 5 core genes had worsening effect on
the prognosis of liver cancer patients. Zhuang
[54]
reported that BUB1B, CCNB1 and CDC20
could serve as predictive biomarkers for HCC,
and they demonstrated that high expression of
those genes was related to worse survival. As
for NUSAP1, it was a valuable prognostic factor
for hepatic carcinoma. Low NUSAP1 expression
patients had better survival rate then high
expression patients at both 6 months and 12
months (89.3% VS 33.3%, 53.6% VS 17.9%)
[55]. It was reported that precise anti-tumor
drugs can be developed because EZH2
pro-motes the occurrence and development of
tumors [56]. This has the potential to improve
survival in cancer patients.
Conclusion
Our study screened DEGs and identified
poten-tial biomarkers to forecast the occurrence and
development of HCC. A total of 202 DEGs were
screened including BUB1B, CCNB1, EZH2,
NUSAP1 and CDC20. The many functional
part-nerships and PPI are core of cellular processing
and their classified characterization helps to
deal with context in molecular system biology.
Survival analysis identified 5 core genes as
potential therapeutic targets in the
manage-ment of HCC. However, our study lacks in vivo
and in vitro validation. For future studies, the
results of these bioinformatics analyses can be
verified by experiments, such as Western Blot
and qRT-PCR.
Acknowledgements
None.
Address correspondence to: Ji-Cai Chen, Depart-
ment of General Surgery, The First Affiliated
Hospi-tal of Wenzhou Medical University, Wenzhou 325-
000, Zhejiang, China. Tel: 13777760321; E-mail:
References
[1] Parkin DM. Global cancer statistics in the year 2000. Lancet Oncol 2001; 2: 533-543. [2] Global Burden of Disease Cancer Collaboration,
Fitzmaurice C, Akinyemiju TF, Al Lami FH, Alam T, Alizadeh-Navaei R, Allen C, Alsharif U, Alvis-Guzman N, Amini E, Anderson BO, Aremu O, Artaman A, Asgedom SW, Assadi R, Atey TM, Avila-Burgos L, Awasthi A, Ba Saleem HO, Bar- ac A, Bennett JR, Bensenor IM, Bhakta N, Brenner H, Cahuana-Hurtado L, Castañeda-Orjuela CA, Catalá-López F, Choi JJ, Christopher DJ, Chung SC, Curado MP, Dandona L, Dan- dona R, das Neves J, Dey S, Dharmaratne SD, Doku DT, Driscoll TR, Dubey M, Ebrahimi H, Edessa D, El-Khatib Z, Endries AY, Fischer F, Force LM, Foreman KJ, Gebrehiwot SW, Go- palani SV, Grosso G, Gupta R, Gyawali B, Hamadeh RR, Hamidi S, Harvey J, Hassen HY, Hay RJ, Hay SI, Heibati B, Hiluf MK, Horita N, Hosgood HD, Ilesanmi OS, Innos K, Islami F, Jakovljevic MB, Johnson SC, Jonas JB, Kasa- eian A, Kassa TD, Khader YS, Khan EA, Khan G, Khang YH, Khosravi MH, Khubchandani J, Kopec JA, Kumar GA, Kutz M, Lad DP, Lafran- coni A, Lan Q, Legesse Y, Leigh J, Linn S, Lun- evicius R, Majeed A, Malekzadeh R, Malta DC, Mantovani LG, McMahon BJ, Meier T, Melaku Y, Melku M, Memiah P, Mendoza W, Meretoja TJ, Mezgebe HB, Miller TR, Mohammed S, Mo- kdad AH, Moosazadeh M, Moraga P, Mousavi SM, Nangia V, Nguyen CT, Nong VM, Ogbo FA, Olagunju AT, Pa M, Park EK, Patel T, Pereira DM, Pishgar F, Postma MJ, Pourmalek F, Qor- bani M, Rafay A, Rawaf S, Rawaf DL, Roshandel
G, Safiri S, Salimzadeh H, Sanabria JR, Santric
Milicevic MM, Sartorius B, Satpathy M, Se- panlou SG, Shackelford KA, Shaikh MA, Sharif-Alhoseini M, She J, Shin MJ, Shiue I, Shrime
MG, Sinke AH, Sisay M, Sligar A, Sufiyan MB,
Sykes BL, Tabarés-Seisdedos R, Tessema GA, Topor-Madry R, Tran TT, Tran BX, Ukwaja KN, Vlassov VV, Vollset SE, Weiderpass E, Williams HC, Yimer NB, Yonemoto N, Younis MZ, Murray CJL, Naghavi M. Global, regional, and national
1553-1568.
[3] Elserag HB. Hepatocellular carcinoma: epide-miology and molecular carcinogenesis. Gastro-
enterology 2007; 132: 2557-2576.
[4] Llovet JM, Brú C, Bruix J. Prognosis of
hepato-cellular carcinoma: the BCLC staging classifi -cation. Semin Liver Dis 1999; 19: 329-338. [5] Chon YE, Jung KS, Kim MJ, Choi JY, An C, Park
JY, Ahn SH, Kim BK, Kim SU, Park H, Hwang SK, Rim KS, Han KH, Kim DY. Predictors of fail-ure to detect early hepatocellular carcinoma in patients with chronic hepatitis B who received regular surveillance. Aliment Pharmacol Ther
2018; 47: 1201-1212.
[6] Cheung NY. Molecular targets in
gynaecologi-cal cancers. Pathology 2007; 39: 26-45. [7] Magic Z, Radulovic S, Brankovic-Magic M. cD-
NA microarrays: identification of gene signa -tures and their application in clinical practice.
J BUON 2007; 12: S39-44.
[8] Wang SM, Ooi LL, Hui KM. Identification and
validation of a novel gene signature associat-ed with the recurrence of human
hepatocellu-lar carcinoma. Clin Cancer Res 2007; 13: 6275-6283.
[9] Altman NS. An introduction to kernel and near-est-neighbor nonparametric regression. Am
Stat 1992; 46: 175-185.
[10] Gautier L, Cope L, Bolstad BM, Irizarry RA. affy--analysis of affymetrix genechip data at the
probe level. Bioinformatics 2004; 20:
307-315.
[11] Ritchie ME, Phipson B, Wu D, Hu Y, Law CW, Shi W, Smyth GK. limma powers differential ex-pression analyses for RNA-sequencing and mi-croarray studies. Nucleic Acids Res 2015; 43:
e47.
[12] Gene Ontology Consortium. Gene ontology co- nsortium: going forward. Nucleic Acids Res 2015; 43: D1049-1056.
[13] Kanehisa M, Sato Y, Kawashima M, Furumichi M, Tanabe M. KEGG as a reference resource for gene and protein annotation. Nucleic Acids
Res 2016; 44: D457-462.
[14] Huang da W, Sherman BT, Lempicki RA. Sys- tematic and integrative analysis of large gene lists using DAVID bioinformatics resources. Nat
Protoc 2009; 4: 44-57.
[15] Szklarczyk D, Franceschini A, Wyder S, For- slund K, Heller D, Huerta-Cepas J, Simonovic M, Roth A, Santos A, Tsafou KP, Kuhn M, Bork P, Jensen LJ, von Mering C. STRING v10: pro-tein-protein interaction networks, integrated over the tree of life. Nucleic Acids Res 2015;
10431
Int J Clin Exp Med 2019;12(8):10422-10432
[16] Su G, Morris JH, Demchak B, Bader GD. Bio- logical network exploration with cytoscape 3.
Curr Protoc Bioinformatics 2014; 47:
8.13.1-24.
[17] El-Serag HB, Rudolph KL. Hepatocellular carci-noma: epidemiology and molecular
carcino-genesis. Gastroenterology 2007; 132: 2557-2576.
[18] Turner PC, Sylla A, Diallo MS, Castegnaro JJ,
Hall AJ, Wild CP. The role of aflatoxins and hep -atitis viruses in the etiopathogenesis of hepa-tocellular carcinoma: a basis for primary pre-vention in Guinea-Conakry, West Africa. J Gas-
troenterol Hepatol 2002; 17: S441-8.
[19] Forner A, Reig M and Bruix J. α-fetoprotein for
hepatocellular carcinoma diagnosis: the de-mise of a brilliant star. Gastroenterology 2009;
137: 26-29.
[20] Tanash HA, Piitulainen E. Liver disease in ad-
ults with severe alpha-1-antitrypsin deficiency.
J Gastroenterol 2019; 54: 541-548.
[21] Zeldin DC, Moomaw CR, Jesse N, Tomer KB, Beetham J, Hammock BD and Wu S. Bioch- emical characterization of the human liver cy-tochrome P450 arachidonic acid epoxygenase pathway. Arch Biochem Biophys 1996; 330:
87.
[22] Martin S and Liao JK. Vascular protective ef-fects of cytochrome p450 epoxygenase-deri- ved eicosanoids. Arch Biochem Biophys 2005; 433: 413-420.
[23] Schmelzle M, Dizdar L, Matthaei H, Baldus SE, Wolters J, Lindenlauf N, Bruns I, Cadeddu RP, Kröpil F, Topp SA, Schulte am Esch J 2nd, Eisenberger CF, Knoefel WT, Stoecklein NH. Esophageal cancer proliferation is mediated by cytochrome P450 2C9 (CYP2C9). Prostaglan- dins Other Lipid Mediat 2011; 94: 25-33. [24] Guo X, Knudsen BS, Peehl DM, Ruiz A, Bok D,
Rando RR, Rhim JS, Nanus DM and Gudas LJ. Retinol metabolism and lecithin:retinol acyl-transferase levels are reduced in cultured hu-man prostate cancer cells and tissue speci-mens. Cancer Res 2002; 62: 1654-1661. [25] Anttila S, Hietanen E, Vainio H, Camus AM,
Gelboin HV, Park SS, Heikkilä L, Karjalainen A, Bartsch H. Smoking and peripheral type of cancer are related to high levels of pulmonary cytochrome P450IA in lung cancer patients. Int
J Cancer 1991; 47: 681-685.
[26] Rodriguez-Antona C, Gomez A, Karlgren M, Sim SC and Ingelman-Sundberg M. Molecular ge-netics and epigege-netics of the cytochrome P450 gene family and its relevance for cancer
risk and treatment. Hum Genet 2010; 127: 1-17.
[27] Merle NS, Noe R, Halbwachs-Mecarelli L, Fre- meaux-Bacchi V, Roumenina LT. Complement system part II: role in immunity. Front Immunol
2015; 6: 257.
[28] Davie EW, Ratnoff OD. Waterfall sequence for intrinsic blood clotting. Science 1964; 145: 1310-1312.
[29] Adams RL, Bird RJ. Review article: coagulation cascade and therapeutics update: relevance to nephrology. Part 1: overview of coagulation, thrombophilias and history of anticoagulants.
Nephrology (Carlton) 2009; 14: 462-470.
[30] Coussens LM, Zitvogel L, Palucka AK. Neu-
tralizing tumor-promoting chronic inflamma -tion: a magic bullet? Science 2013; 339: 286-291.
[31] Hanahan D, Weinberg RA. Hallmarks of can-cer: the next generation. Cell 2011; 144:
646-674.
[32] Mantovani A, Allavena P, Sica A, Balkwill F.
Cancer-related inflammation. Nature 2008;
454: 436-444.
[33] Fu X, Chen G, Cai ZD, Wang C, Liu ZZ, Lin ZY, Wu YD, Liang YX, Han ZD, Liu JC, Zhong WD. Overexpression of BUB1B contributes to pro-gression of prostate cancer and predicts poor outcome in patients with prostate cancer. Onco Targets Ther 2016; 9: 2211-2220. [34] Abal M, Obrador-Hevia A, Janssen KP, Casa-
dome L, Menendez M, Carpentier S, Barillot E, Wagner M, Ansorge W, Moeslein G, Fsihi H, Bezrookove V, Reventos J, Louvard D, Capella G, Robine S. APC inactivation associates with abnormal mitosis completion and concomitant BUB1B/MAD2L1 up-regulation. Gastroentero-
logy 2007; 132: 2448-2458.
[35] Liu AW, Cai J, Zhao XL, Xu AM, Fu HQ, Nian H,
Zhang SH. The clinicopathological significance
of BUBR1 overexpression in hepatocellular carcinoma. J Clin Pathol 2009; 62: 1003-1008.
[36] Slee RB, Grimes BR, Bansal R, Gore J, Bla- ckburn C, Brown L, Gasaway R, Jeong J, Vic- torino J and March KL. Selective inhibition of pancreatic ductal adenocarcinoma cell growth by the mitotic MPS1 kinase inhibitor NMS-
P715. Mol Cancer Ther 2014; 13: 307-315. [37] Crawford CV, Osborne MP and Katdare M.
Identification of cell cycle and apoptosis relat -ed gene expression by curcumin in an in vitro model for ductal carcinoma in situ. Cancer Res 2005; 65.
[38] Hanks S, Coleman K, Reid S, Plaja A, Firth H, Fitzpatrick D, Kidd A, Méhes K, Nash R, Robin N, Shannon N, Tolmie J, Swansbury J, Irrthum A, Douglas J, Rahman N. Constitutional aneu-ploidy and cancer predisposition caused by bi-allelic mutations in BUB1B. Nat Genet 2004; 36: 1159-1161.
Conde E, Castaño A, Sánchez-Godoy P, Tomas JF, Morente MM, Piris MA, García JF; Spanish Hodgkin’s Lymphoma Study Group. A TaqMan low-density array to predict outcome in
ad-vanced Hodgkin’s lymphoma using
paraffin-embedded samples. Clin Cancer Res 2009;
15: 1367-1375.
[41] Park HY, Jeon YK, Shin HJ, Kim IJ, Kang HC, Jeong SJ, Chung DH, Lee CW. Differential pro-moter methylation may be a key molecular mechanism in regulating BubR1 expression in
cancer cells. Exp Mol Med 2007; 39: 195-204.
[42] None. Cyclin B1 (CCNB1). SciBX: Science-Busi- ness eXchange 2009; 2.
[43] Covini G, Chan EK, Nishioka M, Morshed SA, Reed SI, Tan EM. Immune response to cyclin B1 in hepatocellular carcinoma. Hepatology
1997; 25: 75-80.
[44] Wu J, Zhou X, Fan Y, Cheng X, Lu B, Chen Z. Long non-coding RNA 00312 downregulates cyclin B1 and inhibits hepatocellular carcino-ma cell proliferation in vitro and in vivo. Bio-
chem Biophys Res Commun 2018; 497:
173-180.
[45] Viré E, Brenner C, Deplus R, Blanchon L, Fraga M, Didelot C, Morey L, Van Eynde A, Bernard D, Vanderwinden JM, Bollen M, Esteller M, Di Croce L, de Launoit Y, Fuks F. The polycomb group protein EZH2 directly controls DNA me-
thylation. Nature 2006; 439: 871-874.
[46] Ramakrishnan S, Granger V, Rak M, Hu Q, Attwood K, Aquila L, Krishnan N, Osiecki R, Azabdaftari G, Guru K, Chatta G, Gueron G, McNally L, Ohm J, Wang J, Woloszynska A. Inhibition of EZH2 induces NK cell-mediated differentiation and death in muscle-invasive bladder cancer. Cell Death Differ 2019; [Epub ahead of print].
[47] Bugide S, Green MR, Wajapeyee N. Inhibition of Enhancer of zeste homolog 2 (EZH2) induc-es natural killer cell-mediated eradication of hepatocellular carcinoma cells. Proc Natl Acad Sci U S A 2018; 115: E3509-E3518.
[48] Raemaekers T, Ribbeck K, Beaudouin J, Ann- aert W, Van Camp M, Stockmans I, Smets N, Bouillon R, Ellenberg J, Carmeliet G. NuSAP, a novel microtubule-associated protein involved in mitotic spindle organization. J Cell Biol
2003; 162: 1017-1029.
during early embryogenesis. J Cell Sci 2010; 123: 3244-3255.
[50] Zhang M, Yang D, Liu X, Liu Y, Liang J, He H, Zhong K, Lin L, Tao G, Zhang C, Zhou J. [Ex- pression of Nusap1 in the surgical margins of hepatocellular carcinoma and its association with early recurrence]. Nan Fang Yi Ke Da Xue
Xue Bao 2013; 33: 937-938, inside back cov -er.
[51] Kim Y, Choi JW, Lee JH, Kim YS. Spindle assem-bly checkpoint MAD2 and CDC20 overexpres-sions and cell-in-cell formation in gastric can-cer and its precursor lesions. Hum Pathol
2019; 85: 174-183.
[52] Kato T, Daigo Y, Aragaki M, Ishikawa K, Sato M, Kaji M. Overexpression of CDC20 predicts poor prognosis in primary non-small cell lung can-cer patients. J Surg Oncol 2012; 106: 423-430.
[53] Wang Y, Ruan Z, Yu S, Tian T, Liang X, Jing L, Li W, Wang X, Xiang L, Claret FX, Nan K, Guo H. A four-methylated mRNA signature-based risk score system predicts survival in patients with hepatocellular carcinoma. Aging (Albany NY)
2019; 11: 160-173.
[54] Zhuang L, Yang Z, Meng Z. Upregulation of BU-
B1B, CCNB1, CDC7, CDC20, and MCM3 in tu -mor tissues predicted worse overall survival and disease-free survival in hepatocellular car-cinoma patients. Biomed Res Int 2018; 2018:
7897346.
[55] Zhang M, Yang D, Liu X, Liu Y, Liang J. [Expre-
ssion and clinical significance of Nusap1 in he -patical carcinoma]. Zhong Nan Da Xue Xue
Bao Yi Xue Ban 2013; 38: 876-881.
[56] Yamagishi M, Uchimaru K. Targeting EZH2 in cancer therapy. Current Opinion in Oncology