ORIGINAL ARTICLE
Bioinformatics microarray analysis and
identification of gene expression profiles
associated with cirrhotic liver
Kun-Ming Chan
a,b,*
, Tsung-Han Wu
a,b, Ting-Jung Wu
a,b,
Hong-Shiue Chou
a,b, Ming-Chin Yu
a,b, Wei-Chen Lee
a,b aDepartment of General Surgery, Chang Gung Memorial Hospital at Linkou, Taoyuan, Taiwan
bCollege of Medicine, Chang Gung University, Taoyuan, Taiwan
Received 28 December 2015; accepted 25 February 2016Available online 23 April 2016
KEYWORDS
Bioinformatics; Gene profiles; Liver; Liver cirrhosis; Microarray analysisAbstract Cirrhosis is the endpoint of liver fibrosis that is accompanied by limited regeneration capacity and complications and is the ultimate cause of death in many patients. Despite this, few studies have thoroughly looked at the gene expression profiles in the cirrhotic liver. Hence, this study aims to identify the genes that were differentially expressed in the cirrhotic liver and to explore the putative related signaling pathway and interaction networks. The gene expression profiles of cirrhotic livers and noncirrhotic livers were examined and compared using microarray gene analysis. Proteins encoded by the differentially expressed genes were analyzed for func-tional clustering and signaling pathway involvement using MetaCore bioinformatics analyses. The Gene Ontology analysis as well as the Kyoto encyclopedia of Genes and Genomes pathway analysis were also performed. A total of 213 significant genes were differentially expressed at more than a two-fold change in cirrhotic livers as compared to noncirrhotic livers. Of these, 105 upregulated genes and 63 downregulated genes were validated through MetaCore bioinfor-matics analyses. The signaling pathways and major functions of proteins encoded by these differ-entially expressed genes were further analyzed; results showed that the cirrhotic liver has a unique gene expression pattern related to inflammatory reaction, immune response, and cell growth, and is potentially cancer related. Our findings suggest that the microarray analysis may provide clues to the molecular mechanisms of liver cirrhosis for future experimental studies. However, further exploration of areas regarding therapeutic strategy might be possible to support metabolic activity, decrease inflammation, or enhance regeneration for liver cirrhosis.
Copyrightª2016, Kaohsiung Medical University. Published by Elsevier Taiwan LLC. This is an open
access article under the CC BY-NC-ND license (http://creativecommons.org/licenses/by-nc-nd/
4.0/).
Conflicts of interest: All authors declare no conflicts of interest.
* Corresponding author. Department of General Surgery, Chang Gung Memorial Hospital at Linkou, 5, Fu-Hsing Street, Kwei-Shan Township, Taoyuan County 33305, Taiwan.
E-mail addresses:[email protected],[email protected](K.-M. Chan). http://dx.doi.org/10.1016/j.kjms.2016.03.008
1607-551X/Copyrightª2016, Kaohsiung Medical University. Published by Elsevier Taiwan LLC. This is an open access article under the CC BY-NC-ND license (http://creativecommons.org/licenses/by-nc-nd/4.0/).
Available online atwww.sciencedirect.com
ScienceDirect
Introduction
The liver is a quiescent organ in the adult body that has the unique capacity to regulate its growth and regenerate after injury and partial hepatectomy. This property is particularly remarkable in clinical circumstances such as toxic injury, viral hepatitis, and hepatectomy, situations in which quiescent hepatocytes proliferate and replicate to restore the mass and functional capacity of the liver[1,2]. However, the regener-ative ability of a cirrhotic liver is relregener-atively limited because of diffuse fibrosis of hepatic parenchyma, which also prohibits liver resection in patients with liver cirrhosis[3,4]. Currently, liver cirrhosis is always associated with hepatocellular carci-noma (HCC), and both are leading causes of death worldwide
[5e8]. Although liver resection remains the usual course of
treatment for patients with HCC, the reduced regeneration capacity would limit the benefit of liver resection for patients with hepatic malignancy[9e11].
Liver cirrhosis is an advanced stage of liver fibrosis that results when the normal wound-healing response leads to an abnormal continuation of connective tissue production and deposition[12]. The wound-healing response produces a formation of scar tissue that is composed of a complex assembly of different extracellular matrix (ECM) molecules
[13]. Additionally, a growing number of changes in genetic expressions that likely affected fibrosis progression had been described[14e16]. However, the majority of
candi-date differentially expressed genes need to be confirmed further. Therefore, this study collected liver tissues from cirrhotic and noncirrhotic livers and compared gene expression using microarray technology to identify gene expression differences in cirrhotic livers compared to non-cirrhotic livers.
Methods
Patients
All study procedures and protocols were approved by the Institutional Review Boards of Chang Gung Memorial Hos-pital, Taoyuan, Taiwan. Patients who underwent liver resection at the Department of General Surgery at the Chang Gung Memorial Hospital at Linkou, Taoyuan, Taiwan, were screened for inclusion in this study between December 2011 and December 2013. Written informed consent was obtained from all patients prior to the oper-ation, and 40 patients were enrolled in this study. Liver tissue was obtained through wedge liver biopsies during operation. In case of hepatic malignancy, tissue samples were taken from the part of the liver that did not contain the tumor. All liver tissues were initially subjected for histological examination, and the Ishak fibrosis score was used to assess the cirrhosis status of liver parenchyma
[17]. Patients who had Ishak fibrosis score 5 (marked portaleportal and/or portal central bridging with
occa-sional nodules) were defined as liver cirrhosis cases. Based on the classification, patients were categorized into two groups: cirrhotic liver (n Z 24) and noncirrhotic liver (nZ 16). The clinical characteristics of patients are listed in Table 1. The cirrhotic group consisted of 10 pa-tients who had undergone liver resection because of HCC
with (n Z 9) or without (n Z 1) virus hepatitis, and 14 patients who had liver transplantation. The indications of liver transplantation were virus hepatitis-related cirrhosis with (n Z 7) or without HCC (n Z 5), Wilson disease (nZ1), and unknown etiology of end-stage liver cirrhosis (nZ1). None of these patients had alcoholic-related liver cirrhosis. The noncirrhotic group consisted of four living-related liver donors and 12 patients who had liver resec-tion because of liver tumor including HCC (n Z 3), hem-angioma (nZ1), and colorectal cancer hepatic metastasis (nZ8).
Tissue preservation and RNA extraction
Liver biopsies were placed immediately in RNAlater RNA Stabilization Reagent (Qiagen Sciences, Valencia, CA, USA) and frozen at 20C. Total RNA was extracted from the liver biopsies and isolated using the RNeasy Mini Kit (Qiagen Sciences), according to the manufacturer’s protocol. Contaminating genomic DNA was removed using gDNA Eliminator columns from the RNeasy Mini Kit (Qiagen Sci-ences). Then, first-strand cDNA was synthesized from 2mg of total RNA by using the Super-Script first-strand synthesis system (Invitrogen, Carlsbad, CA, USA).
Microarray and data processing
The first-strand cDNA converted from mRNA was frag-mented into cRNA using T7 RNA polymerase with bio-tinylated nucleotides (Promega, Madison, WI, USA). Then, 15mg of fragmented cRNA was hybridized to each Affyme-trix HuGene 2.0 Chip (AffymeAffyme-trix, Santa Clara, CA, USA). Chips were hybridized, washed, and stained as per the Affymetrix standard protocol, and signal intensities corre-sponding to gene expression were generated through the Affymetrix GeneChip Operating Software (GCOS).
Table 1 Clinical demographic and characteristic of patients. Characteristics Cirrhosis (nZ24) Noncirrhosis (nZ16) p Age (y) 57 (33e76) 54 (31e69) 0.198 Sex 0.502 Male 15 (63) 12 (75) Female 9 (37) 4 (25) Hepatitis status <0.0001 Hepatitis B virus 16 (67) 1 (6) Hepatitis C virus 4 (17) 0 Hepatitis B & C 1 (4) 0 None 3 (12) 15 (94) Liver tumor 0.888 Primary HCC 17 (71) 3 (19) CRC metastasis 0 8 (50) Hemangioma 0 1 (6) No 7 (29) 4 (25)
Data are presented asn(%) or median (range).
Microarray gene profiles were obtained from each liver sample, and significant differences of expression gene were analyzed using group comparison. Genes that were statistically significant with a p value < 0.05 as well as expressed at two-fold or greater difference between the two groups were selected for further analysis. The bio-logical function analysis of gene-encoded protein was done using MetaCore (Life Sciences Research, Thomson Reuters, UK) analysis or the Database for Annotation, Visualization, and Integrated Discovery (DAVID; david.ncifcrf.gov) [18]. Pathway analysis and additional analysis of gene function was performed using the Gene Ontology (GO) analysis and/ or Kyoto encyclopedia of Genes and Genomes (KEGG) pathway analysis.
Results
Differential gene expression profiles
In order to clarify differential gene expression between cirrhotic and noncirrhotic livers, gene expression levels were analyzed in the two groups. Genes with a significant change of two-fold or more were screened, yielding 127 upregulated genes and 86 downregulated genes from the microarray analysis (Figure 1). Subsequently, these genes were further analyzed and categorized by MetaCore anal-ysis. After excluding unknown genes, 105 upregulated genes (Table 2) and 63 downregulated genes were validated (Table 3). Based on their putative functions, genes were
categorized into subgroups including transcription factors (nZ5), receptors (nZ9), ligands (nZ8), kinases (nZ3), proteases (nZ10), phosphatases (nZ3), generic enzymes (n Z 47), proteins and binding proteins (n Z 64), and others (nZ19).
Function and pathway of encoded proteins
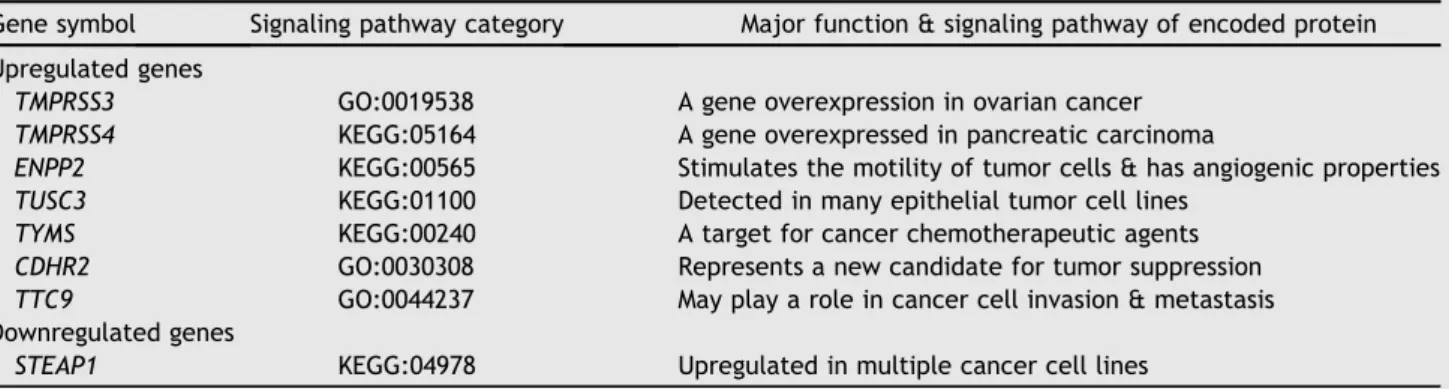
To determine the function and pathway of the protein encoded by each gene, a MetaCore search for each gene were performed. Although numerous genes have multiple functions, this study focused on the major pathway and function of the protein encoded by the gene. For genes that play a major role in inflammation and immunologic reaction, 18 genes were upregulated, but only one gene was downregulated in the cirrhotic liver compared to the noncirrhotic liver. Table 4 shows the pathway analysis results in terms of inflammation and immunologic reac-tion. The upregulated inflammatory and immunologic genes included genes involved in numerous inflammation reactions such as vascular inflammation, regulation of cytokines, and activation of chemokine in the cirrhotic liver.
Additionally, there were 19 significantly upregulated genes involved in the cell cycle in tasks such as cell dif-ferentiation, cell division, growth regulation, wound heal-ing, and apoptosis in the cirrhotic liver compared to the noncirrhotic liver, demonstrating that the cirrhotic liver was undergoing self-repair. However, the frequent cycle of parenchymal damage and repair has led to scar formation
Figure 1. Microarray gene analysis. (A) Heat map of gene expression profiles. Red color indicates upregulation; green color represents downregulation. (B) Volcano plot of differentially expressed genes. Red color indicates upregulation; green color represents downregulation. Genes with a significant change of more than two-fold were selected.
Table 2 Upregulated gene expression of cirrhotic liver as compared with noncirrhotic liver.
Gene symbol Gene name Fold change p
Transcription factors
STAT1 Signal transducer & activator of transcription 1 2.6 0.001 ZNF215 Zinc finger protein 215 2.13 0.002 NCKAP1L NCK-associated protein 1-like 2.13 0.007
ELF3 E74-like factor 3 2.08 0.036
Receptors
OSMR Oncostatin M receptor 2.97 0.002
LGALS3BP Lectin, galactoside-binding, soluble, 3 binding protein 2.53 0.002 HLA-A Major histocompatibility complex, class I, A 2.25 0.043 HLA-DRB3 Major histocompatibility complex, class II, DR beta 3 2.16 0.005
ITGA2 Integrin, alpha 2 2.1 0.049
Ligands
CCL20 Chemokine (CeC motif) ligand 20 5.15 0.037
SPP1 Secreted phosphoprotein 1 4.5 0.026
CXCL6 Chemokine (CeXeC motif) ligand 6 3.37 0.008 GDF15 Growth differentiation factor 15 2.34 0.034
LAMA2 Laminin, alpha 2 2.32 0.027
A2M Alpha-2-macroglobulin 2.24 <0.001
JAG1 Jagged 1 2.19 0.024
IL32 Interleukin 32 2.04 0.010
Kinase
HKDC1 Hexokinase domain containing 1 4.86 <0.001 CHEK2 Checkpoint kinase 2 2.62 0.012 Protease
MMP7 Matrix metallopeptidase 7 2.69 0.025
TMPRSS3 Transmembrane protease, serine 3 2.26 0.001 TMPRSS4 Transmembrane protease, serine 4 2.26 0.001 HTRA1 HtrA serine peptidase 1 2.18 0.002 BACE2 Beta-site APP-cleaving enzyme 2 2.04 0.021 Phosphatase
SGPP1 Sphingosine-1-phosphate phosphatase 1 4.5 0.026 PLA2G2A Phospholipase A2, group IIA 4.11 0.028 Generic enzymes
GGTLC2 Gamma-glutamyltransferase light chain 2 6.49 0.035 ACSL4 Acyl-CoA synthetase long-chain family member 4 5.52 0.014
UPP2 Uridine phosphorylase 2 5.22 0.012
LIPH Lipase, member H 4.95 <0.001
LIPI Lipase, member I 4.95 <0.001
ENPP2 Ectonucleotide pyrophosphatase/phosphodiesterase 2 4.02 <0.001
NQO1 NAD(P)H dehydrogenase, quinone 1 3.64 0.040
CHST9 Carbohydrate (N-acetylgalactosamine 4-0) sulfotransferase 9 3.03 0.006 ENPP5 Ectonucleotide pyrophosphatase/phosphodiesterase 5 3.02 0.005 APOBEC3C Apolipoprotein B mRNA editing enzyme, catalytic polypeptide-like 3C 2.78 <0.001
TYMS Thymidylate synthetase 2.72 0.034
GPX2 Glutathione peroxidase 2 2.7 0.001
FAM111B Family with sequence similarity 111, member B 2.66 0.036
CDS1 CDP-diacylglycerol synthase 1 2.62 0.012
TUSC3 Tumor suppressor candidate 3 2.43 0.017 NEDD4L Neural precursor cell expressed, developmentally downregulated 4-like 2.4 <0.001
OAS2 20-50-Oligoadenylate synthetase 2 2.31 0.001
IFI30 Interferon, gamma-inducible protein 30 2.24 0.004
GLS Glutaminase 2.23 0.020
GLS2 Glutaminase 2 2.23 0.020
UBASH3A Ubiquitin associated & SH3 domain containing A 2.18 0.002
TGM2 Transglutaminase 2 2.18 0.015
GCNT4 Glucosaminyl (N-acetyl) transferase 4, core 2 2.18 0.001 TMEM55A Transmembrane protein 55A 2.17 0.001 ACSM1 Acyl-CoA synthetase medium-chain family member 1 2.12 0.005
Table 2(continued)
Gene symbol Gene name Fold change p
MOXD1 Monooxygenase, DBH-like 1 2.1 0.034
MX1 Myxovirus (influenza virus) resistance 1 2.07 0.013
Protein, binding protein
TMEM45B Transmembrane protein 45B 7.07 <0.001 EPCAM Epithelial cell adhesion molecule 6.72 0.007 POF1B Oremature ovarian failure, 1B 5.66 0.001
FAT1 FAT tumor suppressor homolog 1 5.12 0.003
FABP4 Fatty acid binding protein 4, adipocyte 4.83 0.025 CXXC1 CXXC finger protein 1 4.5 0.026
GPC3 Glypican 3 4.49 0.015
DTNA Dystrobrevin, alpha 3.81 0.003
LGALS3 Lectin, galactoside-binding, soluble, 3 3.72 0.003 IGLV1-40 Immunoglobulin lambda variable 1e40 3.43 0.030
TSPAN8 Tetraspanin 8 3.41 0.002
SLPI Secretory leukocyte peptidase inhibitor 3.16 <0.001
GOLM1 Golgi membrane protein 1 3.1 0.001 DCDC2 Doublecortin domain containing 2 3.02 0.013
IFI6 Interferon, alpha-inducible protein 6 3.01 0.001
LRRC1 Leucine rich repeat containing 1 2.94 0.001 FAM169A Family with sequence similarity 169, member A 2.92 0.003 TIMP1 TIMP metallopeptidase inhibitor 1 2.85 0.013
LUM Lumican 2.84 0.046
SEL1L3 Sel-1 suppressor of lin-12-like 3 2.57 0.008 IGHV4-31 Immunoglobulin heavy variable 4-31 2.57 0.011 GPRIN3 GPRIN family member 3 2.5 <0.001 ANXA2P2 Annexin A2 pseudogene 2 2.47 0.022 HSPA4L Heat shock 70 kDa protein 4-like 2.44 0.007
CD24 CD24 molecule 2.31 0.023
HLA-A Major histocompatibility complex, class I, A 2.25 0.043
A2M Alpha-2-macroglobulin 2.24 <0.001
CDHR2 Cadherin-related family member 2 2.19 0.026 MMVP1 Myxomatous mitral valve prolapse 1 2.19 <0.001
MVP Major vault protein 2.19 <0.001
CLIP4 CAP-GLY domain containing linker protein family, member 4 2.18 0.002 TMEM87B Transmembrane protein 87B 2.14 <0.001
TTC9 Tetratricopeptide repeat domain 9 2.13 0.014
LXN Latexin 2.12 0.039
SPTBN1 Spectrin, beta, nonerythrocytic 1 2.08 0.036 PTGFRN Prostaglandin F2 receptor negative regulator 2.06 0.001 RASSF3 Ras association (RalGDS/AF-6) domain family member 3 2.05 0.023 RASSF5 Ras association (RalGDS/AF-6) domain family member 5 2.05 0.023
ID4 Inhibitor of DNA binding 4, dominant negative helixeloopehelix protein 2.04 0.024
LOXL4 Lysyl oxidase-like 4 2.03 0.010
EZR Ezrin 2.02 0.007
CDH6 Cadherin 6, type 2, K-cadherin 2.01 0.018
Others
SORT1 Sortilin 1 5.33 <0.001
SLC6A11 Solute carrier family 6, member 11 3.86 0.003 SLC38A1 Solute carrier family 38, member 1 3.5 <0.001 GPR64 G protein-coupled receptor 64 2.77 0.011 SLC35C1 Solute carrier family 35, member C1 2.69 <0.001 SLC22A15 Solute carrier family 22, member 15 2.54 0.018
CFTR Cystic fibrosis transmembrane conductance regulator 2.48 0.045
F2RL1 Coagulation factor II (thrombin) receptor-like 1 2.19 0.005 RASD1 RAS, dexamethasone-induced 1 2.07 0.038 SLC12A2 Solute carrier family 12 (sodium/potassium/chloride transporters),
member 2
Table 3 Downregulated gene expression of cirrhotic liver as compared with noncirrhotic liver.
Gene symbol Gene name Fold change p
Transcription factor
PHOX2A Paired-like homeobox 2a 3.83 0.002 Receptors
ABCC9 ATP-binding cassette, sub-family C, member 9 2.44 0.003 IL1RAP Interleukin 1 receptor accessory protein 2.29 0.005 PTPRD Protein tyrosine phosphatase, receptor type, D 2.1 0.024 PTPRS Protein tyrosine phosphatase, receptor type, S 2.1 0.024 Kinase
MAP2K6 Mitogen-activated protein kinase kinase 6 2.65 0.003 Protease
CNDP1 Carnosine dipeptidase 1 7.24 0.002 FOLH1B Folate hydrolase 1B 3.29 0.007 MMP12 Matrix metallopeptidase 12 3.1 0.003
MME Membrane metallo-endopeptidase 3.1 0.003
NAALAD2 N-Acetylated alpha-linked acidic dipeptidase 2 2.07 0.030 Phosphatase
ENPP3 Ectonucleotide pyrophosphatase/phosphodiesterase 3 3.0 0.001 Generic enzymes
SRD5A2 Steroid-5-alpha-reductase, alpha polypeptide 2 6.35 0.003 CYP7A1 Cytochrome P450, family 7, subfamily A, polypeptide 1 4.56 0.014 SULT1E1 Sulfotransferase family 1E, estrogen-preferring, member 1 4.43 <0.001
LGSN Lengsin, lens protein with glutamine synthetase domain 4.2 0.017
ASPA Aspartoacylase 3.76 0.001
CYP2C19 Cytochrome P450, family 2, subfamily C, polypeptide 19 3.47 0.001
BCHE Butyrylcholinesterase 3.31 0.002
CYP1A1 Cytochrome P450, family 1, subfamily A, polypeptide 1 3.21 0.015 CYP1A2 Cytochrome P450, family 1, subfamily A, polypeptide 2 3.21 0.015 BBOX1 Butyrobetaine, 2-oxoglutarate dioxygenase 1 2.82 0.007 HSD17B14 Hydroxysteroid (17-beta) dehydrogenase 14 2.67 <0.001 DHRS2 Dehydrogenase/reductase (SDR family) member 2 2.5 0.001
OAT Ornithine aminotransferase 2.5 0.019
CYP4A22 Cytochrome P450, family 4, subfamily A, polypeptide 22 2.39 0.023 EPHX2 Epoxide hydrolase 2, cytoplasmic 2.32 0.008 ACSM3 Acyl-CoA synthetase medium-chain family member 3 2.24 0.013 CYP4A11 Cytochrome P450, family 4, subfamily A, polypeptide 11 2.24 0.012
GPAM Glycerol-3-phosphate acyltransferase, mitochondrial 2.23 0.043
ADCY10 Adenylate cyclase 10 2.2 0.028 STEAP1 Six transmembrane epithelial antigen of the prostate 1 2.12 0.045 Protein, binding protein
C5orf27 Chromosome 5 open reading frame 27 11.82 <0.001 TRIM55 Tripartite motif containing 55 7.31 <0.001 RANBP3L RAN binding protein 3-like 5.73 0.007 CTNNA3 Catenin (cadherin-associated protein), alpha 3 4.45 <0.001 NCAM2 Neural cell adhesion molecule 2 3.83 0.002
IDO2 Indoleamine 2,3-dioxygenase 2 3.46 0.012
FAM106CP Family with sequence similarity 06, member C, pseudogene 3.1 <0.001
MT1G Metallothionein 1G 3.0 0.031
PPP1R1A Protein phosphatase 1, regulatory subunit 1A 3.0 0.010
LPA Lipoprotein, Lp(a) 2.77 0.033
CCDC144A Coiled-coil domain containing 144A 2.55 0.010 SLITRK3 SLIT & NTRK-like family, member 3 2.52 <0.001 ABCC9 ATP-binding cassette, subfamily C (CFTR/MRP), member 9 2.44 0.003 SLITRK6 SLIT & NTRK-like family, member 6 2.4 0.005 FAM151A Family with sequence similarity 151, member A 2.35 0.007 CECR2 Cat eye syndrome chromosome region, candidate 2 2.34 <0.001 JAKMIP2 Janus kinase & microtubule interacting protein 2 2.32 0.013
LIPC Lipase, hepatic 2.32 0.004
as well as cirrhotic change of the hepatic parenchyma. By contrast, three genes that are involved in regulating cellular process including cell growth, cell differentiation, mitotic cycling, embryonic development, reproduction, and tissue remodeling were downregulated, indicating that the self-renewal ability of the cirrhotic liver might be relatively limited (Table 5).
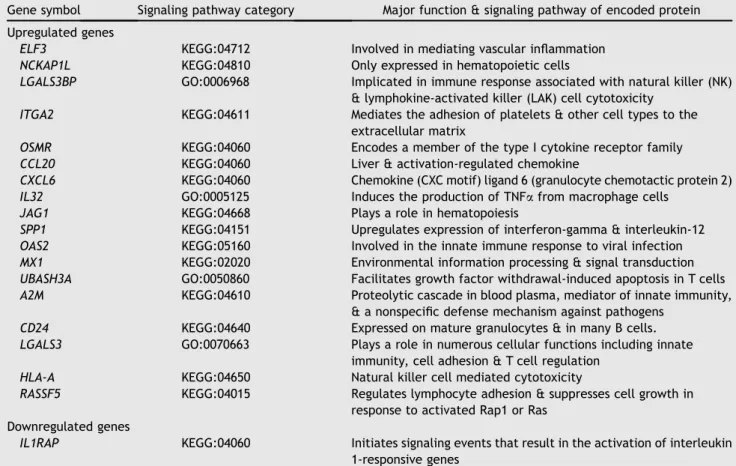
In terms of genes related to cancer, seven tumor-associated genes were significantly upregulated in the cirrhotic liver compared to the noncirrhotic liver. Of these, three genes were presented in various tumors, and four genes were associated with cancer behavior related to cancer cell invasion, angiogenic properties, and therapeu-tic sensitivity. Although none of these genes were directly related to primary liver tumor, these results suggested that the microenvironment contained in cirrhotic liver might be affecting oncogenesis or tumorigenesis as compared to the noncirrhotic liver (Table 6).
Significant signaling pathway and interaction
network
To explore the putative signaling pathway and interaction network associated with cirrhosis liver, MetaCore and pathway analyses were further performed. Twenty-six signaling pathways were statistically significant, and a signaling pathway termed “Cell adhesion ECM_remodel-ing” was involved by most genes of the study. Three upregulated genes (TIMP1, MMP-7, and Ezrin) and one downregulated gene (MMP-12) were identified to partici-pate in the Cell adhesion ECM_remodeling pathway (Figure 2), indicating cirrhotic liver might be associated with ECM remodeling, which involves the normal physio-logical processes of reproduction, proliferation, cell motility and adhesion, wound healing, angiogenesis, as well as disease processes. Meanwhile, the interaction network analysis resulted in 21 networks, and Figure 3
illustrates the most significant interaction network. The interaction network contained 137 genes, and 87 of them were from the current study. Additionally, the interaction network was composed of genes regarding regulation of cell proliferation (41.1%), positive regulation of gene expression (38.8%), positive regulation of transcription from RNA polymerase II promoter (32.6%), regulation of epithelial cell proliferation (21.7%), and organ develop-ment (51.9%).
Discussion
The mechanisms responsible for the initiation and process of liver regeneration are widely explored in terms of their physiological, biochemical, morphological, and molecular characteristics [1,2]. A deeper understanding of liver regeneration has been pursued for several decades, and most of the new information has been uncovered using a reproducible model of partial hepatectomy from rodents. However, the regenerative ability of the cirrhotic liver is relatively limited because of diffuse fibrosis of the hepatic parenchyma, which prohibits liver resection in patients with liver cirrhosis. Hence, it is imperative to understand the differences between a cirrhotic liver and a healthy liver. This study characterized the differences in gene expression in the cirrhotic liver using microarray technol-ogy. Furthermore, the differentially expressed genes were categorized into subgroups based on the molecular basis of their major role, which could be informative for our un-derstanding of the pathophysiology and regeneration ca-pacity of the cirrhotic liver.
The invention of new scientific instruments and meth-odologies allows for new ways of exploring medical ques-tions. Microarray technology has become one of the most sophisticated and widely used methods for identification of differentially expressed genes[19,20]. A number of previ-ous reports have shown that several gene profiles related to
Table 3(continued)
Gene symbol Gene name Fold change p
PCOLCE2 Procollagen C-endopeptidase enhancer 2 2.16 0.001 LPAL2 Lipoprotein, Lp(a)-like 2, pseudogene 2.08 0.044 LRRTM3 Leucine rich repeat transmembrane neuronal 3 2.08 <0.001 Others
KCNN2 Potassium conductance calcium-activated channel, subfamily N, member 2
7.73 <0.001
NPY6R Neuropeptide Y receptor Y6 4.7 0.005 CFHR3 Complement factor H-related 3 4.01 0.048 KCNJ3 Potassium inwardly-rectifying channel, subfamily J, member 3 3.15 0.013 SLC5A12 Solute carrier family 5 (sodium/glucose cotransporter), member
12
3.05 0.038
SLCO1B3 Solute carrier organic anion transporter family, member 1B3 2.63 0.001 SLC17A2 Solute carrier family 17 (sodium phosphate), member 2 2.44 0.005 SLC34A1 Solute carrier family 34 (sodium phosphate), member 1 2.44 0.005 SLC16A10 Solute carrier family 16, member 10 (aromatic amino acid
transporter)
cirrhotic liver were associated with other underlying liver disease [20e22], and many of those genes in terms of
similar categories and biologic functions were noted in this study as well. Importantly, some genes related to immune response and cytokines were identified. OSMR, CCL20,
CXCL6, OAS2, and IL32 were upregulated in cirrhosis,
whereas IL1RAP was downregulated in cirrhotic liver. Additionally, these cytokines were identified to participate in a common cytokineecytokine receptor interaction
pathway in this study. The results suggested that an increased expression of immune responsive genes and cy-tokines were associated with fibrosis progress. Meanwhile, specific cytokines such as OAS2 might be also connected with viral infection, which is in agreement with previous evidence that involved the innate immune response to viral infection[23].
Numerous animal studies have examined the expression of genes related to regeneration following partial hepa-tectomy[24e27]. Studies also showed evidence illustrating
the shift in metabolic function and energy balance in regenerating livers of rodents[28e30]. However, the
ma-jority of experiments looked at animals with healthy liver parenchyma. In the clinical setting, patients with liver disease associated with various degrees of cirrhosis are very common. This study analyzed cirrhotic livers from humans,
so the results may be more transferrable to a clinical setting. Genes related to various cellular functions in terms of cell differentiation, division, growth regulation, wound healing, and apoptosis showed different expression pat-terns in cirrhotic liver. Additionally, few genes related to the ECM remodeling pathway were significant in cirrhotic liver, which is consistent with previous reports that showed a connection between liver cirrhosis and process of apoptosis, cell repair, wound healing, and cell proliferation
[12,13,31].
Although innate immunity has been described to be important for liver regeneration [32e34], few genes
involved in liver regeneration were differentially expressed in the cirrhotic liver of this study. Meanwhile, a number of genes associated with metabolic liver functions such as bile acid metabolism and protein metabolism were markedly decreased in the cirrhotic liver compared to the healthy liver. Differential expression of genes encoding enzymes that play roles in glucose metabolism, lipid metabolism, bile secretion, and hormone metabolism was also observed.
However, this study is limited by its small sample size and heterogeneous patient characteristics, and we are not able to determine what extent and degree of liver cirrhosis would affect differential gene expression in this study.
Table 4 Differential expression genes regarding inflammation and immunologic reaction in the cirrhotic liver as compared with noncirrhotic liver.
Gene symbol Signaling pathway category Major function & signaling pathway of encoded protein
Upregulated genes
ELF3 KEGG:04712 Involved in mediating vascular inflammation
NCKAP1L KEGG:04810 Only expressed in hematopoietic cells
LGALS3BP GO:0006968 Implicated in immune response associated with natural killer (NK) & lymphokine-activated killer (LAK) cell cytotoxicity
ITGA2 KEGG:04611 Mediates the adhesion of platelets & other cell types to the extracellular matrix
OSMR KEGG:04060 Encodes a member of the type I cytokine receptor family
CCL20 KEGG:04060 Liver & activation-regulated chemokine
CXCL6 KEGG:04060 Chemokine (CXC motif) ligand 6 (granulocyte chemotactic protein 2)
IL32 GO:0005125 Induces the production of TNFafrom macrophage cells
JAG1 KEGG:04668 Plays a role in hematopoiesis
SPP1 KEGG:04151 Upregulates expression of interferon-gamma & interleukin-12
OAS2 KEGG:05160 Involved in the innate immune response to viral infection
MX1 KEGG:02020 Environmental information processing & signal transduction
UBASH3A GO:0050860 Facilitates growth factor withdrawal-induced apoptosis in T cells
A2M KEGG:04610 Proteolytic cascade in blood plasma, mediator of innate immunity,
& a nonspecific defense mechanism against pathogens
CD24 KEGG:04640 Expressed on mature granulocytes & in many B cells.
LGALS3 GO:0070663 Plays a role in numerous cellular functions including innate immunity, cell adhesion & T cell regulation
HLA-A KEGG:04650 Natural killer cell mediated cytotoxicity
RASSF5 KEGG:04015 Regulates lymphocyte adhesion & suppresses cell growth in response to activated Rap1 or Ras
Downregulated genes
IL1RAP KEGG:04060 Initiates signaling events that result in the activation of interleukin 1-responsive genes
Table 5 Differential expression genes involved in cell differentiation, division, growth regulation, wound healing, and apoptosis in the cirrhotic liver.
Gene symbol Signaling pathway category Major function & signaling pathway of encoded protein
Upregulated genes
GDF15 GO:0048869 Regulates tissue differentiation & maintenance
CHEK2 KEGG:04110 A cell cycle checkpoint regulator & putative tumor suppressor HTRA1 GO:0050678 Regulates the availability of insulin-like growth factors (IGFs) by
cleaving IGF-binding proteins
MMP7 KEGG:04310 Involved in wound healing, regulates the activity of defensive in
intestinal mucosa
APOBEC3C GO:0040029 Has roles in growth or cell cycle control
CHST9 KEGG:00513 Critical for cellecell interaction, signal transduction, & embryonic development
LIPH KEGG:01100 A lipid mediator that stimulates cell proliferation & motility
TGM2 KEGG:04210 Appears to be involved in apoptosis
EZR GO:0032989 Plays a key role in cell surface structure adhesion, migration, &
organization
FAT1 GO:0009653 Important in developmental processes & cell communication
GPC3 KEGG:05205 Plays a role in the control of cell division & growth regulation
IFI6 GO:2001233 Plays a critical role in the regulation of apoptosis
CDH6 GO:0048729 Plays critical roles in cell differentiation & morphogenesis
LOXL4 GO:0071840 Essential to the biogenesis of connective tissue
LUM GO:0061448 Regulate collagen fibril organization & circumferential growth,
corneal transparency, & epithelial cell migration & tissue repair
MVP GO:0031099 Plays a role in multiple cellular processes by regulating the MAP
kinase, JAK/STAT, & phosphoinositide 3-kinase/Akt signaling pathways
TSPAN8 GO:0007166 Plays a role in the regulation of cell development, activation, growth, & motility
RASD1 KEGG:04713 Has a role in dexamethasone-induced alterations in cell
morphology, growth, & celleextracellular matrix interactions
SORT1 KEGG:04142 The encoded protein binds a number of unrelated ligands that participate in a wide range of cellular processes
Downregulated genes
PTPRD GO:0022603 Regulation of anatomical structure & morphogenesis
PTPRS GO:0009888 Regulates a variety of cellular processes including cell growth, differentiation, mitotic cycle, & oncogenic transformation MMP12 GO:0032502 Involved in embryonic development, reproduction, & tissue
remodeling, as well as in disease processes GOZGene Ontology; KEGGZKyoto Encyclopedia of Genes and Genomes.
Table 6 Differential expression of tumor associated gene in the cirrhotic liver.
Gene symbol Signaling pathway category Major function & signaling pathway of encoded protein
Upregulated genes
TMPRSS3 GO:0019538 A gene overexpression in ovarian cancer TMPRSS4 KEGG:05164 A gene overexpressed in pancreatic carcinoma
ENPP2 KEGG:00565 Stimulates the motility of tumor cells & has angiogenic properties TUSC3 KEGG:01100 Detected in many epithelial tumor cell lines
TYMS KEGG:00240 A target for cancer chemotherapeutic agents
CDHR2 GO:0030308 Represents a new candidate for tumor suppression
TTC9 GO:0044237 May play a role in cancer cell invasion & metastasis
Downregulated genes
STEAP1 KEGG:04978 Upregulated in multiple cancer cell lines GOZGene Ontology; KEGGZKyoto Encyclopedia of Genes and Genomes.
Additionally, the transition from chronic liver disease to cirrhosis involves a lengthy process that includes inflam-mation, angiogenesis, and fibrogenesis. Each of the pro-cesses at different time points might express various cascades of genes, and the real situation of gene expression in cirrhosis may not be adequately reflected by a randomly selected time point as in the current study. Apart from that, most genes usually act as part of diverse signaling pathway, and multiple genes interacting through a signaling pathway on cellular function is more significant than that of a single gene. Therefore, further work with more patients and solid study might be necessary to determine the actual contribution of each element.
Taken together, our results showed that the cirrhotic liver has a unique environment compared to the noncirrhotic liver. Specifically, the cirrhotic liver has strong immune re-sponses including inflammation and immunological reaction, which could be a consequence of liver fibrosis. Moreover, the cirrhotic liver is in an unstable state, in which hepatocyte damage, growth regulation, wound healing, and apoptosis are constantly occurring. This would lead to scar formation as well as cirrhotic change of the hepatic parenchyma. Although generalizations about the study cannot be easily made, several remarkable exploration might be helpful in future research as well as provide information that could be used to better understand liver cirrhosis.
Figure 2. Illustration of signaling pathway “Cell adhesion ECM_remodeling.” Four genes including three upregulated genes
(TIMP1,MMP-7, andEzrin) and one downregulated gene (MMP-12) from the current study were identified to participate in the
Acknowledgments
This work was supported by grants from the Chang Gung Medical Research Program (CMRPG3A1391w3) to K.M.C.
References
[1] Fausto N. Liver regeneration. J Hepatol 2000;32:19e31. [2] Taub R. Liver regeneration: from myth to mechanism. Nat Rev
Mol Cell Biol 2004;5:836e47.
[3] Taura K, Ikai I, Hatano E, Yasuchika K, Nakajima A, Tada M, et al. Influence of coexisting cirrhosis on outcomes after partial hepatic resection for hepatocellular carcinoma ful-filling the Milan criteria: an analysis of 293 patients. Surgery 2007;142:685e94.
[4] Yeh CN, Chen MF, Lee WC, Jeng LB. Prognostic factors of he-patic resection for hepatocellular carcinoma with cirrhosis: univariate and multivariate analysis. J Surg Oncol 2002;81: 195e202.
[5] Liaw YF, Lin DY, Chen TJ, Chu CM. Natural course after the development of cirrhosis in patients with chronic type B hepatitis: a prospective study. Liver 1989;9:235e41. [6] Montalto G, Cervello M, Giannitrapani L, Dantona F,
Terranova A, Castagnetta LA. Epidemiology, risk factors, and natural history of hepatocellular carcinoma. Ann N Y Acad Sci 2002;963:13e20.
[7] El-Serag HB. Hepatocellular carcinoma. N Engl J Med 2011; 365:1118e27.
[8] Leise MD, Kim WR, Kremers WK, Larson JJ, Benson JT, Therneau TM. A revised model for end-stage liver disease optimizes prediction of mortality among patients awaiting liver transplantation. Gastroenterology 2011;140:1952e60.
[9]Chen MF, Jeng LB, Lee WC. Surgical results in patients with hepatitis virus-related hepatocellular carcinoma in Taiwan. World J Surg 2002;26:742e7.
[10] Chan KM, Lee CF, Wu TJ, Chou HS, Yu MC, Lee WC, et al. Adverse outcomes in patients with postoperative ascites after liver resection for hepatocellular carcinoma. World J Surg 2012;36:392e400.
[11] Huang JF, Wu SM, Wu TH, Lee CF, Wu TJ, Yu MC, et al. Liver resection for complicated hepatocellular carcinoma: chal-lenges but opportunity for long-term survivals. J Surg Oncol 2012;106:959e65.
[12] Schuppan D, Afdhal NH. Liver cirrhosis. Lancet 2008;371: 838e51.
[13] Schuppan D, Ruehl M, Somasundaram R, Hahn EG. Matrix as a modulator of hepatic fibrogenesis. Semin Liver Dis 2001;21: 351e72.
[14] Czochra P, Klopcic B, Meyer E, Herkel J, Garcia-Lazaro JF, Thieringer F, et al. Liver fibrosis induced by hepatic over-expression of PDGF-B in transgenic mice. J Hepatol 2006;45: 419e28.
[15] Hemmann S, Graf J, Roderfeld M, Roeb E. Expression of MMPs and TIMPs in liver fibrosis d a systematic review with special emphasis on anti-fibrotic strategies. J Hepatol 2007;46:955e75. [16] Jung Y, Witek RP, Syn WK, Choi SS, Omenetti A, Premont R, et al. Signals from dying hepatocytes trigger growth of liver progenitors. Gut 2010;59:655e65.
[17] Ishak K, Baptista A, Bianchi L, Callea F, De Groote J, Gudat F, et al. Histological grading and staging of chronic hepatitis. J Hepatol 1995;22:696e9.
[18] Huang da W, Sherman BT, Lempicki RA. Systematic and inte-grative analysis of large gene lists using DAVID bioinformatics resources. Nat Protoc 2009;4:44e57.
[19] Chang TW. Binding of cells to matrixes of distinct antibodies coated on solid surface. J Immunol Methods 1983;65:217e23.
Figure 3. Significant interaction network analyzed from MetaCore. The interaction network comprised 137 genes that contained 87 significant genes (red circle) of the study.
[20] Shangguan H, Tan SY, Zhang JR. Bioinformatics analysis of gene expression profiles in hepatocellular carcinoma. Eur Rev Med Pharmacol Sci 2015;19:2054e61.
[21] Ahmad W, Ijaz B, Hassan S. Gene expression profiling of HCV genotype 3a initial liver fibrosis and cirrhosis patients using microarray. J Transl Med 2012;10:41.
[22] Anders RA, Yerian LM, Tretiakova M, Davison JM, Quigg RJ, Domer PH, et al. cDNA microarray analysis of macroregenerative and dysplastic nodules in end-stage hepatitis C virus-induced cirrhosis. Am J Pathol 2003;162:991e1000.
[23] Pawlotsky JM. Hepatitis C virus resistance to antiviral therapy. Hepatology 2000;32:889e96.
[24] Fukuhara Y, Hirasawa A, Li XK, Kawasaki M, Fujino M, Funeshima N, et al. Gene expression profile in the regener-ating rat liver after partial hepatectomy. J Hepatol 2003;38: 784e92.
[25] Nagano Y, Nagahori K, Yoshiro F, Hamaguchi Y, Ishikawa T, Ichikawa Y, et al. Gene expression profile analysis of regen-erating liver after portal vein ligation in rats by a cDNA microarray system. Liver Int 2004;24:253e8.
[26] Togo S, Makino H, Kobayashi T, Morita T, Shimizu T, Kubota T, et al. Mechanism of liver regeneration after partial hepatec-tomy using mouse cDNA microarray. J Hepatol 2004;40:464e71.
[27] Makino H, Shimada H, Morioka D, Kunisaki C, Morita T, Matsuyama R, et al. Analysis of gene expression profiles in fatal hepatic failure after hepatectomy in mice. J Surg Res 2011;169:36e43.
[28] Inoue H, Ogawa W, Ozaki M, Haga S, Matsumoto M, Furukawa K, et al. Role of STAT-3 in regulation of hepatic gluconeogenic genes and carbohydrate metabolism in vivo. Nat Med 2004;10:168e74.
[29] Huang J, Rudnick DA. Elucidating the metabolic regulation of liver regeneration. Am J Pathol 2014;184:309e21.
[30] Newberry EP, Kennedy SM, Xie Y, Luo J, Stanley SE, Semenkovich CF, et al. Altered hepatic triglyceride content after partial hepatectomy without impaired liver regeneration in multiple murine genetic models. Hepatology 2008;48:1097e105. [31] Tsochatzis EA, Bosch J, Burroughs AK. Liver cirrhosis. Lancet
2014;383:1749e61.
[32] Fausto N. Involvement of the innate immune system in liver regeneration and injury. J Hepatol 2006;45:347e9.
[33] Kang LI, Mars WM, Michalopoulos GK. Signals and cells involved in regulating liver regeneration. Cells 2012;1:1261e92. [34] Michalopoulos GK. Liver regeneration after partial
hepatec-tomy: critical analysis of mechanistic dilemmas. Am J Pathol 2010;176:2e13.