Effect of under-reinforcement on the flexural strength of
corroded beams
O'FLAHERTY, Fin <http://orcid.org/0000-0003-3121-0492>, MANGAT, Pal
<http://orcid.org/0000-0003-1736-8891>, LAMBERT, Paul
<http://orcid.org/0000-0002-2815-1674> and BROWNE, Elena
Available from Sheffield Hallam University Research Archive (SHURA) at:
http://shura.shu.ac.uk/3050/
This document is the author deposited version. You are advised to consult the publisher's version if you wish to cite from it.
Published version
O'FLAHERTY, Fin, MANGAT, Pal, LAMBERT, Paul and BROWNE, Elena (2008). Effect of under-reinforcement on the flexural strength of corroded beams. Materials and structures, 41 (2), 311-321.
Copyright and re-use policy
See http://shura.shu.ac.uk/information.html
1
Effect of under-reinforcement on the flexural
strength of corroded beams
Fin J. O’Flaherty1, Pritpal S. Mangat1, Paul Lambert1 and Elena H. Browne2
(1) Centre for Infrastructure Management, Sheffield Hallam University, Howard Street, Sheffield, S1 1WB, UK
(2) Halcrow, Birmingham, UK
Abstract:
Reinforced concrete beams are normally designed as under-reinforced to provide ductile behaviour i.e. the tensile moment of resistance, M t(0) is less than the moment of resistance of
the compressive zone, M c . The degree of under-reinforcement (M t(0)/M c ratio) can depend
upon the preferences of the designer in complying with design and construction constraints, codes and availability of steel reinforcement diameters and length. M t(0)/M c is further
influenced during service life by corrosion which decreases M t(0). The paper investigates the
influence of M t(0)/M c on the residual flexural strength of corroded beams and determines
detailing parameters (e.g. size and percentage of steel reinforcement, cover) on M t(0)/M c .
Corroded reinforced concrete beams (100 mm × 150 mm deep) with varying M t(0)/M c ratios
were tested in flexure. The results of the investigation were combined with the results of similar work by other researchers and show that beams with lower M t(0)/M c ratios suffer
lower flexural strength loss when subjected to tensile reinforcement corrosion. Cover to the main steel does not directly influence M t(0)/M c and, thus, the residual flexural strength of
corroded beams is not normally affected by increased cover. A simplified expression for estimating the residual strength of corroded beams is also given.
Keywords:
Under-reinforced Corrosion Flexural Durability Structural
1 Introduction
The current British Standard, BS 8110 [1], for design of reinforced concrete structures is due to be withdrawn by 2010 and replaced by EC2 [2]. The design of flexural elements to both standards is very similar [3] and dictates that the section fails by yielding of the tensile reinforcement. Beams are, therefore, designed as under-reinforced and the tensile moment of resistance, M t(0), is less than the moment of resistance of the compressive zone, M c . The
level of under-reinforcement (M t(0)/M c ) depends upon the preferences of the designer in
complying with design and construction constraints, codes and availability of steel
2
In addition, reinforced concrete is prone to corrosion when subject to attack by chlorides in deicing salt for winter maintenance or through a reduction in the alkalinity through
carbonation. There are numerous reinforced concrete beams in-service in structures that are showing signs of distress, initiating as rust stains and eventually leading to longitudinal cracking along the corroding steel reinforcement and spalling of the surrounding concrete. It has been suggested that 10–25% reduction in steel bar section due to corrosion results in failure of serviceability [5]. Despite the majority of reinforced concrete structures meeting or exceeding their intended service life [6], repair and maintenance of reinforced concrete is costly and it is estimated that €1.5 bn is spent annually in Europe [7] to repair deteriorating infrastructure. This figure will continue to rise as the volume of maintenance and repair on corroded reinforced concrete continues to grow. This puts pressure on bridge engineers who are responsible for maintaining deteriorating bridge stock with insufficient maintenance budgets.
The aim of the paper is to determine the influence of M t(0)/M c on residual flexural strength of
corroded beams and to establish the effect of detailing parameters (e.g. bar diameter,
percentage of steel reinforcement, cover) on M t(0)/M c . Optimisation of design procedures to
accommodate future corrosion of beams may help reduce the enormous repair costs incurred each year. The paper also presents a simplified expression for estimating the residual strength of corroded beams.
2 Research significance
Since it is well established that reinforced concrete deteriorates when subjected to a severe corrosive environment containing chlorides and carbon dioxide, there are a number of methods currently available to minimise deterioration. At the design stage, pozzolanic materials such as silica fume, fly ash and slag can be added to the mixture to enhance the durability of the concrete [8]. Corrosion resistant chemical admixtures are available which increase the resistance of concrete to deicing deterioration [9]. During the in-service stage, electrochemical techniques such as cathodic protection; desalination and re-alkalisation have been used successfully to prevent or slow down the onset of corrosion in reinforced concrete.
The availability of anti-carbonation coatings and corrosion inhibitors also enhance durability and increase the service life of the member.
In addition to the current methods for combating deterioration of reinforced concrete, implementation of the design recommendations identified in this paper will contribute to minimising repair of deteriorated beams at no additional initial cost with the benefit of potential savings on future maintenance costs.
3 Design, manufacture and testing of beams
3
steel 2T12. Beams are identified in the paper by the number and type of main steel bars and cover to the main reinforcement e.g. 2T8/26.
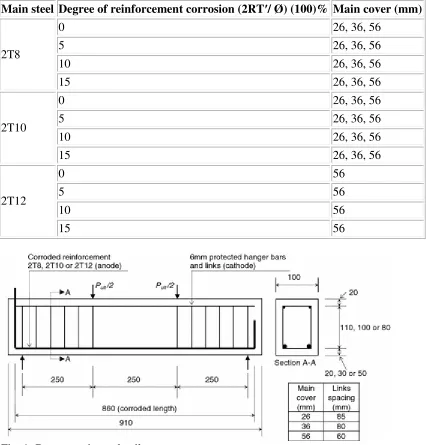
Table 1: Details of reinforced concrete beams
Main steel Degree of reinforcement corrosion (2RT′/ Ø) (100)% Main cover (mm)
2T8
0 26, 36, 56
5 26, 36, 56
10 26, 36, 56
15 26, 36, 56
2T10
0 26, 36, 56
5 26, 36, 56
10 26, 36, 56
15 26, 36, 56
2T12
0 56
5 56
10 56
[image:4.595.71.497.143.588.2]15 56
Fig. 1: Beam specimen details
Main reinforcement consisted of high yield (ribbed) bars with a nominal characteristic strength of 460 N/mm2. Shear reinforcement was 6 mm diameter plain round mild steel bars of nominal characteristic strength 250 N/mm2 at a spacing of 85, 80 or 65 mm corresponding to the cover of 26, 36 and 56 mm, respectively. Two longitudinal hanger bars for the links were provided at the top of the beam cross-section. These were 6 mm diameter plain round mild steel bars with a nominal characteristic yield strength of 250 N/mm2. The steel
4
process (see Sect. 4). Inspection of the shear reinforcement at the end of the tests showed that this was an effective method of preventing accelerated corrosion of the shear reinforcement. The beams were cast in the laboratory using a concrete with target cube strength of 40 N/mm2. Mix proportions were 1:1.7:3.8 of ordinary Portland cement:fine aggregate:coarse aggregate. Fine and coarse aggregates were oven dried at 100°C for 24 h. Anhydrous calcium chloride (CaCl2) was added to the mix (1% by weight of cement) in order to promote corrosion of the
reinforcement. The concrete was cast in steel moulds in three layers, each layer being carefully compacted on a vibrating table. The specimens were then placed in a mist curing room (20°C and 95% ± 5% Relative Humidity) for 24 h. The samples were demoulded after 1 day and cured in water at 20°C for a further 27 days (28 days in total). The beams were then transferred to a tank filled with a saline solution for accelerated corrosion at 28 days age. Beams were subsequently tested to failure under four point loading.
The control specimens (0% corrosion) were tested in flexure at the age of 28 days but the corroded beams were tested at 42, 56 and 63 days age due to the time taken to reach the target corrosion of 5, 10 and 15%, respectively (Table 1). The loading rate was 5 kN/min.
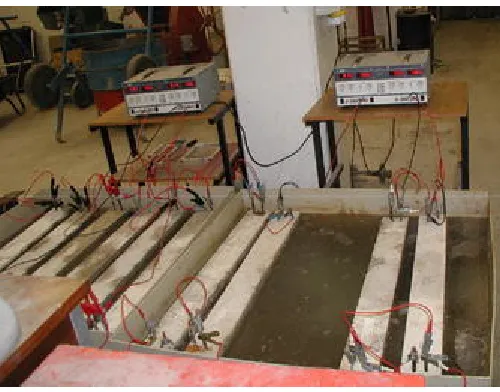
4 Accelerated corrosion process
The longitudinal tensile steel reinforcement was subjected to an accelerated galvanostatic corrosion process in an electrolytic cell by means of a direct current multi-channel power supply. The accelerated corrosion test arrangement is shown in Fig. 2 with up to three beams electrically connected in series. The system was connected to an ammeter to monitor the cell current. The corrosion process took place in a plastic tank where a 3.5% CaCl2 solution was
used as the electrolyte. The solution level in the tank was adjusted to slightly exceed the concrete cover plus reinforcing bar diameter to ensure adequate submersion of the longitudinal reinforcement. The direction of the current was arranged so that the main
reinforcing steel served as the anode and the longitudinal hanger bars and the stirrups acted as the cathode. A constant current density of 1 mA/cm2 was passed through the reinforcement.
This current density was adopted on the basis of pilot tests to provide desired levels of
corrosion in a reasonable time. Each degree of corrosion was selected to provide a predefined percentage reduction in the longitudinal bar diameter (excluding the bent-up portion) within the timescale. The relationship between corrosion current density and the weight of metal lost due to corrosion was determined by applying Faraday’s law as shown in Eq. 1 [10]:
ω=AItZF (1)
5
Fig. 2: Reinforced concrete beams undergoing main reinforcement corrosion
The weight loss of metal due to corrosion can also be expressed as:
ω=aδγ (2)
where a = rebar surface area before corrosion (cm2); δ = material loss (cm); and γ = density of material (7.86 g/cm3).
The corrosion current can be expressed as:
I=ia (3)
where i = corrosion current density (amp/cm2).
Therefore, combining Eqs. 2 and 3 gives:
aδγ=AItZF=AiatZF (4)
Substituting known values into Eq. 4 and simplifying gives:
δ=(56)(i)(365)(24)(60)(60)(7.86)(2)(96500)=1165(i)cm/year (5)
Rewriting Eq. 5, where R is defined as the material loss per year (cm/year), gives:
R=1165(i)cm/year (6)
As an example, for a corrosion rate, i, of 1 (mA/cm2), R equals 1.165 (cm/year) (from Eq. 6). If, in a reinforced concrete structure, the period of corrosion after initiation is T′ years, then:
Metal loss after T′ years=RT′(cm) (7)
Therefore:
6
where Ø is the bar diameter. The expression (2RT′/Ø)(100)%, which represents reduction in bar diameter due to corrosion in T′ years, is also defined as the degree of reinforcement corrosion (see Table 1). Preliminary tests were carried out before commencing the program to confirm the reliability of the accelerated corrosion technique.
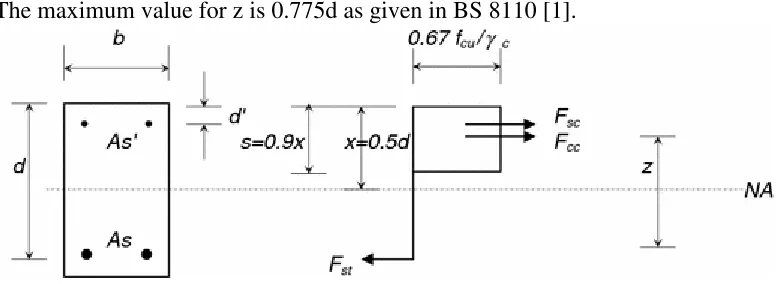
5 Analysis of beam section
An idealised stress block was used to determine the maximum compressive moment of resistance, M c , of the section as shown in Fig. 3. Taking moments about the centroid of the
tension steel A s :
Mc=(Fcc)(z)+(Fsc)(d−d′) (9)
where F cc and F sc are the compressive forces in the concrete and steel (hanger bars),
respectively.
[image:7.595.75.463.295.437.2]The maximum value for z is 0.775d as given in BS 8110 [1].
Fig. 3: Section with compression reinforcement
The ultimate concrete design stress is 0.67 f cu /γ c where the factor 0.67 relates the cube
crushing strength to the flexural strength of concrete [11] and γ c is the partial safety factor for
the strength of concrete for designing members cast in situ (normally 1.5). Referring to Fig. 2:
Fcc=(0.67fcu/γc)bs (10)
and
Fsc=γsfyA′s (11)
Substituting Eqs. 10 and 11 into Eq. 9 gives:
Mc=[(0.67fcu/γc)bs](0.775d)+γsfyA′s(d−d′) (12)
For the analysis of laboratory beams of known material properties, partial factors of safety, γ c
and γ s are taken as unity (the actual yield stress of steel was obtained from tests). Substituting
these into Eq. 12 and taking s = 0.45d gives:
Mc=[(0.234fcubd2)+f′yA′s(d−d′)]10−6 (13)
7
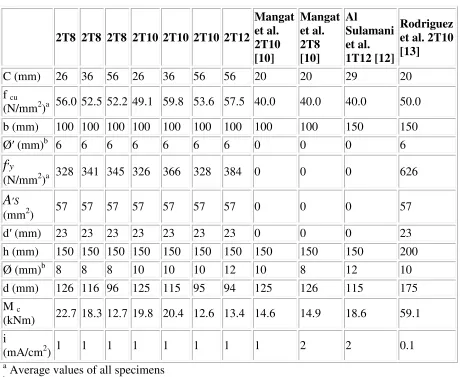
values of strength (28 day concrete cube strength and yield strength of steel) given in Table 2 were used to calculate M c . In addition, the corresponding properties of beams tested by other
[image:8.595.69.529.218.595.2]researchers are also presented in Table 2 to extend the M t(0)/M c range of beams considered
[10, 12, 13]. Some of these beams had tensile reinforcement only with the shear capacity provided by external means. In addition, certain details such as yield strength of the steel reinforcement and depth of concrete cover were not explicitly given and estimates were made from the information available in the papers. The corrosion rates ranged from 0.1 mA/cm2 to 2 mA/cm2.
Table 2: Beam properties
2T8 2T8 2T8 2T10 2T10 2T10 2T12
Mangat et al. 2T10 [10] Mangat et al. 2T8 [10] Al Sulamani et al. 1T12 [12] Rodriguez et al. 2T10 [13]
C (mm) 26 36 56 26 36 56 56 20 20 29 20 f cu
(N/mm2)a 56.0 52.5 52.2 49.1 59.8 53.6 57.5 40.0 40.0 40.0 50.0 b (mm) 100 100 100 100 100 100 100 100 100 150 150 Ø′ (mm)b 6 6 6 6 6 6 6 0 0 0 6
f′
y(N/mm2)a 328 341 345 326 366 328 384 0 0 0 626
A′
S(mm2) 57 57 57 57 57 57 57 0 0 0 57 d′ (mm) 23 23 23 23 23 23 23 0 0 0 23 h (mm) 150 150 150 150 150 150 150 150 150 150 200 Ø (mm)b 8 8 8 10 10 10 12 10 8 12 10 d (mm) 126 116 96 125 115 95 94 125 126 115 175 M c
(kNm) 22.7 18.3 12.7 19.8 20.4 12.6 13.4 14.6 14.9 18.6 59.1 i
(mA/cm2) 1 1 1 1 1 1 1 1 2 2 0.1
a
Average values of all specimens
b
Nominal values
6 Test results and discussion
The control and corroded beams failed in a ductile manner with no evidence of shear failure. After testing, the reinforcing bars were removed from the concrete, cleaned using a wire brush and re-weighed. The percentage loss in weight was subsequently calculated. The corrosion was generally spread along the length of the bars. Serious cross-section loss occurred at higher percentages of corrosion.
Control beams representing 0% corrosion were tested for each series of beams (Table 1) and the tensile moment of resistance [M t(corr) = M t(0)] was determined. The ratio M t(0)/M c
8
failure due to increasing levels of corrosion was obtained from M t(corr) = 0.25(P ult /2) (Fig. 1)
where P ult is the ultimate load as described in Sect. 3. The compressive moment of resistance,
M c , calculated from Eq. 13, remains constant for each series of beams (i.e. it is not affected
by the degree of corrosion of the tensile reinforcement) since it is based on the properties of both the concrete and steel in the compression zone. The relationship between M t(corr)/M c
and the percentage of corrosion is shown in Fig. 4. In addition, Fig. 5 shows the relationship between M t(corr)/M c and percentages of corrosion for beams tested by other researchers. The
M t(corr)/M c value at 0% corrosion in Figs. 4 and 5 represents the degree of
[image:9.595.71.324.209.528.2]under-reinforcement [M t(0)/M c ] of each set of beams.
9
Fig. 5: Degree of under-reinforcement (M t(corr)/M c ) against percentage of corrosion for other
researchers
Figures 4 and 5 show results from corroded beams reinforced with T8, T10 and T12 main steel and different covers (20–56 mm) to the main steel. The relationship is generally a linear decrease in M t(corr)/M c with increasing percentages of corrosion. The best fit linear equation
for each series of beams is tabulated along with the coefficient of correlation (R 2). Beam 2T10/26 (Fig. 4) exhibits the lowest coefficient of correlation of the series of beams under consideration (0.38). However, the remaining six series of beams in Fig. 4 and the four beam series in Fig. 5 all exhibit a very satisfactory coefficient of correlation. The accelerated corrosion process is a very complex phenomena and considering the different parameters tested by four different researchers (diameter of steel, cover to the main reinforcement, beam dimensions etc., Figs. 4 and 5), there is a very strong correlation between M t(corr)/M c and the
percent of corrosion.
The general relationship between M t(corr)/M c and percent of corrosion for the data in Figs. 4
and 5 is of the form:
(Mt(corr)/Mc)%=α(Corr%)+β% (14)
where α is the slope of each line of best fit and β is the intercept (M t(0)/M c ).
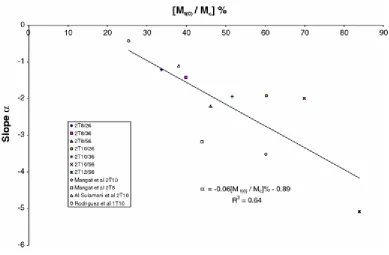
The values of α and β (together with cover and reinforcement details) for each set of beams are given in Table 3. The relationship between M t(0)/M c and the slope α is plotted in Fig. 6
and shows that the negative value of α generally increases with increasing M t(0)/M c . This
10
in beams with higher degrees of under-reinforcement (lower M t(0)/M c ). Therefore, use of
[image:11.595.70.482.140.393.2]beams with lower M t(0)/M c is desirable in practice.
Table 3: Overall comparison
Identification Slope
a
M t(0)/M c (%) Cover Reinforcement (%)
α β (mm) 100A s /bh
2T8/26 −1.210 33.7 26 0.67
2T8/36 −1.420 39.9 36 0.67
2T8/56 −2.200 46.1 56 0.67
2T10/26 −1.920 60.3 26 1.05
2T10/36 −1.990 51.6 36 1.05
2T10/56 −1.990 69.9 56 1.05
2T12/56 −5.080 83.9 56 1.51
Mangat et al. 2T10/20 [10] −3.520 60.2 20 1.05 Mangat et al. 2T8/21 [10] −3.180 44.0 21 0.67 Al Sulamani et al. 1T12/29 [12] −1.110 38.1 29 0.50 Rodriguez et al. 2T10/20 [13] −0.430 25.4 23 0.52
a
Slopes from Figs. 4–5
[image:11.595.72.461.419.674.2]11
7 Designing for durability
In order to optimise the design of beams for enhanced performance in a corrosive
environment, the designer should be aware of the main parameters which influence M t(0)/M c .
Maximum degree of under-reinforcement should be achieved since this leads to lower loss of strength when reinforcement corrosion occurs. Parameters which control M t(0)/M c include
percentage of main reinforcement, cover to the steel and size and number of reinforcement bars. The percentage of main steel reinforcement (100A S /bh) is plotted against M t(0)/M c in
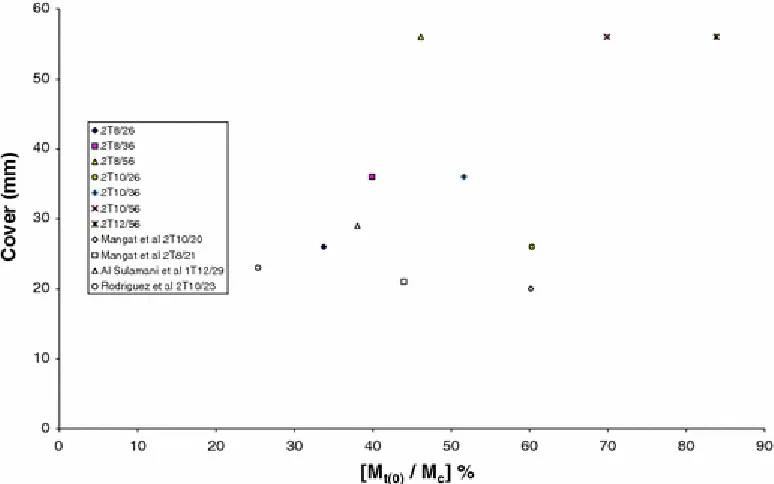
Fig. 7 for the 11 beams under consideration. The linear relationship shows that lower percentages of main steel result in lower M t(0)/M c , which is beneficial in the event of
corrosion of the main steel. Therefore, the designer should aim to reinforce the section with percentages as close as possible to the allowable minimum (0.13%). However, the reduction in reinforcement percentage should not be achieved by simply increasing the cover and, therefore, increasing the section size (bh) since, as shown in Fig. 8, no clear relationship exists between the cover and M t(0)/M c . Hence, the increase in cover to the main steel does
not relate to lower M t(0)/M c . Therefore, in design, sufficient cover should be provided to
[image:12.595.72.462.336.581.2]meet the code requirements for durability and fire resistance, but not unnecessarily increased simply to reduce the percentage of reinforcement.
12
Fig. 8: Cover against degree of under-reinforcement (M t(0)/M c )
It has been established that the bursting radial forces at the interface of reinforcement caused by corrosion products decrease with decreasing rebar diameter. Therefore, the use of a higher degree of under-reinforcement together with low diameters of tensile reinforcement is
recommended in design [14]. It has also been reported that bond strength decreases with increased bar diameter, so smaller diameter bars will help minimise the effect of corrosion induced bond failure [14].
8 Residual tensile moment of resistance
The data presented in this paper also allows an estimation of the residual tensile moment of resistance of corroded beams to be obtained. Values of M t(0) and M c will be available to the
design engineer, hence by rewriting Eq. 14, M t(corr) can be estimated from:
(Mt(corr)/Mc)%=α(Corr%)+(Mt(0)/Mc)% (15)
where (M t(0)/M c )% is the intercept β in Figs. 4 and 5 and Table 3. Multiplying Eq. 15 by M c
and dividing by 100 gives:
Mt(corr)=[Mcα(Corr%)/100+Mt(0)] (16)
where Corr% is the actual corrosion of the main steel in the in-service beam and α is calculated from the line of best fit representing the data in Fig. 5 as follows:
α=−0.06[(Mt(0)/Mc)%]−0.89 (17)
A factor of safety for concrete (γ c = 1.5) should also be applied to Eq. 16 to give:
13
Equation 18 gives the residual strength (tensile moment of resistance) of a corroded reinforced concrete beam once the degree of corrosion (Corr%) in the tensile steel is determined from a field inspection.
Equation 18 applies within the limits of the parameters covered by test data given in the paper. Further research is required to verify its validity to other parameters and beam sections, for example, Tee sections, which were outside the scope of this investigation.
9 Conclusions
The main conclusions from the results reported in this paper are as follows:
1. A higher degree of under-reinforcement (lower M t(0)/M c ) of reinforced concrete
beams results in lower loss of strength caused by reinforcement corrosion
2. Lower M t(0)/M c can be achieved in beam design through specifying areas as close as
possible to the required area of steel reinforcement and, therefore, keeping the percentage of main steel reinforcement as close as possible to 0.13%, the minimum permissible in codes of practice. Preference should be given to smaller diameters over larger diameter reinforcement bars
3. Increasing the cover to the steel reinforcement should not be used as a means of increasing the section size simply to reduce the percentage of steel reinforcement. The cover to the main steel reinforcement does not have an influence on M t(0)/M c and
cover should be based on durability considerations only in accordance with the codes of practice
4. An estimate of the residual tensile moment of resistance of corroded beams within the limits of the test data given in the paper can be obtained from the expression
Mt(corr)=Mcα(Corr%)/100+Mt(0)/γc
Acknowledgements:
The authors gratefully acknowledge the support of CPI Aps in providing the multi-channel power supply for inducing accelerated corrosion.
References:
1. British Standard Institution (1997) Structural use of concrete: code of practice for design and construction. BS 8110-1
2. BS EN 1992-2:2005 Eurocode 2 design of concrete structures. Concrete Bridges, Design and detailing rules. ISBN 0 580 46576 4
3. Moss RM, Webster R (2004) EC2 and BS8110 compared. Struct Eng 82(6):33–38
14
5. Comite Euro-International du Beton (1983) Assessment of concrete structures and design proceedings for upgrading. Information Bull 162:105–113
6. Walker M (1999) An overview of rehabilitation methods and selection of an
appropriate system. Proceedings of the international seminar on controlling concrete degradation, University of Dundee, UK, 7 September, pp 169–180
7. Davies H (1996) Repair and maintenance of corrosion damaged concrete: materials strategies. Proceedings of the international conference on concrete repair,
rehabilitation and protection, University of Dundee, Scotland, UK, 27–28 June, pp 721–733
8. Toutanji H, Delatte N, Aggoun S, Duval R, Danson A (2004) Effect of supplementary cementitious materials on the compressive strength and durability of short-term cured concrete. Cem Con Res 34(2):311–319
9. Wang Y, Liu B (2006) Study and application of salt-scaling resistant admixture in concrete. Environ Ecol Technol Concrete Key Eng Mater 302–303:105–110
10.Mangat PS, Elgarf MS (1999) Flexural strength of concrete beams with corroding reinforcement. ACI Struct J 96(1):149–158
11.Mosley WH, Bungey JH (1990) Reinforced concrete design. 4th edn. MacMillan Press Ltd., Basingstoke
12.Al-Sulaimani GJ, Kaleemullah M, Basunbul IA, Rasheeduzaffer (1990) Influence of corrosion and cracking on the bond behavior and strength of reinforced concrete members. ACI Struct J 87(2):220–231
13.Rodriguez J, Ortega LM, Casal J (1997) Load carrying capacity of concrete structures with corroded reinforcement. Con Build Mats 11(4):239–248