Inherited retinal degeneration (RD) damages light-sensing photoreceptors, resulting in loss of vision. RD is an umbrella term covering diseases that range in severity from Leber hereditary amaurosis (LCA), in which vision is severely affected from birth, to milder forms of RP that can leave central vision intact until old age, and macular degen-eration, which affects central vision only. RD represents the most common cause of visual dysfunction in people of working age in developed economies. Therefore, these condi-tions have significant adverse effects on patient quality of life and on the broader economy. Genetic linkage studies, functional genomics, and next-generation sequencing (NGS) technologies have provided opportunities to elucidate the
pathways of retinal development and homeostasis, in addition to the molecular pathogenesis of disease. A notable feature of inherited retinopathies is their genetic heterogeneity; multiple mutations in any one of more than 200 genes can cause RD. Retinitis pigmentosa (RP), a form of RD that results from rod photoreceptor defects, affects approximately 1 in 3,000 adults and can result from mutations in any one of more than70 genes [1-3] (RetNet). Regardless of the genetic mutation underlying individual forms of RD, however, photoreceptor cell death occurs gradually via apoptosis.
Gene therapies for some forms of RD have been inves-tigated; gene replacement therapies for diverse recessive retinopathies have shown promise in clinical trials [1,3-11]. With the exception of optogenetic-based gene therapies [1,12], gene therapy requires significant photoreceptor survival and therefore may not represent an optimal therapeutic strategy for advanced disease. Furthermore, gene therapies targeted to
Gene expression changes during retinal development and rod
specification
Fiona C. Mansergh, Matthew Carrigan, Karsten Hokamp, G. Jane Farrar
Smurfit Institute of Genetics, Trinity College Dublin, Dublin 2, Ireland
Purpose: Retinitis pigmentosa (RP) typically results from individual mutations in any one of >70 genes that cause rod photoreceptor cells to degenerate prematurely, eventually resulting in blindness. Gene therapies targeting individual RP
genes have shown efficacy at clinical trial; however, these therapies require the surviving photoreceptor cells to be viable
and functional, and may be economically feasible for only the more commonly mutated genes. An alternative potential treatment strategy, particularly for late stage disease, may involve stem cell transplants into the photoreceptor layer of the retina. Rod progenitors from postnatal mouse retinas can be transplanted and can form photoreceptors in recipient adult retinas; optimal numbers of transplantable cells are obtained from postnatal day 3–5 (P3–5) retinas. These cells can also be expanded in culture; however, this results in the loss of photoreceptor potential. Gene expression differences between postnatal retinas, cultured retinal progenitor cells (RPCs), and rod photoreceptor precursors were investigated
to identify gene expression patterns involved in the specification of rod photoreceptors.
Methods: Microarrays were used to investigate differences in gene expression between cultured RPCs that have lost
photoreceptor potential, P1 retinas, and fresh P5 retinas that contain significant numbers of transplantable photorecep
-tors. Additionally, fluorescence-activated cell sorting (FACS) sorted Rho-eGFP-expressing rod photoreceptor precursors were compared with Rho-eGFP-negative cells from the same P5 retinas. Differential expression was confirmed with
quantitative polymerase chain reaction (q-PCR).
Results: Analysis of the microarray data sets, including the use of t-distributed stochastic neighbor embedding (t-SNE)
to identify expression pattern neighbors of key photoreceptor specific genes, resulted in the identification of 636 genes differentially regulated during rod specification. Forty-four of these genes when mutated have previously been found to
cause retinal disease. Although gene function in other tissues may be known, the retinal function of approximately 61% of the gene list is as yet undetermined. Many of these genes’ promoters contain binding sites for the key photoreceptor transcription factors Crx and Nr2e3; moreover, the genomic clustering of differentially regulated genes appears to be non-random.
Conclusions: This study aids in understanding gene expression differences between rod photoreceptor progenitors versus cultured RPCs that have lost photoreceptor potential. The results provide insights into rod photoreceptor development and should expedite the development of cell-based treatments for RP. Furthermore, the data set includes a large number of retinopathy genes; less-well-characterized genes within this data set are a resource for those seeking to identify novel retinopathy genes in patients with RP (GEO accession: GSE59201).
the primary genetic defect underlying each form of RD poten-tially will require approximately 200 individual therapeutics due to the significant genetic heterogeneity in RD. Therefore, gene therapies for rarer forms of RD may be challenging, given timelines and costs associated with clinical trials.
Transplantation of stem cell–derived photoreceptor precursors into retinas with advanced disease may provide a complementary approach. A significant advantage of cell therapy should be the potential to treat diverse and advanced forms of RD, irrespective of genetic etiology or stage of degeneration. However, for stem cell approaches to be effec-tive, expandable sources of cells that can be routinely differ-entiated into the required cell types are required. The most abundant source of transplantable photoreceptors is currently the postnatal mouse retina. Freshly dissected early postnatal mouse retinal cells, when dissociated and transplanted into recipient eyes immediately, can integrate into host retinas and form functional photoreceptors [13-18]. The same cells can be expanded in culture, but cultured retinal progenitor cells (RPCs) switch off rhodopsin in the first 3–7 days of culture at the protein and RNA levels. Moreover, cultured RPCs do not form photoreceptors after transplantation; these cells are probably glial precursors [15,19]. Recent studies have indicated oligodendrocytic potential in RPCs, which is not present in native retinal cells. Growth factors commonly used in serum-free neural stem cell culture, epidermal growth factor (EGF) and fibroblast growth factor 2 (FGF2), may influence RPC potential; EGF in particular is known to promote gliogenesis [19].
The human developmental stage equivalent to early post-natal mouse retinas is a mid-gestation embryo, which makes donor transplantation ethically and logistically difficult [20]. Advances have been made in differentiating transplantable photoreceptors from embryonic stem (ES) cells [21-25], using three-dimensional embryoid body–based culture techniques that produce laminated optic cups with differentiating photo-receptors. ES cell use presents ethical barriers, which in prin-ciple can be overcome using induced pluripotent stem (iPS) cells that are similarly capable of photoreceptor differentia-tion [23,26,27]. However, the number of cells obtained from current ES and iPS cell differentiation protocols is still small. Protocol development may be enhanced by more detailed knowledge of gene expression cascades during photoreceptor development.
This study investigates differences in gene expression profiles between postnatal retinas, cultured RPCs, and rod photoreceptor precursors to identify genes involved in rod photoreceptor development and maturation. Genes upregulated during rod development have been identified
via microarray, comparing FACS-purified enhanced green fluorescent protein (eGFP0-positive rod cells from postnatal day 5 (P5) Rho-eGFP retinas to eGFP-negative cells from the remainder of the retina. Comparison of whole P1 and P5 retinas to cultured RPCs (which have lost the ability to become photoreceptors) was also undertaken. Use of t-distributed stochastic neighbor embedding (t-SNE) [28,29] allowed identification of closest expression “neighbors” to a subset of well-characterized genes with key photoreceptor functions. We have identified 636 genes that are potentially important in rod photoreceptor development and differentia-tion. Forty-four are previously identified RD disease genes (RetNet), while 207 have been highlighted as important to retinal and/or photoreceptor development in other retinal gene expression studies [16,30-42]. The retinal function of 61% of the gene list is unknown. These results represent a resource for elucidating rod photoreceptor developmental biology. The data set also contains a large number of genes known to cause retinopathy; less-well-characterized genes within this data set represent a resource for those seeking to identify novel retinopathy genes in patients with RP.
METHODS
Mice: Animals were housed and cared for under license from
the Irish Medicines Board/Department of Health and Chil-dren according to Irish and European Union (EU) legislation. Animals were housed and cared for under license from the Irish Medicines Board/Department of Health and Children according to Irish and European Union (EU) legislation. This legal framework is equivalent to guidelines published by the Institute for Laboratory Animal Research or the U.S. Public Health Service. Animal care adhered to the ARVO Statement for Use of Animals in Research. This legal framework is equivalent to guidelines published by the Institute for Labo-ratory Animal Research or the U.S. Public Health Service.
Retinas were extracted from postnatal day 1 and day 5 (P1 and P5) rhodopsin-eGFP (Rho-eGFP [43]) heterozygote mice, maintained on a 129Sv/J background. These mice express a human Rho-eGFP fusion protein that is visible in rod outer segments following transplantation. Heterozygotes were used as homozygotes show symptoms of retinal degen-eration [43]. Rho-eGFP retinas were also used as a source of cultured RPCs, to minimize possible gene expression differ-ences arising from varying genetic background.
Dissociation for FACS: Rho-eGFP P5 retinas were dissected
and placed in 1 ml Hank’s Balanced Salt Solution (HBSS; Lonza Biologics Ltd., Tewkesbury, UK). The ciliary margin was removed from the retinas before dissociation. Retinas
were incubated for 10 min at 37 °C, after 5 min, 10 μl of 10 μg/ ml DNase1 + 100 μl 20 mg/ml trypsin inhibitor were added,
and the samples were triturated. Cells were spun for 5 min at 350 ×g, resuspended in 1 ml PBS (Dulbecco’s Phosphate Buffered Saline, -CaCl2, -MgCl2, Catalogue number:
14190-094, Life Technologies, Paisley, UK) with 10 μl DNase1, and
then analyzed with FACS. Cells were sorted based on GFP expression on an Aria Fusion cell sorter (Becton Dickinson, Oxford, UK) [15,44]. Following FACS analysis, cells were
spun at 350 ×g for 5 min and resuspended in 100 μl PBS. Cells
were then subjected to RNA extraction.
Retinal dissociation for subsequent cell culture: Rho-eGFP
P4–5 retinas were placed in 1 ml PBS or HBSS following dissection. The ciliary margin was removed from the retinas before dissociation to avoid contamination by ciliary epithe-lial (CE) cells in subsequent cultures. Two hundred microli-ters of Accutase (Sigma-Aldrich) was added, the retinas were incubated for 5 min at 37 °C, allowed to settle to the bottom of the tube, and most of the supernatant aspirated away, 1 ml growth medium (Dulbecco’s modified Eagle’s medium nutrient mixture, F12 Ham, D8437, Arklow medium [DME/ F12], (Sigma), supplemented with B27 without vitamin A (Invitrogen), 1× L-glutamine (Lonza), 1×
penicillin/strep-tomycin (Lonza), 5 μg/ml heparin (Sigma), 20 ng/ml FGF2
(Peprotech, London, UK), and 20 ng/ml EGF (Peprotech) were added, and the retinas were dissociated by trituration with a fire-polished Pasteur pipette. Following dissociation, cells were counted four times using a hemocytometer and plated for culture.
Cell culture: RPCs were grown in T25 flasks (Sarstedt,
Drinagh, Wexford, Ireland) in 5 ml growth medium and incu-bated at 37 °C and 5% CO2. After initial plating, the medium was replaced after 5–7 days initially, and then every 2–7 days depending on cell density. Initial platings contained 1/1,000 gentamycin, which was not added to the medium after 7 days of culture. Cells were passaged when 80–90% confluent. About 0.5 ml 0.25% trypsin/EDTA (Lonza) or Accutase (Sigma-Aldrich) were added to each T25 flask, following the removal of medium and rinsing with 1× PBS. Flasks were incubated for 5–10 min until the cell monolayers lifted off. Cells were resuspended in 3 ml DMEM/F12, counted four times, and spun at 100 g. The supernatant was removed, and the pellets were resuspended in growth medium, replated, frozen, or treated with TRI reagent (Sigma-Aldrich). Early passage cells (P2–P5) were used for the array. Previous data [15] indicate that P0 cells plated for 7 days or longer have completely lost Rho-eGFP protein expression; cells of passage 2 or greater have largely lost all RNA expression of
cell types from the cultures). All cultures used for the array were morphologically similar and had attained the maximum growth rate at the point of harvest, thus minimizing variation in gene expression. Cells older than P9–10 are increasingly likely to have reached a Hayflick limit and/or to have become spontaneously immortalized, and were therefore excluded from the study. Cells older than P9–10 are increasingly likely to have reached a Hayflick limit and/or to have become spontaneously immortalized, and were therefore excluded from the study. The Hayflick limit is the point at which, after a certain number of cell divisions, normal somatic cells stop dividing, in association with critical levels of telomere shortening.
RNA extraction: Cell pellets were resuspended in 1 ml TRI
reagent (Sigma-Aldrich) and triturated using a P1000 pipetter, while the retinas were homogenized in 1 ml TRI reagent
using a 100 μl mini Dounce homogenizer (Fisher Scientific,
Dublin, Ireland). RNA was prepared according to the manu-facturer’s protocol, and then repurified using the RNeasy kit (Qiagen, Manchester, UK), incorporating the DNase step according to the manufacturer’s instructions. The RNA samples were assayed for concentration and quality using a Nanodrop ND1000 (NanoDrop Technologies, Wilmington, DE) spectrophotometer and a Qubit (Invitrogen, Paisley, UK). One to fifty dilutions of FACS-sorted samples were assessed with qPCR (see below) for enrichment of rhodopsin in the eGFP-positive samples.
Microarray experiments: RNAs passing quality control (OD
Array analysis:
Expression analysis—Raw array data were loaded and normalized using the Affymetrix package for R [45-47]. Expression across different conditions, together with associ-ated significance tests, were performed using R and Limma [48,49].
Dimensionality reduction for visualization: Dimensionality
reduction was performed using the Barnes-Hut-SNE imple-mentation [28] of the t-SNE algorithm [29]. Each probe was represented as a 20-dimensional vector, with each vector component representing its normalized expression in a single sample and condition. The set of all probe vectors was passed as input to the Barnes-Hut-SNE algorithm, which generated a two-dimensional output mapping designed to preserve the local and global structure from the 20-dimensional data set (inclusive of all replicates for all sample types). Due to the large size of the output and consequent difficulty finding individual genes by manual inspection or traditional image-editing tools, a web interface was programmed in Python that allows searches for individual genes and identifies nearest expression neighbors. The resulting t-SNE expression map for each gene is searchable. The Python code for this database is listed in Appendix 1. The nearest expression neighbors of key retinal disease genes (listed on RetNet) were mapped in relation to the whole data set. The closest neighbors of three clusters of disease genes were listed and investigated further.
Bioinformatic analysis: Initial analysis of Rho-eGFP-positive
cells (immature rod photoreceptors) versus Rho-eGFP-nega-tive cells was performed. More than 1,000 genes were found to be upregulated in the Rho-eGFP-positive cells, and another similarly sized cohort of genes was found to be
downregu-lated, with fold changes of less than −2 or greater than 2, and
p values of 0.01 or less (Appendix 2). Following the initial analysis, differentially regulated genes (adjusted p value
<0.001, fold change >2 or < −2) from two-way comparisons
of the five data sets (RPCs, P1 retinas, P5 retinas, Rho-eGFP +ve, and Rho-eGFP –ve retinal cells) were sorted. Genes differentially regulated in at least three comparisons were retained for bioinformatic analysis. RNA amplification can introduce significant error [50]; comparison of the FACS eGFP+ve versus eGFP-ve gene list with those from unampli-fied retinas or tissue culture cells increases the likelihood of identifying robust changes. Initial bioinformatic analysis was performed using the Gene, Online Mendelian Inheritance in Man (OMIM) and PubMed databases (NCBI), and the RetNet database (RetNet). Gene lists were submitted to the Data-base for Annotation, Visualization and Integrated Discovery (DAVID) v6.7 [51,52] to identify functional categories that were overrepresented in each gene list. Functional categories
that gave a Benjamini-Hochberg procedure corrected p value of <0.01 are presented as significantly overrepresented in each of the gene lists compared to what would be expected from the same number of randomly selected genes by chance.
Gene density calculations (gene location analysis): Gene
positions were translated into ranks along the chromosomes to allow to detect clustering without bias from varying inter-genic distances. The differences in ranks were calculated for the genes located on each chromosome and averaged using the median. The medians were compared against the median averages of 1,000 randomly selected sets of genes, with the gene sets the same size as the up- and downregulated lists. Box plots were generated in R to visually compare the average distance of the genes from the two lists with the average distances from the random lists [47]. One sample t test was performed in R to check for significance in the differences between the mean of the random averages and the averages obtained from the retinal gene lists.
Promoter analysis: The Affymetrix probe IDs were taken
from the lists of genes upregulated or downregulated in the Rho-eGFP FACS +ve versus Rho-eGFP –ve samples. The probe list was matched via the Biomart to Ensembl tran-scripts. These transcript IDs were used to extract the 2,000 bp upstream region of the transcription start site (TSS) via Biomart. With a tool called find_pssm_dna provided by the EBI, these sequences were searched for the Crx and Nr2e3 binding sites, which were retrieved as positional frequency matrices from Jaspar [53]. A probability of p<0.001 against an empirical estimate of nucleotide frequency background distri-bution [54] for 2,000 bp upstream of the TSS in mouse was used to refine the results. The p value of <0.001 is related to the low probability of these nucleotides occurring by chance. For each gene listed, the top-scoring site from all of the tran-scripts was extracted to an Excel spreadsheet (Appendix 3). A combined score for both transcription factors (TFs) was calculated by simple adding the top scores from each TF (an exact match to the consensus sequence gives a score of 100%). Using the composite 75% score as the cutoff identified 365 upregulated genes and 385 downregulated genes as likely to be regulated by Crx and Nr2e3 (supplementary data file 3). The cutoff value of 75% was chosen since the recommended value of 80% resulted in the loss of rhodopsin (known to be regulated by Crx and Nr2e3) from the data set and was therefore considered overly stringent.
120–250 bp, with shorter fragments preferred. Introns were included in amplified segments where possible, to prevent amplification of genomic DNA. Primers were designed using PrimerBlast with an optimal Tm of over 60 °C (the tempera-ture of the amplification step). RNAs were diluted 1/100 fold for the RPC and whole retinal samples, and 1/50–1/25 fold for the FACS-derived RNA samples (depending on the starting concentrations). Q-PCRs were performed using RNA with the two-step QuantiTect kit (Qiagen) as described previously [15,58]. Q-PCRs were assembled on 96 well plates (Applied Biosystems, Paisley, UK) and run on 7300 and 7500 series
q-PCR machines (Applied Biosystems). The ΔΔCt method
was used to calculate fold changes, using beta-actin as a housekeeping standard and the P1 retina as the calibrator. The q-PCRs of the retinopathy genes (Crx, Nrl, Nr2e3, Rho) were included in analysis to check that our qPCRs accurately repre-sented their known expression patterns. Primer sequences are noted in Table 1. The samples were run in triplicate, and at least three biologic replicates were performed, giving total replicates of at least nine. Adult retinal samples were also included in q-PCRs as positive controls; water blanks and no-RT controls were also run. Error bars were calculated via standard error of the mean (SEM). Results were also analyzed using Student t tests.
RESULTS
Transplantable photoreceptor precursors, which peak in trans-plantation efficiency from P3–6, are post-mitotic [15-18,20]. To assay gene expression changes leading to photoreceptor differentiation, microarray analysis was used, with compari-sons of P5 retinal Rho-eGFP-positive and -negative cells, whole retinal samples at P1 and P5, and cultured RPCs, which have lost the potential to become photoreceptors [15,20]. Rho-eGFP-positive cells represent rod photoreceptor precursors, while Rho-eGFP-negative cells represent other differentiated neuroretinal cell types and any remaining unspecified cells. Up- and downregulated gene lists (Appendix 2) were derived from the Rho-eGFP-positive and -negative array data, giving a comprehensive list of genes significantly differentially regulated in recently specified rod precursors. Given the potential error associated with RNA amplification [50], this gene list was compared with lists derived from two-way comparisons of array data from unamplified RPCs, P1 and P5 retinal RNA. Genes differentially regulated in at least three out of four comparisons (Rho-eGFP positive versus Rho-eGFP negative, RPCs versus P1 retinas, RPCs versus P5 retinas, P1 versus P5 retinas) were prioritized (Table 2, Table 3, Table 4, Table 5). Notably, these data represent a unique
with cultured RPCs, which have lost photoreceptor potential [15-18,20]. However, FACS-purified Nrl-eGFP, Crx-eGFP, and Rho-eGFP cells have previously been arrayed [16,33,34], to identify cell surface proteins suitable for antibody-based FACS of non-genetically modified cells, or to establish cone precursor expression patterns.
A shortlist of genes differentially regulated in at least three out of four comparisons was generated. These genes were divided into categories: 228 genes were upregulated in eGFP+ve samples, and differentially regulated in at least two other comparisons (Table 2), and 235 genes were downregu-lated in eGFP+ve samples, and differentially regudownregu-lated in at least two other comparisons (Table 3). A further 92 genes were differentially regulated in all comparisons of RPCs and P1 and P5 retinas, but showed no differences between the two FACS-sorted samples, implying even expression across the neural retina at P5 (Table 4). Thirty-six retinal disease genes were contained in the upregulated gene set, while three appeared in the downregulated or differentially regulated gene lists. Disease genes listed in RetNet are highlighted in bold italics (Table 2, Table 3, Table 4, Table 5). Searches of the Gene, OMIM, and PubMed databases for each gene revealed that 61% of the total gene list remains unconnected with the retinal literature; a retinal function for 39% was noted.
Pr
ime
r n
ame
Se
qu
en
ce
Pr
ime
r n
ame
Se
qu
en
ce
Fg
f1
5R
TC
CT
G
G
A
G
CT
G
TT
CT
CT
G
G
G
Se
m
a7
aR
CG
G
C
TC
A
TG
G
A
A
A
A
G
CA
CG
G
Fo
xo1
F
G
C
CA
C
TCG
CG
G
G
A
CA
G
Sh
is
a2
F
CAG
A
C
C
G
AG
A
AG
G
C
C
CAG
A
Fo
xo1
R
A
G
TA
G
G
G
CA
CG
C
TC
TTC
A
C
C
Sh
is
a2
R
TCT
G
CT
G
G
G
G
A
TC
CT
G
CT
TT
Gl
o1
F
TG
G
G
A
TTG
C
C
G
TT
C
C
TG
A
TG
Sl
c2
5a
33
F
C
TC
C
TG
CA
TCG
C
TT
A
C
C
CA
C
Gl
o1
R
C
C
TC
A
A
A
G
G
CA
CA
TTC
TC
C
CG
Sl
c2
5a
33
R
CA
G
TC
C
TCG
G
TA
G
A
A
G
G
CG
A
Ig
sf
9F
GG
C
CA
GGG
TC
A
GG
TG
CA
A
Sox
2F
C
TA
G
A
C
TC
C
G
G
G
C
G
A
TGA
A
A
Ig
sf
9R
A
G
TTG
A
C
TG
TA
C
TG
TTG
C
TG
G
G
Sox
2R
TG
C
C
TT
AAA
CAA
G
A
C
CA
C
G
AA
K
cn
k1F
C
G
TG
TT
C
TC
TG
TG
C
TG
G
A
G
G
St
x3F
G
GA
TG
A
A
G
GA
C
C
G
G
C
TG
G
A
G
K
cn
k1R
CA
A
C
CA
G
CA
TG
G
C
G
A
TG
A
G
T
St
x3R
A
G
C
CG
TG
TT
TC
C
TCG
A
TC
TC
A
K
if
9F
CA
TG
A
CA
GGGG
CA
A
C
GG
A
G
A
Vo
pp
1F
G
C
CA
C
CA
C
TCA
TT
G
A
G
G
A
G
C
K
if
9R
:
AG
G
G
CAG
AG
TG
G
A
CAG
G
AG
A
Vo
pp
1R
G
C
C
TC
C
G
TG
A
G
G
TG
A
A
TTG
G
K
lc
3F
A
A
CA
A
CC
TG
G
CC
TC
A
G
CC
TA
Vs
x2
F
C
TG
TG
C
C
C
CA
TG
G
C
TA
C
TG
K
lc
3R
TC
C
TCG
C
C
TG
A
TG
G
A
TTC
C
C
Vs
x2
R
C
CG
TTC
C
TC
C
TG
C
TC
CA
TC
T a b l e 2 . G e n e s u Pr e G u l a T e d in r o d s , a s d eT e r m in e d by u Pr e G u l a T io n in f a c s e d r h o -e G fP Po si T iv e c e l l s a n d e x Pr e s -si o n c h a n G e s in a T l e a sT 2 /3 o T h e r c o m Pa r is o n s (r Pc v e r su s Pn 1, r Pc v e r su s Pn 5, Pn 1 v e r su s Pn 5) . Up re gu la te d g en es . Up re gu la te
d + N
Up
re
gu
la
te
d g
en
es
.
Up
re
gu
la
te
d + N
ei
gh
bo
ur
s
C
st
3 [
31
]
N
ap1
l1
Tm
em
13
5
H
cn1
[
38
]
R
pg
r [
32
]
Zr
an
b1
Ct
bp
2 [
31
]
Na
pg
Tm
em
216
Ic
m
t [
31
]
R
pgri
p1
[
31
,
32
,
34
,
38
-40
]
D
ct
n1
[
31
]
Nf
ic
[
37
]
Tm
em
30
a [
31
]
Im
pd
h1
[
32
,
38
]
R
raga
Dh
rs
3
Np
nt
Tm
em
42
K
cn
b1
[
31
,
37
]
R
s1
[
31
,
32
,
34
,
35
,
38
,
40
]
Dl
g4
[
16
,
37
]
Nt
5e
[
16
,
34
]
Tm
em
9 [
31
]
K
lc3
[
31
]
Rt
bd
n
D
nm1
N
xn
l1
[
40
]
Tp
p1
K
rt18
R
xr
g [
30
]
Dn
m
t3
a [
31
]
O
at [
38
,
40
]
Tr
im
3
Llg
l2
[
34
]
Sa
g [
31
,
34
-36
,
38
,
40
]
Eb
pl
O
sg
ep
[
40
]
U
qc
r11
Lp
ga
t1 [
31
,
37
]
Epb
4.
1l
2 [
31
]
Pa
qr
4
Va
m
p2
Lr
rc
48
Genes
in
bold
and
italic
are
listed
in
RetNet,
those
identified
in
other
studies
are
indicated
by
the
relevant
reference
number
in
red.
Overlaps
with
the
Neighbors
data
set
are
listed
D
ow
nr
eg
ul
at
ed g
en
es
.
C
fl1
[
30
]
G
pr
56
Nf
ib
[
35
]
Se
rp
in
i1
Ebf
3
Ch
n2
G
pr
c5
c
Nf
ix
[
31
,
35
]
Sf
xn
1
Ef
nb2
[
37
]
C
ho
dl
G
rb1
0
N
gf
r
Sg
k3
El
av
l3
C
not
2 [
35
]
Gr
n
N
hs
l1
Sh3
bp4
H
m
x1
C
nt
na
p2
[
32
]
G
st
m1
N
m
e2
Si
x3
K
cn
k1
C
ol
18
a1
H
19
[
35
]
N
ot
ch
2
Sk
ap2
K
if5c
[
32
]
C
ol
2a1
[
38
,
40
]
H
2af
y2
N
pc
2
Sl
c1
a3
K
lc
1,
L
O
C1
00
04
76
09
C
ra
bp1
H
bb
-b
1/
H
bb
-b
2
O
lf
m1
[
32
]
Sl
c1
a4
Me
g3
C
rm
p1
H
kd
c1
O
lig
2
Sl
c3
2a
1
Pm
ep
a1
C
ry
m [
41
]
H
m
gb
2 [
37
]
Pa
k1
Sm
ad
2
R
ia
n
C
sn
k1e
Ier5
Pa
x6
[
30
,
31
]
Sm
arc
e1
St
m
n1
C
sr
p1
[
37
]
Ig
fb
p2
Pb
xip
1
So
cs2
Tbx
2
C
tsc
Il17
ra
Pc
p4
Sox
5
Vs
x2
C
yp
26
a1
Ina
Pc
yo
x1
So
x6
Zf
p53
2
D
ag1
Is
l1
[
31
,
37
]
Pd
lim
5
Sp
ar
c [
31
]
D
bi
Itg
av
Ph
lp
p1
Sp
c2
5
Genes
in
bold
and
italic
are
listed
in
RetNet,
those
identified
in
other
studies
are
indicated
by
the
relevant
reference
number
in
red.
Overlaps
with
the
Neighbors
data
set
are
listed
Table 4. Genes differenTially reGulaTed in all comParisons of rPc versus Pn1, rPc versus Pn5, Pn1 versus Pn5 (buT noT siGnificanTly chanGed beTween facs PosiTive and neGaTive samPles). Differentially regulated genes
ENSMUSG00000063277 Grina Rbpms
1200009O22Rik H3f3b [31] Rffl
1700020C11Rik [31] Hba-a1, Hba-a2 [31] Rnmt
1810009A15Rik Hist2h2aa1, Hist2h2aa2, Hist2h2ac,
Hist2h3c1 Rpl19
2310028O11Rik Hmgn1 Sdha
2310044H10Rik Hsd17b4 Sfrs14 [31]
2410017P09Rik Hspe1 Snrnp40
Acadl Jam2 [31] Snrpn /// Snurf [37]
Ak3l1 /// LOC100047616 Lhx9 Sox6
Asf1a LOC100044115, Rin2 Sub1
Atp5k LOC100044139, Snrpn, Snurf Tspan31
Banf1 LOC100045551, Ppm1d Tspan7
BC016201 [31] LOC100046232, Nfil3 Tuba1a
Cadm3 LOC100046704, Nras Txn1
Calb1 LOC100047393, Nae1 Uba2
Chrna6 LOC677317, Me1 Ube2d2
Cox6b1 Mcm7 [30] Ube2e1
Cox7c, LOC100047065, LOC100048613 Mdfic Vsnl1 [31]
Cplx3 Med19
D0H4S114 Ndrg1 [37] Diff regulated + Neighbours
Dab2ip Ndrg4 Otx2 [30,34]
Deb1 Ndufa6 [31] Stxbp1 [31]
Dohh Nlk [31]
Eef1b2 Notch4
Eef1g, LOC100047986 P4hb
Extl3 Pcdhga1-12, Pcdhgb1-8, Pcdhgc3-5
[31]
Fam108a Phactr1 [31]
Fam125a Phb
Fkbp3 Pip5k1a
Gba2 Pkig [31]
Gdpd5 Pnkd
Glo1 [31] Polr2e
Hist1h2bc, Hist1h2be, Hist1h2bl,
Hist1h2bm, Hist1h2bp, LOC100046213 Prdx3 Gm5256, Gm5529, Slc25a5 Prkar1b [31]
Gm6293, Uqcr10 Prnp [31]
Gm9800, Ptma Psrc1
Genes in bold and italic are listed in RetNet, those identified in other studies are indicated by the relevant reference number in red. Over
E
xp
re
ss
io
n p
at
te
rn n
ei
gh
bo
ur
s o
f s
el
ec
te
d r
et
in
op
at
hy g
en
es
C
pl
x4
[
16
,
34
],
Fy
co1
Me
g3
Pr
om1
[
16
,
31
,
34
,
38
,
40
,
42
]
Sl
c2
7a
2
Zf
p53
2
C
rm
p1
Gd
pd
3
Mp
p4 [
35
]
Pr
r14
Sl
c7a
8 [
16
]
Zr
an
b1
identified via differential regulation in at least three samples, while 81 genes were highlighted with t-SNE. Our t-SNE data-base is publicly available and searchable via input of a gene name (Entrez Gene ID; e.g., Rho for rhodopsin). A plot of its expression neighbors is then shown (t-SNE).
Confirmation of gene expression patterns: Retinal
expres-sion patterns indicated by the array were investigated in 42 genes via qPCR. Genes selected for qPCR included those with well-characterized roles in retinal development and disease (Rho, Nrl, Crx, Nr2e3), characterized genes with as yet unknown retinal functions, and relatively uncharacterized ESTs. The qPCR gene list included upregulated, downregu-lated, and differentially regulated genes and a number from the t-SNE neighbors list (Table 2, Table 3, Table 4, Table 5). The direction of expression change was confirmed in 94% of cases where unamplified RNA was used (P1 and P5 retinas, cultured RPCs), and in 90% of cases where amplified RNA was arrayed (Rho-eGFP-positive and -negative FACS samples), suggesting that the data set is robust. Notably, the amplified FACS samples showed a lower validation rate than the unamplified samples, thus supporting the approach of comparing the FACS-derived gene lists with unamplified retinal samples for gene prioritization. Representative q-PCR results are shown in Figure 2; complete q-PCR results are given in Appendix 4.
In silico analysis: The genes listed in Table 2, Table 3,
Table 4, Table 5 were analyzed for known function, known disease-causing mutations in humans and model organisms,
[image:15.612.60.562.72.325.2]ceasing cell division, then maturing and generating greater connectivity between three-dimensional retinal layers.
Promoter analysis: Promoter regions of genes upregulated
in rod precursors were analyzed for common transcription factor motifs, using 2 kb immediately upstream of the TSS. Results indicate that motifs for 116 transcription factors are
[image:16.612.77.502.71.315.2]overrepresented in the data set, including Nr2e3 (Gene ID: 23958, OMIM: 604485; a nuclear receptor and rod photore-ceptor transcription factor), Pax6 (Gene ID: 18508, OMIM: 607108) and Sox2 (Gene ID: 20674, OMIM: 184429; genes involved in eye specification that can cause anophthalmia and microphthalmia when mutated). A further study was Figure 2. Q-PCR confirmation of expression pattern changes, selected genes. X-axis: samples; R PC=R PCs, P1=P1 reti na, FACS-=Rho-eGFP negative cells, FACS+=Rho-eGFP positive cells, P5=P5 retina, Ad ret=adult retina. Y-axis: normalized fold changes where P1 is set at 1. Since Rho-eGFP-negative cells are derived from all non-retinal cells other than rod photoreceptors, and do not represent a pure cell type, we have shown more genes upregulated in Rho-eGFP-positive cells; these are also more likely to be involved in retinitis pigmentosa (RP). This is not representative of the data set as a whole; numbers of up- and downregulated genes are approximately equal. The q-PCR data for all genes tested are shown in Appendix 4.
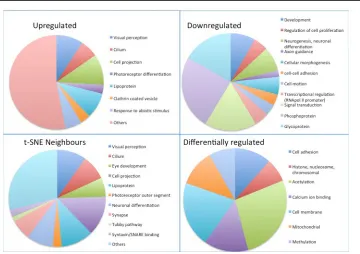
Figure 3. Functional breakdown of upregulated, downregulated, differentially regulated, and “neighbors” data sets. The differen-tially regulated data set represents genes differentially regulated in all comparisons of retinal progenitor cells (RPCs) versus P1, RPCs versus P5, P1 versus P5 but not significantly changed between
fluorescence-activated cell sorting
(FACS) positive and negative samples. Pie charts were generated in MS Excel from the categories
most significantly overrepresented
[image:16.612.59.419.461.715.2]the photoreceptor transcription factors Crx and Nr2e3 in the 2 kb region upstream of the TSS of all genes either up- or downregulated in FACS-sorted photoreceptors. Crx controls expression in both rods and cones, while Nr2e3 is rod specific. These two transcription factors were chosen because their consensus binding sites were most amenable to analysis. Five hundred thirty-eight upregulated genes and 582 downregulated genes were identified as containing 75% of the maximum score for presence of Nr2e3 (rod-specific) and Crx (photoreceptor-specific) transcription factor binding sites in the 2 kb immediately upstream of the TSS (p<0.001 for each binding site, using the lower 75% limit suggested by oPOSSUM v2.0 [59] since the default 80% cutoff resulted in the loss of Rho and other genes known to be regulated by these transcription factors). This list represents genes more likely to be regulated by Crx and Nr2e3 (Appendix 3); those upregulated in Rho-eGFP-positive cells are likely to be preferentially expressed in rod photoreceptors. This data set was compared with a previously published study of genes dysregulated in Crx, Nr2e3, and Nrl null mice and containing Crx binding sites as determined with CHIP-seq. The prior study identified 6,000 genes with possible Crx binding sites, of which 734 were dysregulated in various retinal mutant mouse lines [32]. A comparison of that data set with this one shows an overlap of 68 genes in the upregulated list and 25 in the downregulated list [32], an overlap that comprises 13% of their data set and 8% of ours.
Genomic location of differentially regulated genes: The
genomic locations of the genes in the FACS upregulated and FACS downregulated data sets (Appendix 2) were examined, to determine if there was any evidence for gene clustering in specific areas of the genome, suggesting some form of coordinated regulation, or whether the expression control mechanisms are coordinated irrespective of location. The median distance between neighboring genes on the same chromosome was calculated for the current data sets, and compared with the medians generated from 1,000 randomly generated data sets comprising the same numbers of genes. The results are provided in box plot format in Figure 4; the location of the genes in the up- and downregulated gene sets is outside the 95% confidence interval, suggesting non-random arrangement of genes in up- and downregulated gene sets. A one-sample t test yielded p values <2.2e-16 for the up- and downregulated lists. The 95% confidence intervals are Up: 22.43 to 22.53, Down: 19.1 to 19.18. In comparison, the eGFP-positive and -negative gene lists are at 17 and 15, respectively, clearly well outside the 95% confidence interval. These results are therefore unlikely to have occurred by
tional clustering or clustering as a result of ancestral gene duplication events.
Overlaps with other studies: Several previously published
array and/or next-generation sequencing studies have been identified, aspects of which should theoretically overlap with the current study. These studies include developmental time courses using c57Bl6/J or Balb/C wild-type mouse retinas [30,31], genes that varied in expression between mouse strains during retinal development [39], expression profiles in the adult retina and in various adult retinal cell types [38,40], comparisons of the Otx2 null retina (which lacks photore-ceptors) [35] and the RD1 retinal degeneration model, with wild-type [37], comparisons between Notch1 conditional knockouts, which overproduce rods, with wild-type retinas [41], comparisons of the “cone only” Nrl knockout retina with wild-type [36], CHIP-seq analysis of genes containing Crx binding sites [32], expression profiles of Rho-eGFP-positive and -negative retinal cells at P4 [16,42], comparisons of Nrl-eGFP-positive and -negative cells at P4 [34] and Crx-eGFP-positive and -negative cells at E17.5 [33]. The significantly differentially regulated gene lists from these papers were compared with those generated in this study to highlight genes identified in multiple experiments. Four hundred twenty-nine genes are uniquely identified in the current study, while 121 upregulated, 43 downregulated, 20 differen-tially regulated, and 99 neighbors genes have been identified in similar studies (due to the overlap between the neighbors data set and the others, the total number of genes in this study also identified elsewhere is 207, of which 73 were present in more than one other study). Retinal disease genes, especially those known to be rod specific, are highly represented in all studies with enriched populations of rod photoreceptors as would be anticipated. Interestingly, overlaps with prior adult retinal gene expression studies were also significant, given that this data set was generated using the developing retina. Overlaps are indicated (via reference number in red) in Table 2, Table 3, Table 4, and Table 5.
DISCUSSION
potential. This study has indicated that immature rods and the remainder of retinal neurons show non-random genomic locations of expressed genes, a novel finding that offers important inferences regarding the developmental control of neuronal gene expression and the evolutionary history behind this. The presence of Crx and Nr2e3 sites in up- and downregulated genes was corroborated by a previous study [32] but also offers important clues to the complexities of developmental gene expression regulation in retinal neurons. In terms of techniques, the t-SNE approach is novel regarding retinal samples and has not been widely used in array research to date. Although less comprehensive in terms of identifying every differentially regulated gene, t-SNE is a great method for identifying genes with similar expression patterns to known disease genes and may be useful in any genetic disorder where some, but not all, causative genes have been identified. We have also attempted to ameliorate bias via a comparison of whole retinal/tissue culture samples (unamplified RNA) with amplified RNA from FACS sorted immature rods (Rho-eGFP positive) and remaining retinal neurons (Rho-eGFP negative), a technique that has worked
well in terms of allowing prioritization of interesting novel genes.
Using two different methods of analysis, 636 genes were identified that are differentially regulated in retinal and rod photoreceptor development. In searching for genes differentially regulated in multiple comparisons, or that closely resembled known retinal genes, the process was extremely rigorous. Comparison between FACS Rho-eGFP-positive cells (immature rods) and Rho-eGFP-negative cells yielded 3,320 genes with an adjusted p value of <0.01 and
a fold change of greater than 2 or less than −2 (Appendix
[image:18.612.61.495.365.727.2]2). This list was used for promoter and location analysis; but for in-depth evaluation, a subset of genes that also show expression changes between RPCs and P1 and P5 retinas was chosen, to minimize the risk of error introduced by RNA amplification, and therefore to reduce the number of false positives under investigation. However, using the priority gene list alone may result in numbers of interesting genes being left out of analysis owing to differential regulation not being detectable in whole retinas or RPCs, a risk that may be particularly high with transcription factors or other genes
Figure 4. Gene location box plot: Randomly chosen gene sets of 1,175 genes (up) and 1,387 (down) were run 1,000 times, and a median intergenic distance across all of these runs was calculated. Intergenic distances are measured in terms of the average number of genes between any two neigh-boring genes located on the same chromosome (y-axis). The median and interquartile range (IQR) for the randomly selected gene sets are shown in the center of the box plots, with the whiskers showing 1.5× IQR. Outliers from the randomly generated gene sets are shown as black circles; our real data sets are indicated via red diamond and are more tightly clustered than would be expected by chance. A one-sample t test yielded p values <2.2e-16 for the up- and
down-regulated lists. The 95% confidence
the larger data set is publicly available here (Appendix 2), via GEO (accession GSE59201), and via our searchable t-SNE database, as a resource for the retinal community. A large number of genes were investigated with qPCR to test the accuracy of the results. These included 43 genes identified by the array, and two genes important to visual specifica-tion or retinal biology that were not identified by the array. We included four genes involved in initial visual patterning: Pax6, Sox2, Mitf (Gene ID: 17342, OMIM:156845) and Otx2 (Gene ID: 18424, OMIM: 600037). These are induced so early in eye development that they were theoretically unlikely to be detected, but in fact, only Mitf was not identified as differ-entially regulated in any categories. Another gene, arrestin
(Arr3; Gene ID: 170735, OMIM: 301770), was represented on
the array and was massively upregulated in rods via qPCR, but was not detected by the array, probably as a result of an ineffective probe. Overall, 11/13 “known” visual genes for which we had preexisting primer sets were detected by the array and confirmed with qPCR, suggesting a “false nega-tive” rate of approximately 15%.
Regarding the inability to derive functional photorecep-tors from RPC cultures, it is significant that a large number of retinal disease genes and their neighbors, including tran-scription factors vital to rod development, are significantly downregulated in RPCs, many to the point of being unde-tectable with RT–PCR [15]. The 60% of genes with as yet uncharacterized retinal functions constitute a resource for further identification of genes that may be able to influence proportions of rods obtained from ES or iPS cell cultures, particularly those likely to function as growth or transcription factors. The growth of RPCs in Egf- and Fgf2-containing medium seems to be biasing development toward glial fates, including myelinating oligodendrocytes not normally found in the neural retina [19]; significant discovery of alterative mitogens may be required before RPCs can be persuaded to adopt neural fates after differentiation. However, Müller glia adopt their final differentiated status later than rods and are capable of limited cell division even in the adult retina. Postnatal retinas may contain neural precursors that are too terminally differentiated to offer an expandable source of any neuronal cell type; RPCs may represent a glial population only.
Use of t-SNE as an adjunct search tool for genes of interest has thrown up some interesting findings. t-SNE allows visualization of the 20-dimensional (5× samples, 4× replicates per sample) gene expression data per probe in two dimensions. Mapping the global expression data from our data set with RetNet disease genes overlaid (Figure 1)
sion. Genes mapping within these clusters are expected to show similar expression patterns and may be candidates for retinal disease or have important retinal functions, or both. In the context of this experimental paradigm, the neighbors approach preferentially identifies genes upregulated in rod photoreceptors, as the nearby clustered RD disease genes are also upregulated in rods. The clusters are located within the same 20% area of the overall plot, suggesting that they should show some degree of similarity to each other, in addi-tion to similarities within the clusters (Figure 1). QPCRs of the genes derived from the neighbors data set all show upregulation of expression in Rho-eGFP-positive cells and in the P5 retina regarding the P1 retina and RPCs (Figure 2; see neighbor pairs Rho + A530058N18Rik, Crx + SamD11,
Nrl + BC022687). Notably, A530058N18Rik and SamD11
are uncharacterized genes with no retinal functions noted in PubMed to date.
The data set was used to interrogate whether genes upregulated (or downregulated) in rods, a homogenous neuronal cell type, possessed a non-random genomic location. In theory, coordinated regulation of such genes in the retina may involve positional clustering. Notably, 1,000 repeats of random assortments of gene groupings of the same size as our data sets gave median gene separation distances that were significantly different from the non-random array–based data sets generated in this study. For this analysis, the more extensive gene lists (those upregulated and downregulated in Rho-eGFP-positive rod precursors) were used. These data therefore provide some evidence for rod-specific gene expres-sion being influenced by the genomic location of the genes, which are more tightly clustered than would be expected by chance (Figure 4). This is the first demonstration of such an effect in retinally expressed genes, but might be the expected result of evolutionary gene duplication and diversification of function as retinas became more complex.
the genes we identified as containing Crx and Nr2e3 binding sites) was identified. The differences between the studies may be partially explained by differing methodologies and by their use of Crx sites alone; Crx controls gene expression in cone and rod photoreceptors, not just rods, whereas Nr2e3 is rod specific. Given the presence of Crx binding sites in so many retinally expressed genes (>6,000), their findings suggest that the binding sites may be subject to complex regulation, including the negative regulation of some non-photoreceptor genes in photoreceptors [32]. The finding from this study of
Nr2e3 and Crx binding sites in genes downregulated in rod
precursors therefore correlates and enhances those results [32]. Alternatively, it may be that these binding sites are used for positive regulation at developmental stages not evaluated in either study.
Analysis of overrepresented functional categories within gene lists provided results that might have been anticipated. The upregulated and neighbors data sets showed the most significant overrepresentation of functions associated with vision, photoreceptor development and function, and ciliary function, suggesting elaboration of the photoreceptor cilium that connects the cell body with the outer segment is an important function of retinal progenitors at this stage. These data may pinpoint less-well-characterized genes in this data set as candidates for retinal ciliopathies. The downregulated data set shows overrepresentation of developmentally regu-lated genes, transcription factors and neuronal development, and axon guidance functions, possibly reflecting the fact that all other retinal neurons, at P5, have been specified for longer than rod photoreceptors [60], are post-mitotic, and are most likely pruning and optimizing connections with other parts of the retina at this point in time. Genes that vary between RPCs, and whole P1 and P5 retinas (without significant change between Rho-eGFP-positive and -negative retinal cells at P5) are evenly expressed across the whole neural retina at P5, but are up- or downregulated compared to an earlier developmental stage and compared to cultured RPCs, which are still dividing. This gene list shows overrepresenta-tion of cell attachment, histone-related, acetylaoverrepresenta-tion, methyla-tion, and mitochondrial functions. The retina at the points in time studied is in the process of specifying the chromatin structure to optimize gene expression in the configuration required by its maturing post-mitotic neuronal populations, while cultured RPCs are still dividing, lack organizational layers, and are comprised of glial progenitors. Notably, the retina requires more energy than almost any other tissue [1,58]. Speculatively, overrepresentation of mitochondrial genes might be related to retinal development, which is setting up to facilitate the high energy requirements of the
mature retina, while RPCs in culture may have energy needs that are significantly lower.
Several other large-scale expression studies have been undertaken in retinas, both wild-type and genetically modi-fied [16,30-42]. Overlaps with these studies total 207 genes (Table 2, Table 3, Table 4, Table 5). The most significant overlaps were noted with developmental studies, those where rod photoreceptors were enriched, and with the adult retina. Seventy-three genes were noted in two or more studies (these are noted in Table 2, Table 3, Table 4, Table 5; where two or more reference numbers are present beside the gene name). Many are key retinal disease genes (in italicized/bold font; Table 2, Table 3, Table 4, Table 5). Interestingly, some genes with relatively uncharacterized retinal functions were also noted in this category; the functions of a selected few are highlighted in Table 6. Retinal expression patterns indicated by the array were investigated in 42 genes via qPCR, ranging from known disease genes such as Rhodopsin, Nrl, Crx, and
Nr2e3, to relatively uncharacterized ESTs. Eight of these
genes showed high levels of upregulation in Rho-eGFP-posi-tive cells (Figure 2), in addition to upregulation during retinal maturation and negligible expression in RPCs, all pointing to significant roles in rod function. Summaries of gene function for several of these genes are given in Table 7. In summary, many genes with uncharacterized retinal functions have been identified as important in retinal development by this study and others.
T a b l e 6 . f u n c T io n s o f se l e c T e d G e n e s a l so id e n T if ie d in o T h e r r eT in a l a r r a y sT u d ie s . G ene T itl e a nd sy mb ol Fu nc tio ns R et in al fu nc tio ns R efe re nc es be tac el lu lin, epi de rm al g ro w th fa ct or fa m ily m em be r Bt c M em be r o f t he E G F f am ily o f g ro w th f ac to rs , s yn th es iz ed pr im ar ily a
s a t
ra ns m em br an e p re cu rs or , w hi ch i s t he n p ro ce ss ed to m at ur e m ol ec ul e b y p rot eo ly tic e ve nt s. T hi s p rot ei n i
s a l
ig an d fo r t he E G F r ec ep to r. I nv ol ve d i n p ro pa ga tin g lu te in iz in g h or m on e sig na lli ng t hr ou gh t he o va ry d ur in g o vu la tio n. C on st itu en t o f b on e m ar ro w s te m c el l c on di tio ne d m ed iu m ( BM SC m ed iu m ), BM SC m ed iu m t re at ed R PC s a re m or e l ik el y t o f av ou r ne ur al d iff er en tia tio n. M ay a ls o e nh an ce R PC p ro lif er a-tio n. O ve re xp re ss ed i n d ia be tic m ic e, m ay c on tr ib ut e t o in cr ea se d v as cu la r p er m ea bi lit y a nd v as cu la r o ed em a, le ad in g t o d ia bet ic ret in opa th y. G en e I D :6 85 . O M IM 60 034 5 [ 63 , 64 ]. sy nap to so m al -as so ci at ed p rot ei n 2 5 Snap 25 Sn ap 25 i
s a p
re sy na pt ic p la sm a m em br an e p rot ei n i nv ol ve d i n th e r eg ul at io n o f n eu rot ra ns m itt er r el ea se . N eu ro na l e xo cy to si s re qu ire
s 3 S
N A R E p rot ei ns : s yn ap tob re vi n o n t he s yn ap tic v es ic le , an d s yn ta xi n a nd S N A P2 5 o n t he p la sm a m em br an e. E xp re ss ed i n ribb on s yn ap se s f ro m p n4, m ay b e i nv ol ve d i n t he ir o rg an iz at io n. St ro ng ly e xp re ss ed i n h or iz on ta l c el ls . T ho ug ht t o p la y ro le i n p hot or ec ep to r d ev el op m en t. E xp re ss ed i n t he G ol gi c om pl ex o f r et in al n eu ro ns a s w el l a s i nv ol ve -m en t i n s yn ap tic v es ic le r el ea se . I t i s l oc at ed i n t he pe ri nu cl ea r c om pa rt m en t o f r et in al n eu ro ns G en e I D : 6 61 6, O M IM 6 00 32 2 [ 65 -67 ], co m pl ex in 4 C pl x4 Pr ob ab le m em be r o f t he c om pl ex in f am ily , m ay b e i nv ol ve d i n sy na pt ic v es ic le e xo cy to si s. C on ta in
s a C
-te rm in al C A A X b ox m ot if f or p os ttr an sl at io na l p re ny la tio n. E xp re ss io n i s r et in al sp ec if ic, o r r es tr ic te d t o e ye a nd r et in a ( da ta ba se s). E xp re ss io n se em s t o b e l oc al iz ed t o r od p hot or ec ep to r r ibb on s yn ap se s. Po si tiv e r eg ul at or o f s yn ap tic t ra ns m is si on i n m ou se h ip po ca m pa l neu ro ns . Pr es en t i n I PL a nd b ip ol ar c el l s yn ap se s. D ou bl e C pl x3 /4 K O m ic e s ho w b eh av io ur al r es po ns es s ug ge s-tiv e o f v is ua l d ef ic it a nd d is or de re d r ibb on s yn ap se s. G an gl io n c el l O N a nd O FF s yn ap se s a ls o a ff ec te d di ff er en tia lly . E ss en tia l r eg ul at or s o f n eu rot ra ns m is si on at r et in al r ibb on s yn ap se s. G en e I D :3 39 30 2 OM IM 60 95 86 [ 68 , 69 ]. po do ca ly xi n-lik e Po dx l M em be r o f t he s ia lo m uc in p rot ei n f am ily . I m po rt an t c om po ne nt o f gl om er ul ar p od oc yt es . O th er b io lo gi ca l a ct iv iti es i nc lu de b in di ng
in a m
em br an e p rot ei n c om pl ex w ith N a+ /H + e xc ha ng er r eg ul a-to ry f ac to r t o i nt ra ce llu la r c yt os ke le ta l e le m en ts , p la yi
ng a r
ol e i n he m at op oe tic c el l d iff er en tia tio n, a nd b ei ng e xp re ss ed i n v as cu la r en dot he liu m c el ls a nd L -s el ec tin b in di ng . H ig he st e xp re ss io n i n ki dn ey , p an cr ea s a nd h ea rt . L in ke d t o e zr in a nd t he a ct in c yt os ke l-et on v ia N he rf 2. Id en tif ie d v ia a rr ay a
s a m
ar ke r o f e ar ly r od p re cu rs or s w hi ch a re c ap ab le o f i nt eg ra tin g i nt o r ec ip ie nt r et in as af te r t ra ns pl an ta tio n. [3 1] G en e I D : 5 42 0. O M IM 60 26 32. ca ls yn te ni n 1 C ls tn1 Is ol at ed f ro m b ra in c D N A l ib ra ry , e xp re ss ed b y > 90 % o f n eu ro ns . Lo ca liz ed i n p os t-s yn ap tic m em br an e. S ig na lli ng m ay b e b y pr ot eo ly tic c le av ag e. E xp re ss io n r ai se d i n A lz he im er s a nd P ar ki n-so ns s am pl es d ec re as ed i n n eu rob la st om a. L oc al iz ed i n o rg an el le s al on gs id e m ic rot ub ul es , p ar tia lly c o-lo ca liz ed w ith k in es in . O rg an -el le s t ra ns po rt ed i
n a m
an ne r c on si st en t w ith f as t a xo na l t ra ns po rt . U nk now n G en e I D : 2 28 83 O M IM 611 32 1 [ 70 , 71 ] ch ol in er gi c r ec ep to r, ni cot in ic, a lp ha p ol y-pe pt id e 5 C hrn a5 N ic ot in ic a ce ty lc ho lin e r ec ep to r s ub un it a
nd a m
em be r o f a su pe rf am ily o f l ig an d-ga te d i on c ha nn el s t ha t m ed ia te f as t s ig na l tr an sm is si on a t s yn ap se s. D ef ec ts i n t hi s g en e h av e b ee n l in ke d t o su sc ep tib ili ty t o lu ng c an ce r t yp
e 2 (
LN C R 2) , v ar ia nt s a re a ss oc i-at ed w ith i nc re as ed r is k o f n ic ot in e a dd ic tio
n, a p
T a b l e 7 . f u n c T io n s o f se l e c T e d G e n e s c o n fi r m e d by q Pc r ( se e f iG u r e 2 a n d s u PP l e m e n Ta r y d a Ta fi l e 4 for a ss o c ia T e d q Pc r r e su lT s ). G ene T itl e a nd S ym bo l Fu nc tio ns R et in al fu nc tio ns R efe re nc es lo w d en si ty l ip op rot ei n re ce pt or -r el at ed p rot ei n 4 Lr p4 M em be r o f t he l ow -d en si ty l ip op rot ei n r ec ep to r-r el at ed p rot ei n f am ily , m ay b
e a W
nt s ig na lin g r eg ul at or . C on ta in s E G F l ik e d om ai n. C o-or di -na te s s yn ap se f or m at io n a t n eu ro m us cu la r ju nc tio ns . M ut at ed i n C en an i-Le nz s yn da ct yl y s yn dr om e a nd s cl er os te os is . K no ck ou t m ic e a re g ro w th re ta rd ed w ith f ul ly p en et ra nt p ol ys yn da ct yl y i n t he ir f or e a nd h in d l im bs an d p ar tia lly p en et ra nt a bn or m al iti es o f t oot h d ev el op m en t. un kn ow n G en e I D : 4 03 8, O M IM 60 42 70 A 53 00 58 N 18 R ik R IK EN cD N A , A5 30 058 N 18 R ik N o h um an h om ol og ue n ot ed . U nc ha ra ct er is ed un kn ow n G en e I D : 3 20 84 6. st er ile a lp ha m ot if do m ai n c on ta in in g 1 1, Sa m D1 1 R el at iv el y u nc ha ra ct er is ed . M ay p ro m ot e c el l p ro lif er at io n s lig ht ly . Ev olu tio na ri ly c on se rv ed f ro m z eb ra fi sh t o h um an . H ig h e xp re ss io n le ve ls i n m ou se r et in a, b ut h um an S am D 11 i s m or e w id el y e xp re ss ed . M ou se S am D 11 i s e xp re ss ed i n d ev el op in g ph ot or ec ep to rs a nd t he p in ea l g la nd ; e xp re s-si on i s c on tro lle d b y C rx . G en e I D : 1 48 39 8 [ 74 ]. C dk 2ap 2 C D K 2-as so ci -at ed p rot ei n 2 , C dk 2a p2 In te ra ct s w ith c yc lin -d ep en de nt k in as
e 2 a
ss oc ia te d p rot ei n 1 . M ay b e in vo lv ed i n s el f r en ew al r eg ul at io n i n E S c el ls ; k no ck ou t E SC s s ho w ed an e ar ly d iff er en tia tio n p he not yp e, b ut e m br yo id b od ie s w er e u nh ea lth y an d s ho w ed h ig h l ev el s o f a po pt os is . K no ck ou t E SC s w er e u na bl e t o fo rm t er at om as i n S C ID m ic e. un kn ow n G en e I D : 1 02 63 [ 75 ]. pe ro xis om e p ro lif er a-tiv e a ct iv at ed r ec ep to r, ga m m a, c oa ct iv at or 1 alp ha , Pp ar gc 1a Tr an sc rip tio na l c oa ct iv at or r eg ul at in g g en es i nv ol ve d i n e ne rg y m et ab o-lis m . I nt er ac ts w ith P PA R ga m m a, p er m itt in g i nt er ac tio n w ith m ul tip le tr an sc rip tio n f ac to rs . I t p ro vi de
s a d
ire ct l in k b et w ee n e xt er na l p hy si -ol og ic al s tim ul i a nd t he r eg ul at io n o f m ito ch on dr ia l b io ge ne si s ( pa rt ic u-la rly v ita l i n t he r et in a) , a nd i
s a m