Abstract— The understanding of human brain is always an
attracting factor for most of the researchers. With the advancement of the technology several techniques have been developed which are quite impressive, one of them is Brain Computer Interface (BCI). Electroencephalography (EEG) records brain signals in a non- invasive manner by simply placing electrodes on scalp using 10-20 international system of electrode placement. Eye movement causes great change in EEG waves (alpha, beta gamma, and theta) produced. For further studies, it is necessary to identify their impact on different parts of the brain. In present paper the EEG wave of Alpha type have been analyzed for left and right hemispheres of human brain by considering five different subjects. The maximum and minimum power and corresponding frequencies have been recorded from various channels (electrodes placement points on brain)of brain scalp during open eye and closed eye conditions. The effect of power and frequency values in left and right hemispheres of brain has been explained for both open and closed states of eyes. From the analysis, it has been observed that right hemisphere of brain is more activated when eyes remain closed in the range of alpha waves.
Index Terms— Brain Computer Interface,
Electroencephalography waves, Alpha Wave
1) INTRODUCTION
As a matter of fact brain waves in the form of electrical signals of small amplitude produced in human brain depending on brain activityin an uninterrupted manner. The human brain activity is represented in the form of different waves by EEG after picking up of electrochemical current from scalp on which the electrodes are placed. The type of brain waves as generated in brain due to different task or activities are different.
Different people of different age groups may have different frequency and amplitude of EEG signals. Brain rhythms or waves are mainly five type’s delta, theta, alpha, beta and gamma. EEG signals are taken from the scalp region. Signals are captured using the electrodes which are in the EEG device and these electrodes stick to
Manuscript received Feb, 2017
Praktiti Trivedi, Phd Scholar Bhagwant University Ajmer, Ajmer, India Dr Neeraj Bhargave, Prof & Head, Dept of Computer Sc, MDS Univ Ajmer, India.
the head of the user (different subjects) when when wears the EEG headset. Electroencephalography (EEG) is a type of non-invasive interface, which has high potential due to its fine temporal resolution, ease of use, portability and low set-up cost. Electroencephalography (EEG) is a procedure by which electrical activity of the brain is measured. EEG has some of the advantages over other invasive techniques. First one is that EEG is one of the non-invasive techniques which mean it does not require surgical operations. Also this technique reduces risk and cost factors. This technique is better than ECoG (electrocorticography), in the way that ECoG have electrodes planted under the skull area. Invasive systems causes risk and damages to a brain, also the operations in this system are costlier than non-invasive ones.EEG works on the principle of calculation of potential difference between the electrodes. The electrodes that are attached to the ear lobes are called reference electrodes. These electrodes are useful to find the background electric field of skull.
2) LITERATUREREVIEW
A brain–computer interface (BCI), also referred as
a mind-machine interface (MMI), direct neural
interface (DNI), or brain–machine interface (BMI), is considered as a direct communication pathway between an enhanced or wired brain and an external device. BCIs are often directed at researching, mapping, assisting, augmenting, or repairing human cognitive or sensory-motor functions [1].
Research on BCIs began in the 1970s at the University of California, Los Angeles (UCLA) under a grant from the National Science Foundation, followed by a contract from DARPA [2, 3].
While an EEG based brain-computer interface has been pursued extensively by a number of research labs, recent advancements made by Bin He and his team at the University of Minnesota suggest the potential of an EEG based brain-computer interface to accomplish tasks close to invasive brain-computer interface. Using advanced
functional neuro imaging including BOLD
functional MRI and EEG source imaging, Bin He and co-workers identified the co-variation and co-localization of electrophysiological and hemodynamic signals induced by motor imagination [4]. Refined by a neuro imaging approach and by a training protocol, Bin He and co-workers demonstrated the ability of a non-invasive EEG based
Effect of Left and Right Hemisphere of Brain in
both Eye Open and Close state on Minimum
Power Values and Frequency of Alpha Wave
Activity
brain-computer interface to control the flight of a virtual helicopter in 3-dimensional space, based upon motor imagination [5]. In June 2013 it was announced that Bin He had developed the technique to enable a remote-control helicopter to be guided through an obstacle course.
In addition to a brain-computer interface based on brain waves, as recorded from scalp EEG electrodes, Bin He and co-workers explored a virtual EEG signal-based brain-computer interface by first solving the EEG inverse problem and then used the resulting virtual EEG for brain-computer interface tasks. Well-controlled studies suggested the merits of such a source analysis based brain-computer interface [6].
A 2014 study found that severely motor-impaired patients could communicate faster and more reliably with non-invasive EEG BCI, than with any muscle-based communication channel [7].
A method based on linear discriminant analysis has been proposed by Denis Delisle et al. [8] to detect events associated to eyes opening and closing, by capturing alpha waves measured from the occipital lobe.
Another method Power spectral density (PSD) helps identify the frequency domain where strength of signal is more or less. PSD can be seen as frequency response of periodic or random signals. The PSD for certain types of random signals is independent of time and hence it is deterministic. PSD is useful for analysis of random signals especially in BCI because brain signals are highly variable. SamanehValipour et al. [9] have recorded EEG signals only for 10 seconds because these signals are stationary for a time period of less than 12 seconds. MATLAB with EEGLAB has been used for computation of PSD for EEG signals. Authors have observed PSD on three subjects on channels PZ, P3, P4, FZ and CZ with subjects opened and closed eyes.
ICA is a powerful method used to separate independent data mixed linearly using various channels. For instance, when recording electroencephalograms (EEG) on the scalp, ICA can separate out artifacts embedded in the data (since they are usually autonomous of each other). The number of channels directly influences the performance of separation between artifact and pure EEG components. Before applying ICA on EEG data pre-processing is performed i.e. “whitening of data”. In this pre-processing step simple linear change is performed over the coordinates of mixed data. Some of the ICA properties are: ICA can only separate the data that are linearly mixed, changing order of data points that are plotted cannot affect the result of ICA algorithm applied, change in position of electrode will also not affect the result of ICA, if data is dependent than also ICA algorithms finds the maximum separation between the sources and give the outcome.
While recording data from brain scalp via electrodes the electrical activity of neurons are displayed in waves form on the computers. These waves represent different mental state of the subject. Frequency is best way to represent the varying state of any EEG activity as it is easy to asses it. Brain neurons oscillations are observed in form of waves (defined on basis of their frequency) from a person mind are:
a) Delta (0.1 to 3.5 Hz): This rhythm is dominant in infants and during deep sleep of adults and when a person is suffering from serious brain disorder.
b) Theta (3.5 to 7.5 Hz): This rhythm is found while a person is in sleeping state (or drowsy). It is also found in children when they are awake. Mainly observed at frontal, temporal and parietal region.
c) Alpha (7.5 to 13 Hz): It is dominant when a person is awake performing daily tasks. Mostly found at occipital and parietal lobes of brain and stronger over the right hemisphere. Present when a subject is mentally inactive, alert, with eyes closed. Blocked or weakened by deep sleep, attention, especially visual, and mental effort.
d) Beta (13 to 30 Hz): Beta waves, with lower frequencies disappear during mental activity and Beta waves, with higher frequencies appear while a person is in tension and under intense mental activity. Under intense mental activity beta can extend up as far as 50Hz
Figure 1: EEG rhythms
3) WORKING
Analysis of BCI task is done by EEGLAB. EEGLAB is freely available with some inbuilt plug-ins. It runs on MATLAB environment. It provides interactive Graphical User Interface and some in-built functions such as Independent Component Analysis, Remove Component, Remove Baseline, Artifact Rejection, etc. EEGLAB also provide the Script Window to develop user defined Script. Independent Component Analysis converts the high dimensional data space into low dimensional data space. In EEGLAB, ICA is implemented by runica() function. It removes the artifact which is generated by the muscles and eye blink activity. It also filters the noise and speech data.
EEGLAB also integrates general tutorial and help windows and a command history function which allow users to easily switch from one mode to another i.e. from GUI-based to script-based. EEGLAB has treasure of methods using those one can visualize and models the event-related brain data. Users who have knowledge of MATLAB for them EEGLAB provides a programming environment, which offers storing, measuring, editing, updating, accessing and visualizing the EEG data.
EEGLAB is an open source platform, it allows researchers to create and share their new methods with the world.
4) RESULTSANDDISCUSSION
The alpha wave activity of brain of five different subjects during open eye and close eye condition has been analyzed and compared. The data were collected from Physio Net by the developers of the BCI2000 instrumentation system as described by Goldberger ALet al. in [10]. Present work deals with data for 23 channels of left and right hemisphere of brain. Channel number and their respective electrodes name are shown in Table 1. Data was recorded with subjects having open eyes as well as close eyes in the similar ways as used in [11]. For analyzing and comparing the results, emphasis has been given to alpha wave having frequency range from 8 to 13 Hz in the present paper, for all channels. Channel power and frequency plot using GUI interface of EEGLAB has been analyzed. In present paper, channel plot of electrodes corresponds left and right hemisphere of brain have been considered and related minimum frequency and power has been plotted as shown in Figures (3 and 4) respectively.
Table 1. Channel number and their respective electrodes
Left Hemisphere Right Hemisphere
Channel number Electrode Name Channel number Electrode Name 1 FC5 1 FC2 2 FC3 2 FC4 3 FC1 3 FC6 4 C5 4 C2 5 C3 5 C4 6 C1 6 C6 7 CP5 7 CP2 8 CP3 8 CP4 9 CP1 9 CP6 10 FP1 10 FP2 11 AF1 11 AF4 12 AF3 12 AF8 13 F7 13 F2 14 F5 14 F4 15 F3 15 F6 16 F1 16 F8 17 P7 17 P2 18 P5 18 P6 19 P3 19 P4 20 P1 20 P8 21 PO7 21 PO8 22 PO3 22 PO4 23 O1 23 O2
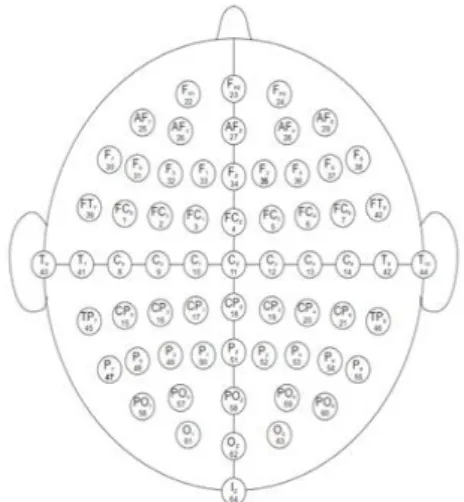
The placements of electrodes in human brain are shown in Fig. 2.
Figure 2. Electrodes placement in left hemisphere and right hemisphere.
The minimum power for alpha waves of left hemisphere has been plotted for five different subjects for eyes closed and open condition. In both eye conditions it has been observed that peaks of minimum power in both the cases have been occurred at channels 19. Similarly second peaks are also obtained in near-by channels 14. This suggests that for both positions of eyes the minimum power peaks occurred at particularchannels.
(a)
(b)
Figure 3. Minimum Power for considered channels for (a) left and (b) right hemisphere of brain.
The minimum power for alpha waves of left hemisphere has been plotted for five different subjects for eyes closed and open condition. In both eye conditions it has been observed that peaks of minimum power in both the cases have been occurredatchannels19. Similarly second peaks are also obtained in near-by channels 14. This suggests that for both positions of eyes the minimum power peaks occurred at particular channels.
Similar phenomenon has been observed for right hemisphere of different subjects. For right hemisphere the peaks of minimum power for alpha waves in both the cases have been occurred at channels 20 and second peaks are also obtained at channels 9. This further suggests that for both positions of eyes the minimum power peaks occurred at particular channels.
Further, from above plots as shown in Fig. 3 (a) and 3 (b) it has been observed that the value of minimum power is higher when eyes are open. The effect of location of channel can be visualized clearly from above plots as the value of minimum power for both hemispheres are almost identical but these values occurred at different channels. Thus it can be concluded that placement of electrodes affects the power frequency spectrum of human brain.
(a)
(b)
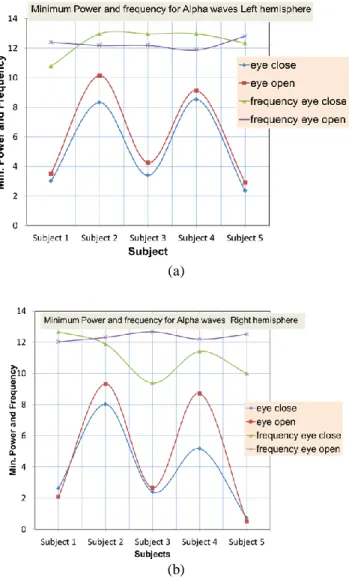
Figure 4. Minimum Power and frequencies for considered channels for (a) left and (b) right hemisphere of brain.
Both frequency and minimum power for left hemisphere have been plotted for Alpha wave as shown in Fig. 4(a). From Fig. 4(a), it is clear that for subject 2 the frequency is higher when eyes are closed but at the same time the minimum power requirement for same subject is less during eyes closed. Similar type of phenomenon have been observed for subject 3 and 4, but reverse phenomenon have been identified for subject 1 and 5. The above difference is attributed to the fact that mental state of different subjects (humans) as considered in the present work are different and brain activity of them are different for two different conditions i.e. eye closed and eyes open.
Different frequency spectrum has been observed for alpha wave of right hemisphere of brain as shown in Fig. 4(b). The frequency corresponds to subject 3 has been found to be minimum for right hemisphere as compared to left one. At the same time for different subjects when eyes remain close the frequency variations has been observed for right hemisphere as compared to eyes open condition. The variation in frequency suggests that right hemisphere is more activated when eyes remain closed in the range of alpha waves.
5) CONCLUSION
EEG measures electric brain activity caused by the flow of electric currents during synaptic excitations of the dendrites in the neurons and is extremely sensitive to the effects of secondary currents. In present paper, 23channels, from left and right hemisphere of brain have been analyzed in order to study the nature of alpha wave on these electrodes. From the observations it can be concluded that that right hemisphere of brain is more activated when eyes remain closed in the range of alpha waves. Further placement of electrodes also affects the power frequency spectrum of human brain.
REFERENCES
1) Krucoff, Max O.; Rahimpour, Shervin; Slutzky, Marc W.; Edgerton, V. Reggie; Turner, Dennis A. (2016). "Enhancing Nervous System Recovery through Neurobiologics, Neural Interface Training, and Neurorehabilitation". Neuroprosthetics: 584. doi:10.3389/fnins.2016.00584.
2) Vidal, JJ (1973). "Toward direct brain-computer communication".
Annual Review of Biophysics and Bioengineering. 2 (1): 157–80.
doi:10.1146/annurev.bb.02.060173.001105.
3) J. Vidal (1977). "Real-Time Detection of Brain Events in EEG" (PDF). IEEE Proceedings. 65 (5): 633–641. doi:10.1109/PROC.1977.10542
4) Yuan, H; Liu, Tao; Szarkowski, Rebecca; Rios, Cristina; Ashe, James; He, Bin (2010). "Negative covariation between task-related responses in alpha/beta-band activity and BOLD in human sensorimotor cortex: an EEG and fMRI study of motor imagery and movements". NeuroImage. 49 (3): 2596–2606. doi:10.1016/j.neuroimage.2009.10.028.
5) Doud, AJ; Lucas, John P.; Pisansky, Marc T.; He, Bin (2011). Gribble, Paul L, ed. "Continuous Three-Dimensional Control of a Virtual Helicopter Using a Motor Imagery Based Brain-Computer Interface". PLoS ONE. 6 (10):e26322.Bibcode:2011PLoSO...626322D.doi:10.1371/journ al.pone.0026322.
6) Qin, L; Ding, Lei; He, Bin (2004). "Motor imagery classification by means of source analysis for brain-computer interface applications". Journal of Neural Engineering. 1 (3): 135–141. Bibcode:2004JNEng...1..135Q. doi:10.1088/1741-2560/1/3/002. 7) Höhne, J; Holz, E; Staiger-Sälzer, P; Müller, KR; Kübler, A; Tangermann, M (2014). "Motor imagery for severely motor-impaired patients: evidence for brain-computer interfacing as superior control solution.". PLOS ONE. 9 (8): e104854. Bibcode:2014PLoSO...9j4854H.
8) Denis Delisle-Rodriguez, Javier F. Castillo-Garcia, TeodianoBastos-Filho, AnselmoFrizera-Neto, Alberto Lopez-Delis, “Using Linear Discriminant Function to Detect Eyes Closing Activities through Alpha Wave ”
9) SamanehValipour , A.D. Shaligram, G.R.Kulkarni, “Detection of an alpha rhythm of EEG signal based on EEGLAB”, Department
of Electronic Science, Pune University, Pune, 411 007, Maharashtra,IndiaDepartment of Physics, Pune University, Pune, 411 007,Maharashtra,India.
10) Goldberger AL, Amaral LAN, Glass L, Hausdorff JM, IvanovPCh, Mark RG, MietusJE,Moody GB, PengCK,Stanley HE. PhysioBank, PhysioToolkit, and PhysioNet: “Components of a New Research Resource forComplexPhysiologicSignals.”Circulation101(23):e215e22[Ci
rculationElectronicPages;[http://circ.ahajournals.org/cgi/content
/full/101/23/e215] ]; 2000 (June 13). 11) [http://www.bci2000.org/]
Praktiti Trivedi, Phd Scholar Bhagwant University Ajmer, Ajmer, India Dr Neeraj Bhargave, Prof & Head, Dept of Computer Sc, MDS Univ