Improving Detection of Events at Water
Treatment Works: A UK Case Study
G. Riss
1,2, M. Romano
2, K. Woodward
2,
F. A. Memon
1and Z. Kapelan
11 Centre for Water Systems, University of Exeter, U.K.
2 United Utilities Group PLC, Lingley Mere Business Park, Warrington, WA5 3LP, UK 3LP, U.K. [email protected]
Abstract
This paper presents a study aimed at improving the event detection capabilities of the existing, threshold-based detection system at a selected Water Treatment Works operated by United Utilities. The study shows that improvements can be achieved by using optimised threshold and persistence values identified by performing a sensitivity type analysis. The main findings from this study show that, although an overall increase in the true detection rate and decrease in the number of false alarms can be achieved, the high number of false alarms remains an issue. To address this problem a new event detection system based on suitable relations across multiple signals will be developed as part of future work.
1
Introduction
Online water quality/quantity monitoring technologies for Water Treatment Works (WTWs) operation have made significant progress in recent years (Storey, van der Gaag, & Burns, 2011). Producing water in the required quality and quantity by operating WTWs in an effective and efficient way is a challenging task for water utilities. For this reason WTWs are already heavily monitored and automated. Although a number of fault detection and isolation techniques have been developed (Venkatasubramanian, Rengaswamy, Kavuri, & Yin, 2003; Miljkovic, 2011; Maiti & Banerjee, 2012) only a few of these have found their implementation in software platforms and many have not proven their ability to detect measurement or equipment failures (Rieger & Vanrolleghem, 2008).
Near real-time applications used to date, such as Canary (Hart D. , McKenna, Klise, Cruz, & Wilson, 2007; Hart & McKenna, 2009) from the Environmental Protection Agency (EPA) or GuardianBlue from Hach Lange (Hach Homeland Security Technologies, 2007) still suffer from a range of shortcomings such as insufficient detection capability or too many false alarms (Bernard, et al., 2015). Moreover, the Water Quality Event Detection System Challenge report published by the EPA highlighted that a change in the configuration settings of the tested systems has a great impact on their performance, whereat reconfigurations to reduce false alarm rates lead generally to a decrease of the
Engineering
Volume 3, 2018, Pages 1766–1771
detection sensitivity (EPA, 2013). This is not surprising as quick response to failure events (performance) and robustness are two conflictive goals. Event detection systems are frequently robust to a minor degree or sensitive to high frequency influences followed by a higher level of false alarms (Venkatasubramanian, Rengaswamy, Kavuri, & Yin, 2003). Furthermore, data validation methods used in water systems are often inefficient and frequently a systematic analysis is missing (Branisavljević, Prodanović, & Pavlović, 2010). New and more efficient technologies need to be developed to address these issues. The focus of further research is set on innovative, cost-effective and wherever possible predictive near real-time event recognition systems.
The objective of this work is to investigate possible improvements to the existing, threshold-based WTWs event detection system used by United Utilities (one of the largest water and wastewater companies in the UK). This is done by evaluating the existing detection system’s performance and then using a sensitivity type analysis to identify new detection thresholds and persistence values that improve overall performance. These findings will be used later on for the development of a new event detection system based on suitable relations across multiple signals.
2
Case Study Description
The study focuses on a WTWs operated by United Utilities whose process flow diagram is shown in Figure 1. This WTWs is situated in the North West of England and supplies water to around 200,000 domestic and industrial customers with 73.5 Ml/d flow capacity. This WTWs is heavily automated and controlled in near real-time by the use of a Supervisory Control and Data Acquisition System (SCADA).
Figure 1: Process Flow Diagram of the selected Water Treatment Works operated by United Utilities
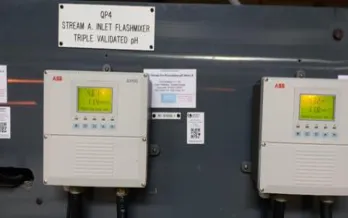
Multiple parameters such as pH, turbidity, iron, chlorine, manganese, conductivity and colour are monitored by online sensors at different treatment stages. Figure 2 shows exemplary the analysers for triple validation of pre flocculation pH at the inlet of the WTWs.
detection system. The system applies pre-defined thresholds to the monitored signals and carries out default actions (alarm/no alarm) in case of limit violations. Every 5 minutes, each sensor signal is checked against the defined low and/or high thresholds. In addition to the limits a “time dead-band”, i.e. persistence is used by the system. Persistence defines the time a signal has to be above/below a threshold before the execution of the default action. The same persistence is applied for the different thresholds that are set on a signal.
Historical data for 56 sensors over four and a half calendar years and at a 5 minute resolution was collected. Initial data screening resulted in 28 signals selected as relevant for the analysis performed in this study. The selected parameters include pH, turbidity, iron, colour and chlorine at different treatment stages and comprise both stream A and stream B signals.
The observed data was split into datasets for re-calibration of existing detection thresholds (time period from 01/01/2012 until 30/06/2015) and follow-on validation on unseen data (time period from 01/07/2015 until 30/06/2016).
3
Methodology
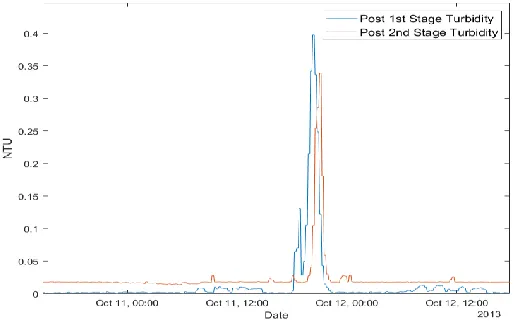
A number of historical events were identified first at the WTWs and classified as major, minor or sensor fault events. Major (or “zero-flow”) events were defined as events that caused an interruption of the production flow and led to an unplanned shutdown of the WTWs, see Figure 3. During the analysed time period, 8 zero-flow events were identified.
Figure 2: Analysers for pH triple validation at the inlet works
Other events were identified by looking at simultaneous deviations of more than one signal from normal operating process conditions. To identify these events, normal WTWs operating conditions were analysed on the basis of common statistical indicators for minimum, maximum, mean and range of the selected signals. Bivariate correlations between parameters were then calculated using the Spearman’s correlation coefficient to derive possible related deviations of multiple signals from the corresponding normal values. Abnormal conditions were then identified by visual inspection of the graphed deviations. In case of simultaneous deviations of more than one signal the occurrence of a minor event was assumed (Figure 4), whereas deviations of single signals from normal were classified as sensor faults. Using this methodology 252 possible process events (i.e. minor events) and 52 sensor (or telemetry) faults (in particular flat line faults or missing data of longer duration) were identified during the analysed time period.
Once the events were identified, the WTWs detection system was simulated over the entire time period analysed. For each signal, confusion matrices with true/false positives/negatives were generated and the corresponding true detection and false alarm rates were calculated. The detection rates of single signals of a treatment stage were averaged to display detection statistics for the respective treatment stage. In the same way the detection statistics for the overall system were calculated as averaged detection rates of all the selected parameters. All this was done separately for major and minor events.
A sensitivity analysis (Saltelli, Tarantola, Campolongo, & Ratto, 2004) was then performed to investigate possible improvements to the existing detection system by changing the detection thresholds and persistence values. This was done on the calibration data set only. The plausible ranges of high/low detection thresholds for the 28 signals analysed were identified first. Within these ranges, new detection thresholds were created by applying a gradual increase/decrease of the threshold values in 0.05 unit steps and persistence values were changed from 0 to 12 time steps (i.e. from 0 to 60 minutes).
This way a total of 7,540 sensitivity tests were conducted for each of the 28 signals resulting in estimated corresponding true and false positive detection rates (not shown in this paper to save space). The optimised new thresholds and persistence value combinations were then derived for each sensor signal by selecting the combination with the maximum value of the ratio of true detection rates to false positives.
The modified detection system that makes use of optimised thresholds and persistence values was then tested in the same way as it was done in the case of the existing detection system. The results obtained this way were then compared to evaluate detection performance improvements.
4
Results and Discussion
The results obtained for the existing event detection system are presented in Table 1. As it can be seen form this table, the existing event detection system is able to detect 58% and 39% of major events (average true detection rate) for the calibration and validation time periods, respectively. The average true detection rates for minor events are 26% and 16% for the calibration and validation time periods, respectively. The higher true detection rate for major events was expected since these events should be easier to detect than the minor events.
Table 1: Detection statistics of the existing event detection system
Table 1 also shows a significant number of false alarms generated by the existing detection system. The false alarm rates for both major and minor events are in the range of 43-96%, i.e. approx. 0.4 false alarms/signal/day (given the total number of false alarms is equal to 16,932) which is very high. These results are also in line with the findings of the EPA challenge (EPA, 2013), where it was shown that the event detection performance of the five tested detection systems greatly varied and the high number of false alarms was identified as one of the main problems.
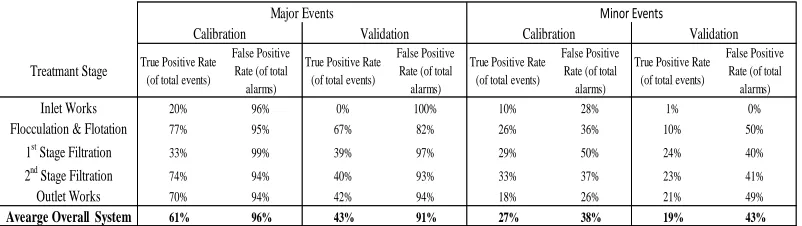
The results obtained for the modified event detection system are presented in Table 2. As it can be seen from this table, by using the optimised thresholds and persistence values identified after carrying out the sensitivity analysis described above (values not shown here to save space), the detection statistics showed a minor improvement when compared to the existing detection system. The true detection rates increased by 3% and 4% for major events and by 1% and 3% for minor events on the calibration and validation data sets, respectively. Also, with regard to the false positives, better performance is achieved with the new thresholds and persistence values. Having said this, the improvements measured by percentage reduction of false alarms (new thresholds vs current system) are, again, rather minor (given their large number) with decrease of up to 2% and 5% for major and minor events, respectively.
Table 2: Detection statistics of the modified event detection system
Treatmant Stage True Positive Rate (of total events) False Positive Rate (of total alarms) True Positive Rate (of total events) False Positive Rate (of total alarms) True Positive Rate (of total events) False Positive Rate (of total alarms) True Positive Rate (of total events) False Positive Rate (of total alarms)
Inlet Works 10% 99% 0% 100% 9% 43% 3% 0%
Flocculation & Flotation 67% 96% 61% 88% 23% 40% 12% 56%
1st Stage Filtration 30% 99% 33% 96% 23% 51% 19% 45%
2nd Stage Filtration 78% 95% 37% 94% 34% 44% 18% 42%
Outlet Works 60% 96% 42% 94% 18% 26% 22% 51%
Avearge Overall System 58% 96% 39% 93% 26% 43% 16% 45%
Calibration Validation
Minor Events
Calibration Validation Major Events
Treatmant Stage True Positive Rate
(of total events)
False Positive Rate (of total alarms)
True Positive Rate (of total events)
False Positive Rate (of total alarms)
True Positive Rate (of total events)
False Positive Rate (of total alarms)
True Positive Rate (of total events)
False Positive Rate (of total alarms)
Inlet Works 20% 96% 0% 100% 10% 28% 1% 0%
Flocculation & Flotation 77% 95% 67% 82% 26% 36% 10% 50%
1st Stage Filtration 33% 99% 39% 97% 29% 50% 24% 40%
2nd Stage Filtration 74% 94% 40% 93% 33% 37% 23% 41%
Outlet Works 70% 94% 42% 94% 18% 26% 21% 49%
Avearge Overall System 61% 96% 43% 91% 27% 38% 19% 43%
Major Events Minor Events
5
Conclusion
This paper presents potential modifications that can be made to the existing, threshold-based event detection system of a real Water Treatment Works aiming at improving its event detection capabilities. Evaluation of the current event detection system showed that it has moderate true detection ability and suffers from a high rate of false alarms. Application of new threshold and persistence values showed the potential to enable an overall increase of the true detection rate by 3% and 4% for major events and 1% and 3% for minor events on the calibration and validation data sets, respectively.
At the same time, it showed a reduction of false alarms by up to 2% and 5% for major and minor events, respectively. Although these improvements can be (easily) achieved, the high number of false alarms remains an issue. To address this problem, as part of future work a new event detection methodology will be developed based on rules that include suitable relations across multiple signals. The new event detection methodology will also have the sensor data validation capability.
References
Bernard, T., Mossgraber, J., Madar, A. E., Rosenberg, A., Deuerlein, J., Lucas, H., & Ulitzur, N. (2015). SAFEWATER - innovative tools for the detection and mitigation of CBRN related contamination events of drinking water. 13st International Conference on Computing and
Control for the Water Industry, CCWI 2015. Leicester, UK.
Branisavljević, N., Prodanović, D., & Pavlović, D. (2010). Automatic, semi-automatic and manual validation of urban drainage data. Water Science & Technology, 62(5), 1013-1021.
EPA. (2013). Water quality event detection system challenge: methodology and findings. Cincinnati, OH: EPA.
Hach Homeland Security Technologies. (2007). GuardianBlue - early warning system. Loveland, CO: Hach Homeland Security Technologies.
Hart, D. B., & McKenna, S. A. (2009). CANARY user’s manual, version 4.1. Cincinnati, OH: U.S. Environmental Protection Agency, Office of Research and Development, National Homeland Security Research Center.
Hart, D., McKenna, S. A., Klise, K., Cruz, V., & Wilson, M. (2007). CANARY: a water quality event detection algorithm development tool. World Environmental and Water Resources Congress.
Reston, VA: ASCE.
Maiti, J., & Banerjee, R. N. (2012). Process monitoring and fault detection strategies: a review.
International Journal of Quality & Reliability Management, 29(7), 720-752.
Miljkovic, D. (2011). Fault detection methods: A literature survey. Proceedings of the 34th
International Convention MIPRO 2011, Opatija, Croatia, (pp. 750 - 755).
Rieger, L., & Vanrolleghem, P. A. (2008). monEAU: a platform for water quality monitoring networks.
Water Science & Technology - WST, 57(7), 1079-1086.
Saltelli, A., Tarantola, S., Campolongo, F., & Ratto, M. (2004). Sensitivity analysis in practice.
Chichester: John Wiley & Sons.
Storey, M. V., van der Gaag, B., & Burns, B. P. (2011). Advances in on-line drinking water quality monitoring and early warning systems. Water Research, 45(2), 741-747.