R E S E A R C H A R T I C L E
Open Access
Evaluation of the relative validity of a
Web-based food frequency questionnaire
used to assess Soy Isoflavones and nutrient
intake in adolescents
Gina Segovia-Siapco
*, Keiji Oda and Joan Sabaté
Abstract
Background:Dietary assessment during adolescence is crucial in determining how adolescents’consumption
habits potentially affect current and long-term health. However, assessment methods for adolescents need to be relevant to their emerging technological culture. We developed a web-based food frequency questionnaire
(webFFQ) to assess the habitual soy isoflavones and nutrient intake of adolescents. Our purpose was to validate this webFFQ against multiple 1-day photograph-assisted food records (FR).
Methods:Adolescents aged 12–18 years (n= 70) attending middle and high schools completed the webFFQ and
provided six 1-day FR. Fifteen participants were excluded due to improbable energy intake. Statistical agreements were determined using Wilcoxon signed-ranks test, Pearson’s bivariate correlations of normalized values with energy-adjustment and correction for attenuation, cross-classification, and Bland-Altman plots.
Results:Based onn= 55, the webFFQ had higher intake estimates for all isoflavones and most nutrients compared to the FR. Energy-adjusted and deattenuated correlations were moderately strong for total isoflavones (r= 0.67), daidzein (r= 0.63), genistein (r= 0.64), and glycitein (r= 0.54). They ranged from a high of 0.82 (animal proteins) to a low of 0.11 (vitamin B12) for nutrients. Cross-classification agreement up to within 1 quartile ranged from 99.0 % (vegetable protein) to 61.8 % (vitamin B12) with low gross misclassifications (0.0–12.7 %). Bland-Altman plots for the isoflavones showed consistent overestimation and wide variation but nevertheless good agreement between the two methods.
Conclusions:The webFFQ is relatively valid in ranking adolescents according to their isoflavones and nutrient intake. However, while it significantly overestimates the absolute intake of most nutrients, results are comparable to other food frequency questionnaires developed for adolescents.
Keywords:Adolescents, Dietary assessment, Dietary intake, Digital photographs, Evaluation, Food frequency questionnaire, Food records, Isoflavones, Soy, Validation, Web-based
* Correspondence:[email protected]
Center for Nutrition, Healthy Lifestyles and Disease Prevention, School of Public Health, Loma Linda University, Loma Linda, CA 92350, USA
Background
Most chronic diseases in adults originate from lifestyle practices and experiences during childhood and adoles-cence [1–3]. Meal-skipping [4–6] and snacking on high-calorie and low nutrient-dense foods are more common during adolescence, and these could be detrimental to their health [4–7]. Assessment of diet during this life stage is crucial in determining how consumption habits potentially affect current and long-term health. However, assessment of diet among the youth is laden with chal-lenges. This group may have difficulty identifying or naming the foods they eat, conceptualizing food portion sizes, and recalling their intake due to limited food vocabulary; or, lack the patience, motivation, and perse-verance to engage in dietary assessment activity [8, 9].
Despite their shortcomings, particularly recall bias and the need to be culture- or population-specific [10], food frequency questionnaires (FFQ) continue to be the main-stay in the dietary assessment of large study cohorts and in determining diet-and-health outcome relationships in adolescents [11]. FFQs are low-cost, time-efficient, easy to administer, can assess long-term or habitual intake, and entail less respondent burden compared to other dietary assessment methods.
A few validated FFQs for adolescents residing in the United States exist, mostly in the paper format [12–18]. Since a large percentage of adolescents spend a significant amount of time with technological devices, i.e., computers and mobile phones [19], the current technological revolu-tion and emerging culture for young popularevolu-tions should be considered in the design of dietary assessment tools. Tools that tap into the technological skills of adolescents may keep them engaged and interested in dietary assessment activities [9]. In recent years, digital dietary assessment methods have been developed in an effort to improve the accuracy of food and nutrient consumption estimates [20] and decrease respondent burden in quantifying food intake [21]. Thus far, a few online FFQs have been developed for adolescents [22–25]. However, none of the existing FFQs, paper-based or online, met our need to assess the isofla-vone intake of a multi-ethnic adolescent group, ~25 % of whom are vegetarians and highly exposed to soy-containing foods.
We conducted the Teen Food and Development Study (TeenFADS) to investigate if soy isoflavones intake is associated with the health and development of adoles-cents. To make the dietary assessment more engaging and to improve compliance, we developed a web-based FFQ (webFFQ). Considering the context of ubiquitous use of mobile phones with a camera, the use of technol-ogy becomes more affordable in epidemiological studies if personal gadgets with unlimited texting and calling are employed. Thus, we chose multiple 1-day photograph-assisted food records (FR) as the reference comparison
method and designed it such that participants used their own mobile phones to record their intake in text form and digital photographs. The purpose of this study was to validate the semi-quantitative webFFQ we developed for TeenFADS to estimate the habitual consumption of soy isoflavones and selected nutrients using multiple 1-day FR as the reference method.
Methods
Study design
The TeenFADS is a cross-sectional study that investi-gated the associations between dietary intake and health and pubertal development of adolescents. Data were collected using an online questionnaire that consisted of several sections including a dietary assessment section (webFFQ) and school visits for the anthropometric mea-surements. This current study was designed to validate the webFFQ using multiple 1-day FR as reference method. Participants completed the webFFQ, underwent a one-on-one training to do FR, and then provided 6 1-day FR over 2–3 months. They utilized their personal mobile phones for their FR. The Institutional Review Boards of Loma Linda University (LLU) and Andrews University approved the study protocol and the informed consent process for both parental permission and assent of the adolescent participant.
Study participants
Web-based food frequency questionnaire
The webFFQ is a 151-item self-administered, semi-quantitative dietary assessment questionnaire that was designed to assess the soy intake and habitual diet of adoles-cents. The food list was initially composed of foods from a pilot questionnaire constructed at LLU that was adminis-tered among adolescents to determine their soy foods intake. Foods deemed commonly eaten based on interviews of multiethnic adolescents were added to this list. Registered Dietitians (RDs) who work with adolescents reviewed the list to ensure that the food names used were appropriate for this population. A comprehensive list composed of 151 food items, 36 of which were soy-containing, were included in the final version (see Additional file 1: Table S1). Food items were grouped into eight categories that constituted eight screens in the webFFQ. The webFFQ was then pre-tested on 25 adolescents of the same demographic characteristics but were not participants in the study. This was done to de-termine clarity, interpretation, length of completion time, and if respondents would use the pop-up feature for add-itional information about an item if they needed further clarification. No conceptual difficulties in filling out the webFFQ were reported and the majority of participants did not find it necessary to seek additional information about the food items. Technical issues with use of specific browsers were resolved before administering the webFFQ.
Foods in the webFFQ are categorized as convenience foods (32 items), protein-rich foods (29 items), starches/ce-reals (17 items), vegetables/fruits (21 items), dairy products (10 items), beverages (24 items), snacks/sweets (11 items), and soups/legumes (7 items). These food groups are divided over eight screens (see Additional file 2: Figure S1). Food items are arranged in such a way that various types of a specific food are grouped (e.g., dairy milk: regular, low-fat or non-fat). Protein-rich foods such as meats also have their meat alternative counterparts (e.g., chicken, vegechicken) (see Additional file 3: Figure S2). More information about the food and examples pop up when the pointer is hovered over the food name (see Additional file 4: Figure S3). Fixed portion sizes are based on familiar measuring devices, e.g., cup, tablespoon, 12-fluid ounce can, and others.
On the webFFQ, respondents are asked to self-report the frequency of their intake during the past month. Frequency of intake is selected from a drop-down list of frequency cat-egories which are: never/rarely, 1–3 times per month, once per week, 2–4 times per week, 5–6 times per week, once per day, 2–3 times per day, and 4 or more times per day (see Additional file 4: Figure S3). For seasonal foods, e.g., certain fruits,“when in season”is included as frequency of intake category. To ensure that no item is skipped, respon-dents are not allowed to move on to the next food category until all items on the screen are completely filled out. How-ever, they can go back to make changes to their responses in any food category if desired.
The current variety of meat analog brands has various formulations. More specifically, some contain more gluten than soy protein or contain no soy protein at all. To differ-entiate between these formulations and more accurately determine soy and isoflavones intake, a separate window of different brand names for meat analogs appears for respondents to choose from when a frequency of “once per week” or greater is chosen. Frequency of “once per week” or greater for meat intake also shows a separate window where respondents choose the type of meat eaten (beef, chicken, turkey, lamb or pork). It takes approxi-mately 25 min to complete the webFFQ.
Food records with digital photographs
Multiple day food records provide a better measure of food and/or nutrient intake and, thus, is commonly used as a cri-terion reference measure in evaluating or validating FFQs [26, 27]. This dietary assessment method is often paper-based and recording is done on consecutive days. Weighing or taking a photograph of the foods before and after they are eaten are some of the approaches used to improve the accuracy of food records. As the criterion measure for this study, we determined the feasibility of using personal mobile phones for photographing foods to be consumed and re-cording intake as part of the food rere-cording process among our young study participants. This method is described in a forthcoming article [28]. Instead of consecutive days of re-cording, the protocol was designed to reduce the burden as-sociated with continuous food recording which may result in deviation from usual intake [27] or boredom, and to make the procedure more attainable among adolescents.
Before the data collection, participants were trained and then tested through a return demonstration of a one-day FR that was then evaluated to determine readiness, or add-itional training, for the study. During the trial runs, a few of the participants were excluded for losing their fiducial marker. Laminating the fiducial marker, adding a hole on one side and inserting a 2-foot long 1-inch wide ribbon through the hole resolved the problem of misplacing or los-ing the marker. Participants were randomly scheduled for six 1-day food recording days over a 2- to 3-month period. All five weekdays (Monday to Friday) and one weekend day (Sunday) were covered in scheduling the recording days.
during their reporting day) were reviewed and collated into food records the following day by trained research assistants. The amount of intake reported in the text was compared with the before- and after-eating digital photographs (after-eating digital photographs were only sent if there were leftovers) to determine if amount reported was estimated accurately or needed to be adjusted. If reports were incomplete, unclear, have discrepant information or other issues, the participant was contacted for clarification. Otherwise, the FR was cleared and logged on as completed.
Isoflavones and nutrient intake determination
Dietary intake reports on both the webFFQ and FR were coded using the Nutrition Data System for Research (NDS-R) software version 2012 developed by the Nutrition Coordinating Center, University of Minnesota, Minneap-olis, MN, for nutrient composition and analysis. The NDS-R has a comprehensive database of about 18,000 foods— which reflects variations according to preparation methods and component ingredients—and 163 nutrients/nutrient ratios/other food components derived from the USDA database and several other sources [29]. The comprehen-sive meat analogs database of the Adventist Health Study-2 [30] was utilized in determining the nutrient profile of meat analogs. Frequency values of average consumption during the past month were converted into frequency of intake per day, e.g., frequency of 1–3 per month = 2/30 = 0.067, and so on. Thus, factors used were 0 for“never/rarely”, 0.067 for “1–3 times per month”, 0.143 for“once per week”, 0.429 for“2–4 times per week”, 0.786 for“5–6 times per week”, 1.0 for“once per day”, 2.5 for“2-3 times per day”, and 5.0 for“≥4 times per day”. Nutrient amounts were relative to the fixed portion/serving sizes in the webFFQ. For vegeta-bles that are eaten either raw or cooked, the average of raw and cooked nutrient components was used. For mixed foods, recipes were created by trained RDs and nutrient composition was based on the proportion of ingredients in the recipe. For single food items where several types exist, the NDS-R software computes nutrient composition for the most commonly eaten type (the“default”food), a deter-mination made using nationally representative market research data [29]. Nutrient and isoflavones intake per day was computed afterwards using the product-sum method [27]. Daily FRs were coded on NDS-R separately for each participant.
Statistical methods
All 70 participants selected for this validation sub-study completed six recording days. However, 15 participants had to be excluded from the analyses: four due to improbable intake on the webFFQ which we predefined as >4500 kcal or <1000 kcal for boys and >3500 kcal or <900 kcal for girls, and 11 due to poor or non-compliance with the
protocol in food recording. Thus, the analyzable data was based on information from 55 participants.
Most of the nutrients and isoflavones had skewed distributions. Absolute median intake estimates from the webFFQ and the FR were compared using Wilcoxon signed-ranks test. Intake values were either log- or square root-transformed to achieve normality before Pearson’s bivariate correlation analyses were performed. Correction for within-person variation in multiple FR measurements was performed using the formula rc= ro [1 + (Sw2/nSb2)]½ [31] where rc= corrected correlation co-efficient, ro= crude correlation coefficient between FFQ and mean of the multiple food records, Sw2=
within-per-son variance of the multiple food records, Sb2= estimate
of the between person variance in the reference method (food records), and n = number of repeated measures of the food records. Using this method for deattenuation or correction of the correlation coefficients creates conditions in which normally distributed errors for rc cannot be assumed. Thus, instead of the traditional asymptotic methods to determine confidence intervals aboutrc, we computed‘distribution-free’, non-parametric 95 % confidence intervals using the bias-corrected and accelerated (BCa) bootstrap re-sampling method [32], with each confidence interval determined from the distribution ofrc’s from 2000 samples.
Analytical tests were performed without energy adjust-ment and with energy adjustadjust-ment using the residual method. The ability of the webFFQ to rank respondents according to intake was tested by determining classifica-tion agreement between quartiles of consumpclassifica-tion levels according to webFFQ responses and the mean of the multiple FR. Proportions of exact agreement, within 1 quartile agreement, and gross misclassification were also estimated. Additional graphical determination of agree-ment with the reference method using Bland-Altman plots was done for the soy isoflavones (total, daidzein, genistein, and glycitein). Total isoflavones was computed as the sum of daidzein, genistein, and glycitein. Analyses were performed using the Statistical Analysis System (SAS) statistical software package version 9.4 (SAS Insti-tute Inc., Cary, NC, USA) and R version 3.1.2 [33].
Results
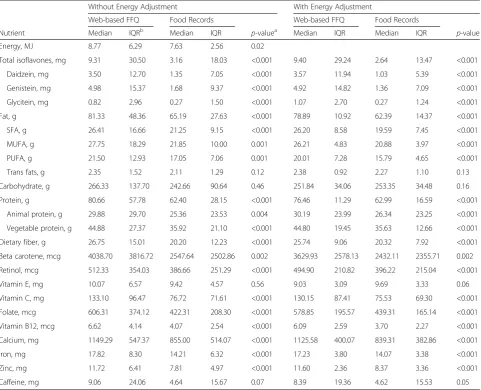
Table 2 shows the comparison of isoflavones and nutrient intake estimates between the webFFQ and the average of six 1-day FR using the Wilcoxon signed ranks test before and after energy adjustment. For most of the nutrients, estimates according to the webFFQ were higher compared to FR but not significantly for trans fats, carbohydrate, vitamin E and caffeine even after energy adjustment. WebFFQ estimates of isoflavones were about 300 % more than the FR estimates.
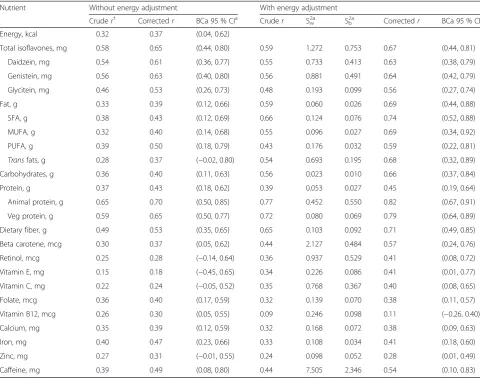
Table 3 shows the correlation coefficients before and after adjustment for energy. Deattenuated correlations for energy-adjusted soy isoflavones ranged from 0.63 to 0.67. In general, energy adjustment improved the correlation values except for folate, vitamin B12, calcium, iron, and zinc. Deattenuation after energy-adjustment further improved the correlations between the two methods for most of the nutrients except zinc, calcium, folate and iron–which remained the same or increased very slightly– and vitamin B12, which decreased to a non-significant value that was also the lowest correlation. Deattenuated energy-adjusted correlations between the two methods were weak (i.e., r< 0.35) for vitamin B12 (r= 0.11) and zinc (r= 0.26); moderate (i.e.,rbetween 0.35 and 0.50) for calcium, folate, vitamin C, iron, vitamin E, retinol, and protein; and strong (r> 0.50) for beta carotene, total fat, saturated fatty acids (SFA), monounsaturated fatty acids (MUFA), polyunsaturated fatty acids (PUFA), trans fats, animal protein, vegetable protein, and dietary fiber. Corrections for measurement error in the FR showed that within-person variances were higher than between-person
variances, an indication that this group of adolescents have a wide variation in their day-to-day intake.
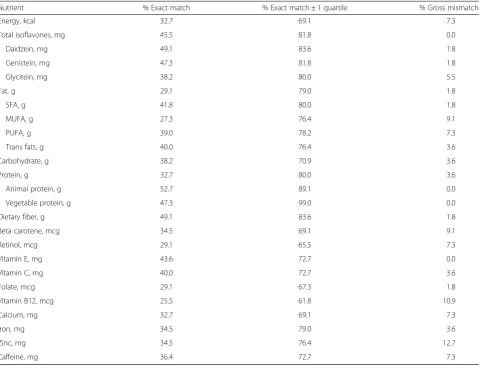
To further determine if the webFFQ provides a valid ranking of isoflavones and nutrient intake, agreement between quartile rankings on both methods was performed through cross-classification analysis (Table 4). Exact matches were moderate for soy isoflavones (38– 49 %) and high for matches within 1 quartile (80–84 %). For the nutrients, exact match was lowest for vitamin B12 (25.5 %) and highest for animal protein (52.7 %) while matches within one quartile ranged from 61.8 % (vitamin B12) to 99.0 % (vegetable protein). Gross misclassifications ranged from 0 % (total isoflavones, animal and vegetable proteins, and vitamin E) to 12.7 % (zinc). Results of the cross-classification analyses were consistent with the correlation analyses results.
Figure 1 shows the Bland-Altman graphs for total isoflavones, daidzein, genistein, and glycitein. The differ-ence between estimates on the webFFQ and FR was plotted against the mean of the estimates of the two methods. All graphs show that the mean difference line is above zero, which indicates that the webFFQ consist-ently overestimated intake relative to FR. While a few of the dots appear closer to zero, more dots are scattered both above and below the mean difference between the two methods but very few of these dots are outside the limits of agreement (shaded space). The distribution of the dots also distinctly show non-consumers—shown as a few dots flocked at 0,0—whereas the majority of the dots are spread out which indicates a larger proportion of this group were consumers with a wide variation in isoflavones intake (Fig. 1).
Discussion
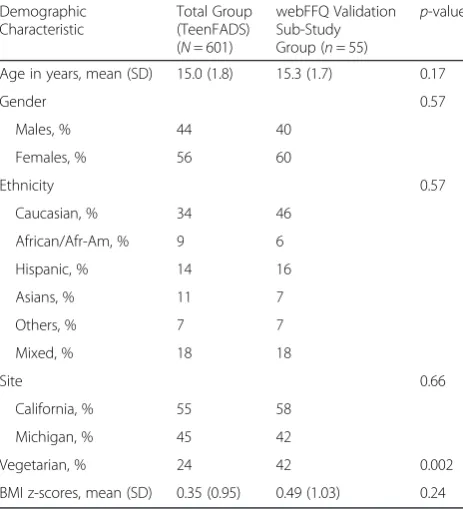
The webFFQ is a comprehensive semi-quantitative ques-tionnaire that was developed to assess isoflavones and nu-trient intake of adolescents in a population presumably exposed to soy foods. We sought to evaluate the perform-ance of this FFQ by comparing its absolute intake estimates, degree of agreement, and ranking ability with six days of 1-day FR as the reference method on soy isofla-vones (total, daidzein, genistein, and glycitein), 20 nutri-ents, and caffeine. Overall, the webFFQ performed equivalently well as the FR in ranking the intake estimates for isoflavones and most of the nutrients. Corrected energy-adjusted correlations between the webFFQ and FR were moderately strong (ris between 0.50 and 0.70) for all the isoflavones and ranged from moderate (r is between 0.3 and 0.5) to strong (r> 0.5) for 18 of the 20 nutrients. Vitamin B12 and zinc were the only nutrients with weak correlations. Degree of agreement within one quartile was within the acceptable range (62 % for vitamin B12 to 99 % for vegetable protein) and ranking ability was congruent for a substantial proportion (>80 %) of the participants Table 1Demographic characteristics of the study population
Demographic Characteristic
Total Group (TeenFADS) (N= 601)
webFFQ Validation Sub-Study Group (n= 55)
p-value
Age in years, mean (SD) 15.0 (1.8) 15.3 (1.7) 0.17
Gender 0.57
Males, % 44 40
Females, % 56 60
Ethnicity 0.57
Caucasian, % 34 46
African/Afr-Am, % 9 6
Hispanic, % 14 16
Asians, % 11 7
Others, % 7 7
Mixed, % 18 18
Site 0.66
California, % 55 58
Michigan, % 45 42
Vegetarian, % 24 42 0.002
specifically for SFA, total protein, animal protein, vege-table protein, dietary fiber and the isoflavones (total isofla-vones, daidzein, genistein, glycitein). However, compared to the FR, the webFFQ had significantly higher estimates of absolute intakes of energy, isoflavones and all nutrients, except carbohydrates, vitamin E,transfats and caffeine.
In view of the findings regarding the use of technology in the dietary assessment of young people [9], we found a high completion rate of the webFFQ (only 2 % of the par-ticipants did not complete). This could be attributed to the privacy, confidentiality of responses, and the conveni-ence of filling out the questionnaire at home, at school, or where access to a computer and the internet was available. Written food records and 24-h recalls are usually employed as standards in evaluating and validating FFQs. Given that digital photographs of foods eaten were
obtained, using FR as the reference method allowed tri-angulation when evaluating portion size estimates and in identifying carelessly omitted food items in the texted food report. Considering that digital photographs improve en-ergy and macronutrient intake estimates when combined with dietary food records [34], FR is certainly an appropri-ate alternative to the conventional written food record for this age group. Moreover, the FR afforded a cost-effective technology-based comparison method given that partici-pants were willing to use their personal phone with a built-in camera and unlimited texting.
Relative to two other web-based [24, 25] and six paper-based [35–40] FFQs for adolescents which were validated against either multiple 24-h recalls or food records, our webFFQ shares similar overestimation bias for most nutri-ents. Of these eight FFQs, all have higher estimates for Table 2Comparisonaof reported soy isoflavones and nutrient intake on the web-based food frequency questionnaire with the reference method (food records with digital photographs) without energy adjustment and with energy adjustment (n= 55)
Without Energy Adjustment With Energy Adjustment
Web-based FFQ Food Records Web-based FFQ Food Records
Nutrient Median IQRb Median IQR p-valuea Median IQR Median IQR p-value
Energy, MJ 8.77 6.29 7.63 2.56 0.02
Total isoflavones, mg 9.31 30.50 3.16 18.03 <0.001 9.40 29.24 2.64 13.47 <0.001
Daidzein, mg 3.50 12.70 1.35 7.05 <0.001 3.57 11.94 1.03 5.39 <0.001
Genistein, mg 4.98 15.37 1.68 9.37 <0.001 4.92 14.82 1.36 7.09 <0.001
Glycitein, mg 0.82 2.96 0.27 1.50 <0.001 1.07 2.70 0.27 1.24 <0.001
Fat, g 81.33 48.36 65.19 27.63 <0.001 78.89 10.92 62.39 14.37 <0.001
SFA, g 26.41 16.66 21.25 9.15 <0.001 26.20 8.58 19.59 7.45 <0.001
MUFA, g 27.75 18.29 21.85 10.00 0.001 26.21 4.83 20.88 3.97 <0.001
PUFA, g 21.50 12.93 17.05 7.06 0.001 20.01 7.28 15.79 4.65 <0.001
Trans fats, g 2.35 1.52 2.11 1.29 0.12 2.38 0.92 2.27 1.10 0.13
Carbohydrate, g 266.33 137.70 242.66 90.64 0.46 251.84 34.06 253.35 34.48 0.16
Protein, g 80.66 57.78 62.40 28.15 <0.001 76.46 11.29 62.99 16.59 <0.001
Animal protein, g 29.88 29.70 25.36 23.53 0.004 30.19 23.99 26.34 23.25 <0.001
Vegetable protein, g 44.88 27.37 35.92 21.10 <0.001 44.80 19.45 35.63 12.66 <0.001
Dietary fiber, g 26.75 15.01 20.20 12.23 <0.001 25.74 9.06 20.32 7.92 <0.001
Beta carotene, mcg 4038.70 3816.72 2547.64 2502.86 0.002 3629.93 2578.13 2432.11 2355.71 0.002
Retinol, mcg 512.33 354.03 386.66 251.29 <0.001 494.90 210.82 396.22 215.04 <0.001
Vitamin E, mg 10.07 6.57 9.42 4.57 0.56 9.03 3.09 9.69 3.33 0.06
Vitamin C, mg 133.10 96.47 76.72 71.61 <0.001 130.15 87.41 75.53 69.30 <0.001
Folate, mcg 606.31 374.12 422.31 208.30 <0.001 578.85 195.57 439.31 165.14 <0.001
Vitamin B12, mcg 6.62 4.14 4.07 2.54 <0.001 6.09 2.59 3.70 2.27 <0.001
Calcium, mg 1149.29 547.37 855.00 514.07 <0.001 1125.58 400.07 839.31 382.86 <0.001
Iron, mg 17.82 8.30 14.21 6.32 <0.001 17.23 3.80 14.07 3.38 <0.001
Zinc, mg 11.72 6.41 7.81 4.97 <0.001 11.60 2.36 8.37 3.36 <0.001
Caffeine, mg 9.06 24.06 4.64 15.67 0.07 8.39 19.36 4.62 15.53 0.05
a
Wilcoxon Signed Ranks test b
IQR, interquartile range
dietary fiber, 7 overestimated energy and fat and 6 overes-timated calcium. Out of seven FFQs that validated carbo-hydrate and protein, 6 overestimated these nutrients while 3 have higher estimates for iron. Three of the 4 FFQs that validated vitamin C and retinol have higher estimates for these nutrients; and, out of three FFQs, two overestimated magnesium and saturated fat while one overestimated fol-ate and monounsaturfol-ated fat.
Under-reporting of true intake in dietary food records [41, 42] coupled with overestimation tendencies during completion of lengthy FFQs may explain the lack of accur-acy in the absolute intake estimates in this current study. Overestimation bias may also be attributed to inherent errors associated with the methods or the nature of the study population itself. Bias associated with
under-reporting—by either a deliberate or careless omission of foods, or misreporting portions eaten, e.g., to avoid taking additional digital photographs for second helpings—and over-reporting in the webFFQ may explain the discrepan-cies between the two methods. Further investigation is needed to determine the sources of these biases.
One strength of this study was the use of a compari-son method considered least likely to have similar errors inherent in FFQs, specifically reliance on memory [27]. Another strength was that the methods used were age-appropriate, less burdensome and less time-consuming for the respondent compared to the traditional paper-based food recording. In addition, digital photographs that accompanied the food reports allowed for adjust-ment of miscalculated portion sizes and identification of Table 3Validity correlations between the webFFQ and FR estimates of nutrients and soy isoflavones, before and after energy adjustment (n= 55 adolescents)
Nutrient Without energy adjustment With energy adjustment
Cruder† Correctedr BCa 95 % CIa Cruder S w
2a S
b
2a Correctedr BCa 95 % CI
Energy, kcal 0.32 0.37 (0.04, 0.62)
Total isoflavones, mg 0.58 0.65 (0.44, 0.80) 0.59 1.272 0.753 0.67 (0.44, 0.81)
Daidzein, mg 0.54 0.61 (0.36, 0.77) 0.55 0.733 0.413 0.63 (0.38, 0.79)
Genistein, mg 0.56 0.63 (0.40, 0.80) 0.56 0.881 0.491 0.64 (0.42, 0.79)
Glycitein, mg 0.46 0.53 (0.26, 0.73) 0.48 0.193 0.099 0.56 (0.27, 0.74)
Fat, g 0.33 0.39 (0.12, 0.66) 0.59 0.060 0.026 0.69 (0.44, 0.88)
SFA, g 0.38 0.43 (0.12, 0.69) 0.66 0.124 0.076 0.74 (0.52, 0.88)
MUFA, g 0.32 0.40 (0.14, 0.68) 0.55 0.096 0.027 0.69 (0.34, 0.92)
PUFA, g 0.39 0.50 (0.18, 0.79) 0.43 0.176 0.032 0.59 (0.22, 0.81)
Transfats, g 0.28 0.37 (−0.02, 0.80) 0.54 0.693 0.195 0.68 (0.32, 0.89)
Carbohydrates, g 0.36 0.40 (0.11, 0.63) 0.56 0.023 0.010 0.66 (0.37, 0.84)
Protein, g 0.37 0.43 (0.18, 0.62) 0.39 0.053 0.027 0.45 (0.19, 0.64)
Animal protein, g 0.65 0.70 (0.50, 0.85) 0.77 0.452 0.550 0.82 (0.67, 0.91)
Veg protein, g 0.59 0.65 (0.50, 0.77) 0.72 0.080 0.069 0.79 (0.64, 0.89)
Dietary fiber, g 0.49 0.53 (0.35, 0.65) 0.65 0.103 0.092 0.71 (0.49, 0.85)
Beta carotene, mcg 0.30 0.37 (0.05, 0.62) 0.44 2.127 0.484 0.57 (0.24, 0.76)
Retinol, mcg 0.25 0.28 (−0.14, 0.64) 0.36 0.937 0.529 0.41 (0.08, 0.72)
Vitamin E, mg 0.15 0.18 (−0.45, 0.65) 0.34 0.226 0.086 0.41 (0.01, 0.77)
Vitamin C, mg 0.22 0.24 (−0.05, 0.52) 0.35 0.768 0.367 0.40 (0.08, 0.65)
Folate, mcg 0.36 0.40 (0.17, 0.59) 0.32 0.139 0.070 0.38 (0.11, 0.57)
Vitamin B12, mcg 0.26 0.30 (0.05, 0.55) 0.09 0.246 0.098 0.11 (−0.26, 0.40)
Calcium, mg 0.35 0.39 (0.12, 0.59) 0.32 0.168 0.072 0.38 (0.09, 0.63)
Iron, mg 0.40 0.47 (0.23, 0.66) 0.33 0.108 0.034 0.41 (0.18, 0.60)
Zinc, mg 0.27 0.31 (−0.01, 0.55) 0.24 0.098 0.052 0.28 (0.01, 0.49)
Caffeine, mg 0.39 0.49 (0.08, 0.80) 0.44 7.505 2.346 0.54 (0.10, 0.83)
webFFQweb-based food frequency questionnaire,FRfood records with digital photographs,SFAsaturated fatty acid,MUFAmonounsaturated fatty acid,PUFA polyunsaturated fatty acid
a
missed foods, considering that two-dimensional images could be more accurate at estimating food volume and in identifying cooking methods than 3-dimensional images [43]. Another strength was the human interven-tion in collating the final dietary food record. The follow-up calls from our research nutritionists within the next 48 h after the reporting day further ascertained the accuracy of the reports and the details needed for food components not apparently seen in the pictures.
Our study has a number of limitations. In our attempt to reduce respondent burden, our intermittent collection of 1-day food records may have not captured the inherent daily variation in intake compared to that of continuous food recording [27]. However, our results showed higher within-person than between-person variances in the 6 1-day food records. This indicates that intermittent food records can still catch daily variation in intake. Another limitation, common to most validity studies, is the use of convenience sampling and a small sample size. For this reason, we collected six FRs per participant to improve
the precision of the comparison method in capturing habitual intake. Another limitation is the lack of a bio-chemical marker to assess isoflavones intake. However, it was already demonstrated that FFQ isoflavones estimates are significantly correlated with urinary isoflavonoids in a cohort of adults that includes parents of some of these adolescents [30]. The use of digital photographs in food records made this method less burdensome to respon-dents; however, managing the texts/digital photographs and quality control of the digital photograph-assisted FR on the part of the research team was still time-consuming [28]. Likewise, although human intervention in ascertain-ing the accuracy of food records submitted by participants is a strength, it is still subject to several errors, i.e., judg-ment, inter-evaluators, and coding. On the other hand, these limitations would not differ from managing food re-cords collected through conventional methods.
Recall of dietary intake is more challenging for adolescents than adults so using the most recent past and shorter time coverage may reduce recall bias in Table 4Cross-classification of the ranked quartile nutrient and isoflavones intake estimates between the webFFQ and FR (n= 55)
Nutrient % Exact match % Exact match ± 1 quartile % Gross mismatch
Energy, kcal 32.7 69.1 7.3
Total isoflavones, mg 45.5 81.8 0.0
Daidzein, mg 49.1 83.6 1.8
Genistein, mg 47.3 81.8 1.8
Glycitein, mg 38.2 80.0 5.5
Fat, g 29.1 79.0 1.8
SFA, g 41.8 80.0 1.8
MUFA, g 27.3 76.4 9.1
PUFA, g 39.0 78.2 7.3
Trans fats, g 40.0 76.4 3.6
Carbohydrate, g 38.2 70.9 3.6
Protein, g 32.7 80.0 3.6
Animal protein, g 52.7 89.1 0.0
Vegetable protein, g 47.3 99.0 0.0
Dietary fiber, g 49.1 83.6 1.8
Beta carotene, mcg 34.5 69.1 9.1
Retinol, mcg 29.1 65.5 7.3
Vitamin E, mg 43.6 72.7 0.0
Vitamin C, mg 40.0 72.7 3.6
Folate, mcg 29.1 67.3 1.8
Vitamin B12, mcg 25.5 61.8 10.9
Calcium, mg 32.7 69.1 7.3
Iron, mg 34.5 79.0 3.6
Zinc, mg 34.5 76.4 12.7
Caffeine, mg 36.4 72.7 7.3
adolescents. This also reduces the burden of quantifying and averaging intake based on fixed portion sizes. How-ever, this approach has its adjoining disadvantages, in-cluding the reduced ability to capture seasonal variations in the diet. We were not able to do a repeat administra-tion of our webFFQ to determine if reported intakes are reproducible. A reproducibility study could have estab-lished confidence in the ability of our webFFQ to meas-ure usual intake especially when the FFQ was designed to measure intake of the most recent past.
Conclusions
Compared to multiple 1-day food record with digital photographs, the 151-item webFFQ we developed for the TeenFADS is relatively valid in ranking adolescents according to their intake of soy isoflavones and nutri-ents. However, this web-based tool significantly overesti-mates adolescents’ absolute intakes of soy isoflavones and most of the selected nutrients. Overall, the webFFQ may be used to classify adolescents in this population ac-cording to their dietary intake.
Additional files
Additional file 1: Table S1.List of foods included in the web-based food frequency questionnaire (webFFQ). (DOCX 19 kb)
Additional file 2: Figure S1.Screen shot of the web-based food frequency questionnaire. (PDF 117 kb)
Additional file 3: Figure S2.Snapshots of the Beverage and Protein Foods screens. The respondent uses the pull-down menu to indicate frequency of intake of the specified food portion size. Foods are classified according to types available, e.g., regular or diet soda for beverages and real meat or meat alternative counterpart for protein foods. (PDF 224 kb)
Additional file 4: Figure S3.Additional food information shows up when pointer hovers over the name of the food. (PDF 62 kb)
Abbreviations
BCa, bias-corrected and accelerated; BMI, body mass index; CI, confidence interval; FR, photograph-assisted food records; MUFA, monounsaturated fatty acid; NDS-R, Nutrition Data Systems for Research; PUFA, polyunsaturated fatty acid SD, standard deviation; SFA, saturated fatty acid; TeenFADS, Teen Food and Development Study; webFFQ, web-based food frequency questionnaire
Acknowledgements
The authors would like to acknowledge each Teen Food and Development Study participant and the team of research assistants and dietitians who helped with the data collection. We also thank Dr. Michelle Wien for her editorial assistance.
Funding
This study was partially supported by grants from the Soy Nutrition Institute and White Wave Foods, which took no part in any aspect of the study from conception to the preparation of the manuscript, and McLean Funds, Nutrition Department, Loma Linda University.
Availability of data and materials
Given that we still have several reports to write and submit for publication from this study, we will not be able to share our data.
Authors’contributions
JS conceived, designed and directed the study, and critically reviewed the manuscript; KO analyzed the data; GSS designed the study with JS, supervised the data collection and management, and drafted the manuscript. All authors contributed to the editing and approval of the submitted manuscript.
Competing interests
The authors declare that they have no competing interests.
Consent for publication Not applicable.
Ethics approval and consent to participate
The study protocol and the informed consent process, which required parental permission and assent of the adolescents to participate in the study, were approved by the Institutional Review Boards of Loma Linda University and Andrews University.
Received: 12 February 2016 Accepted: 15 June 2016
References
1. World Health Organization, Food and Agriculture Organization. Diet, nutrition, and the prevention of chronic diseases. Geneva: WHO; 2003. Report No.: WHO technical report series 916. Available from: http://apps. who.int/iris/bitstream/10665/42665/1/WHO_TRS_916.pdf.
2. Adair LS. Long-term consequences of nutrition and growth in early childhood and possible preventive interventions. Nestle Nutr Inst Workshop Ser. 2014;78:111–20.
3. Lynch J, Smith GD. A life course approach to chronic disease epidemiology. Annu Rev Public Health. 2005;26:1–35.
4. Mathias KC, Jacquier E, Eldridge AL. Missing lunch is associated with lower intakes of micronutrients from foods and beverages among children and adolescents in the United States. J Acad Nutr Diet. 2016;116(4):667–76.e6. 5. Pearson N, Williams L, Crawford D, Ball K. Maternal and best friends'
influences on meal-skipping behaviours. Br J Nutr. 2012;108(5):932–8. 6. Custers K, Van den Bulck J. Television viewing, computer game play and book
reading during meals are predictors of meal skipping in a cross-sectional sample of 12-, 14- and 16-year-olds. Public Health Nutr. 2010;13(4):537–43. 7. Savige G, Macfarlane A, Ball K, Worsley A, Crawford D. Snacking behaviours
of adolescents and their association with skipping meals. Int J Behav Nutr Phys Act. 2007;4:36.
8. Livingstone MBE, Robson PJ, Wallace JMW. Issues in dietary intake assessment of children and adolescents. Br J Nutr. 2004;92 Suppl 2:S213–22. 9. Boushey CJ, Kerr DA, Wright J, Lutes KD, Ebert DS, Delp EJ. Use of technology
in children's dietary assessment. Eur J Clin Nutr. 2009;63 Suppl 1:S50–7. 10. Satija A, Yu E, Willett WC, Hu FB. Understanding nutritional epidemiology
and its role in policy. Adv Nutr. 2015;6(1):5–18.
11. Rockett HR, Colditz GA. Assessing diets of children and adolescents. Am J Clin Nutr. 1997;65(4 Suppl):1116S–22.
12. Blum RE, Wei EK, Rockett HR, Langeliers JD, Leppert J, Gardner JD, et al. Validation of a food frequency questionnaire in Native American and Caucasian children 1 to 5 years of age. Matern Child Health J. 1999;3(3):167–72. 13. Buzzard IM, Stanton CA, Figueiredo M, Fries EA, Nicholson R, Hogan CJ, et
al. Development and reproducibility of a brief food frequency questionnaire for assessing the fat, fiber, and fruit and vegetable intakes of rural adolescents. J Am Diet Assoc. 2001;101(12):1438–46.
14. Cullen KW, Watson K, Zakeri I. Relative reliability and validity of the Block Kids Questionnaire among youth aged 10 to 17 years. J Am Diet Assoc. 2008;108(5):862–6.
15. Di Noia J, Contento IR. Use of a brief food frequency questionnaire for estimating daily number of servings of fruits and vegetables in a minority adolescent population. J Am Diet Assoc. 2009;109(10):1785–9.
16. Harnack LJ, Lytle LA, Story M, Galuska DA, Schmitz K, Jacobs Jr DR, et al. Reliability and validity of a brief questionnaire to assess calcium intake of middle-school-aged children. J Am Diet Assoc. 2006;106(11):1790–5. 17. Hoelscher DM, Day RS, Kelder SH, Ward JL. Reproducibility and validity of
the secondary level School-Based Nutrition Monitoring student questionnaire. J Am Diet Assoc. 2003;103(2):186–94.
18. Perks SM, Roemmich JN, Sandow-Pajewski M, Clark PA, Thomas E, Weltman A, et al. Alterations in growth and body composition during puberty. IV. Energy intake estimated by the youth-adolescent food-frequency questionnaire: validation by the doubly labeled water method. Am J Clin Nutr. 2000;72(6):1455–60.
19. Anderson JQ, Rainie L. The Future of the Internet. Washington, D. C: Pew Internet and American Life Project, Elon University School of Communications; 2012.
20. Stumbo PJ. New technology in dietary assessment: a review of digital methods in improving food record accuracy. Proc Nutr Soc. 2013;72(1):70–6. 21. Chiquete E, Ruiz-Sandoval JL, Ochoa-Guzman A, Sanchez-Orozco LV,
Lara-Zaragoza EB, Basaldua N, et al. The Quetelet index revisited in children and adults. Endocrinol Nutr. 2014;61(2):87–92.
22. Hanning RM, Royall D, Toews JE, Blashill L, Wegener J, Driezen P. Web-based Food Behaviour Questionnaire: validation with grades six to eight students. Can J Diet Pract Res. 2009;70(4):172–8.
23. Matthys C, Pynaert I, De Keyzer W, De Henauw S. Validity and reproducibility of an adolescent web-based food frequency questionnaire. J Am Diet Assoc. 2007;107(4):605–10.
24. Overby NC, Johannesen E, Jensen G, Skjaevesland AK, Haugen M. Test-retest reliability and validity of a web-based food-frequency questionnaire for adolescents aged 13–14 to be used in the Norwegian Mother and Child Cohort Study (MoBa). Food Nutr Res. 2014;58.
25. Vereecken CA, De Bourdeaudhuij I, Maes L. The HELENA online food frequency questionnaire: reproducibility and comparison with four 24-h recalls in Belgian-Flemish adolescents. Eur J Clin Nutr. 2010;64(5):541–8. 26. Cade J, Thompson R, Burley V, Warm D. Development, validation and utilisation
of food-frequency questionnaires - a review. Public Health Nutr. 2002;5(4):567–87. 27. Willett W. Nutritional Epidemiology. 3rd ed. New York: Oxford University
Press; 2013.
29. Nutrition Coordinating Center University of Minnesota. Nutrition Data System for Research (NDS-R) 2013. Minneapolis: The Nutrition Coordinating Center, Division of Epidemiology, School of Public Health, University of Minnesota; 2000. p. 2003.
30. Jaceldo-Siegl K, Fraser GE, Chan J, Franke A, Sabate J. Validation of soy protein estimates from a food-frequency questionnaire with repeated 24-h recalls and isoflavonoid excretion in overnight urine in a Western population with a wide range of soy intakes. Am J Clin Nutr. 2008;87(5): 1422–7.
31. Beaton GH, Milner J, Corey P, McGuire V, Cousins M, Stewart E, et al. Sources of variance in 24-hour dietary recall data: implications for nutrition study design and interpretation. Am J Clin Nutr. 1979;32(12):2546–59. 32. Efron B, Tibshirani RJ. An Introduction to the Bootstrap. New York:
Chapman and Hall; 1993.
33. Team R. A language and environment for statistical computing. Vienna: R Foundation for Statistical Computing; 2015.
34. Ptomey LT, Willis EA, Goetz JR, Lee J, Sullivan DK, Donnelly JE. Digital photography improves estimates of dietary intake in adolescents with intellectual and developmental disabilities. Disabil Health J. 2015;8(1):146–50. 35. Ambrosini GL, de Klerk NH, O'Sullivan TA, Beilin LJ, Oddy WH. The reliability
of a food frequency questionnaire for use among adolescents. Eur J Clin Nutr. 2009;63(10):1251–9.
36. Araujo MC, Yokoo EM, Pereira RA. Validation and calibration of a semiquantitative food frequency questionnaire designed for adolescents. J Am Diet Assoc. 2010;110(8):1170–7.
37. Rockett HR, Breitenbach M, Frazier AL, Witschi J, Wolf AM, Field AE, et al. Validation of a youth/adolescent food frequency questionnaire. Prev Med. 1997;26(6):808–16.
38. Slater B, Philippi ST, Fisberg RM, Latorre MRDO. Validation of a semi-quantitative adolescent food frequency questionnaire applied at a public school in Sao Paulo Brazil. Eur J Clin Nutr. 2003;57(5):629–35.
39. Watanabe M, Yamaoka K, Yokotsuka M, Adachi M, Tango T. Validity and reproducibility of the FFQ (FFQW82) for dietary assessment in female adolescents. Public Health Nutr. 2011;14(2):297–305.
40. Watson JF, Collins CE, Sibbritt DW, Dibley MJ, Garg ML. Reproducibility and comparative validity of a food frequency questionnaire for Australian children and adolescents. Int J Behav Nutr Phys Act. 2009;6:62. 41. Burrows TL, Martin RJ, Collins CE. A systematic review of the validity of
dietary assessment methods in children when compared with the method of doubly labeled water. J Am Diet Assoc. 2010;110(10):1501–10. 42. Gemming L, Rush E, Maddison R, Doherty A, Gant N, Utter J, et al. Wearable
cameras can reduce dietary under-reporting: Doubly labeled water validation of a camera-assisted 24 h recall. Br J Nutr. 2014;1–8. 43. Chung LM, Chung JW. Tele-dietetics with food images as dietary intake
record in nutrition assessment. Telemed J E Health. 2010;16(6):691–8.
• We accept pre-submission inquiries
• Our selector tool helps you to find the most relevant journal
• We provide round the clock customer support
• Convenient online submission
• Thorough peer review
• Inclusion in PubMed and all major indexing services • Maximum visibility for your research
Submit your manuscript at www.biomedcentral.com/submit