R E S E A R C H
Open Access
Physical activity levels six months
after a randomised controlled physical activity
intervention for Pakistani immigrant men living
in Norway
Eivind Andersen
1*, Nicola W Burton
2and Sigmund A Anderssen
1Abstract
Background:To our knowledge, no studies have aimed at improving the PA level in south Asian immigrant men residing in Western countries, and few studies have considered the relevance of SCT constructs to the PA behaviour of this group in the long term. The observed low physical activity (PA) level among south Asian immigrants in Western countries may partly explain the high prevalence of cardiovascular diseases (CVD) and type 2 diabetes (T2D) in this group. We have shown previously in a randomised controlled trial, the Physical Activity and Minority Health study (PAMH) that a social cognitive based intervention can beneficially influence PA level and subsequently reduce waist circumference and insulin resistance in the short-term. In an extended follow-up of the PAMH study: we aimed 1) to determine if the intervention produced long-term positive effects on PA level six months after intervention (follow-up 2 (FU2)), and 2) to identify the social cognitive mediators of any intervention effects. Methods:Physically inactive Pakistani immigrant men (n = 150) who were free of CVD and T2D were randomly assigned to a five months PA intervention or a control group. Six months after the intervention ended, we telephoned all those who attended FU1 and invited them for a second follow-up test (FU2) (n = 133). PA was measured using ActiGraph accelerometers. Statistical differences between groups were determined by use of ANCOVA.
Results:Significant differences (baseline to FU2) between the groups were found for all PA variables (e.g., total PA level, sedentary time, PA intensity). Support from family and outcome expectancies increased more in the intervention group compared with the control group. Self-efficacy did not differ significantly between groups.
Conclusions:Our results show that a multi component PA programme can increase PA over the short and long term in a group of immigrant Pakistani men. However, we could not identify the factors that mediated these changes in PA. Protocol ID:07112001326,NCT ID:NCT00539903
Keywords:Physical activity, Immigrants, Psychosocial mediators, Long term follow-up
Introduction
Lack of moderate- to vigorous- -intensity physical activ-ity (MVPA) is associated with a higher all-cause mortal-ity [1] and increased risk of developing coronary heart disease [2], type 2 diabetes (T2D) [3], and the metabolic syndrome [4]. A physically active lifestyle seems to be protective [5-11]. For example, in the Finnish Diabetes
Prevention Study, participants who walked for an average of 2.5 h∙week-1 were 63% to 69% less likely to develop T2D than those who walked<1 h∙week-1 [12]. A follow-up study of the participants in Finnish Diabetes Preven-tion Study showed that the relatively brief but resource-demanding intervention reduced the incidence of T2D (relative risk reduction of 36%) many years after the intervention programme [13].
Adherence to a physically active lifestyle over the long term is essential to derive sustainable health effects. However, developing interventions where the physical * Correspondence:[email protected]
1
Department of Sport Medicine, Norwegian School of Sport Sciences, Ullevaal Stadium, Box 4014, 0806 Oslo, Norway
Full list of author information is available at the end of the article
activity (PA) behaviour is maintained over the long term has proven challenging. Fewer than half of those who ini-tiate any type of PA regimen will not continue the behav-iour [14], and when interventionists and the incentives they provide are no longer available, PA tends to decline with time [14].
Interventions may be more successful at inducing sus-tained behaviour change if they involve strategies of behav-iour modification [14]. Social cognitive theory (SCT) [15] is acknowledged as one of the leading behaviour change theories to explain and predict PA in the general popula-tion [16,17] and in those with T2D [18]. The central tenet of SCT is self-efficacy (i.e., confidence to perform the be-haviour), which has been consistently and positively asso-ciated with PA [19]. Another major SCT construct is outcome expectancies (i.e., the person must value the out-comes that he/she believes will occur and that these posi-tive outcomes outweigh any negaposi-tive outcomes that might also be experienced). Other SCT constructs include the physical environment, the social environment, behavioural capability, and personal regulation. PA interventions tar-geting these constructs may use strategies such as provid-ing PA opportunities, social support, and skills trainprovid-ing; identifying PA outcomes with functional meaning; and ob-servational learning, rewards and incentives, goal setting, problem solving, and self-reward [20].
The Physical Activity and Minority Health (PAMH) study was a five month SCT based PA programme for sedentary Pakistani immigrant men living in Norway. The low levels of PA among south Asian immigrants (which includes those from Pakistan, India, Sri Lanka, Nepal, and Bangladesh) in Western countries [21-28] are likely to contribute to the high prevalence of T2D and CVD [21,22,29-36]. To our knowledge, only a few inter-ventions have aimed at improving the PA level in south Asian immigrant men residing in Western countries, but none of these have reported on the long-term effects of the intervention [37]. In addition only one of these had a randomised controlled design [38]. This latter study was however, not designed to test the effect of a behaviour change program on the PA behaviour, but rather to test the effect of a structured exercise program over 12 weeks on insulin sensitivity. Also, few interventions have con-sidered the relevance of SCT constructs to the PA behav-iour of this group. As reported previously, a randomised controlled trial (RCT) of the intervention found positive short-term improvements (immediately after the inter-vention; follow-up 1 (FU1)) in PA level and accompany-ing beneficial changes in insulin sensitivity and waist circumference ([39] in press). The aims of the current study were: 1) to determine if the intervention produced long-term (six months after the intervention; follow-up 2 (FU2)) positive effects on PA level, and 2) to identify the social cognitive mediators of any intervention effects.
Methods
The design, the intervention programme and methods of the PAMH study have been described in detail previously ([39] in press), a short description is given below. The study protocol was approved by the Regional Committee for Medical Research Ethics (ref. no. S-07300b) and the Norwegian Social Science Data Services (ref. no. 17212/ 2/KS). All participants gave written informed consent.
Participants
For the original RCT, 150 participants, recruited through mosques and Muslim festivals, were randomised to ei-ther an intervention group or a control group at the baseline visit using a computer-generated list of random numbers. Pakistani (either born in Pakistan or parents born in Pakistan) immigrant men living in Oslo, Norway who were aged 25 to 60 years and who were not too physically active (i.e., they were excluded if they were ex-ercising more than twice a week at a moderate or higher intensity for≥30 min or cycling or walking to work most days of the week) were eligible for inclusion. Participants were not eligible if they had diabetes, did not speak Nor-wegian or had a severe injury. Seventeen participants were lost to FU1. Six months after the intervention ended, we telephoned all those who had attended FU1 and invited them to the FU2 (n = 133). Three partici-pants declined, leaving 130 participartici-pants in the FU2 study. A scheme of the flow of participants through the trial is presented in the Figure 1.
Intervention programme
32 Ineligible:
Assessed for eligibility (n=182)
Enrolment
5 too old
8 too physically active
10 diabetes patients
2 severely injured
7 did not speak Norwegian
Baseline test (n = 150)
Excluded from analysis (PA level) (n = 8). Reasons for exclusion: see text
vvvhv
Randomised (n = 150)
kkkkkjjgggggg
Allocati
on
Allocated to intervention (n = 89)
Allocated to control (n = 61)
ggggggg
Follow-up 1 (FU1) test (n = 133)
60% 40%
Lost to FU1 (n = 9)
Reason: not interested (n = 9)
ffffffffff
Lost to FU1 (n = 8)
Reason: not interested (n = 8)
d
A
n
alysis
Analysed (PA level) (n = 76)
Reasons for exclusion: see text
jjjjjjjjjjjj
Analysed (PA level) (n = 50)
Reasons for exclusion: see text
jjjjjjjjjjjjj
Follow-up 2 (FU2) test (n = 130)
Lost to FU2 (n = 2)
Reason: not interested (n = 2)
ffffffffff
Lost to FU2 (n = 1)
Reason: not interested (n = 1)
fffffffff
A
n
alysis
Analysed (PA level) (n = 38)
jjjjjjjjjjj
Reasons for exclusion: see text
Analysed (PA level) (n = 59)
jjjjjjjjjjjjj
Reasons for exclusion: see text
Measurements
The 130 participants who agreed to participate in the FU2 study were sent a package by mail containing a pre-programmed accelerometer and information on how and when to use it, a questionnaire and a prepaid envelope for return.
Accelerometer recordings
Free-living PA was assessed using the ActiGraph acceler-ometers (ActiGraph, LLC, Pensacola, FL, USA). An ac-celerometer is an instrument that continuously measures acceleration, and the raw data from this instrument are called “counts”, which represent the sum of acceleration
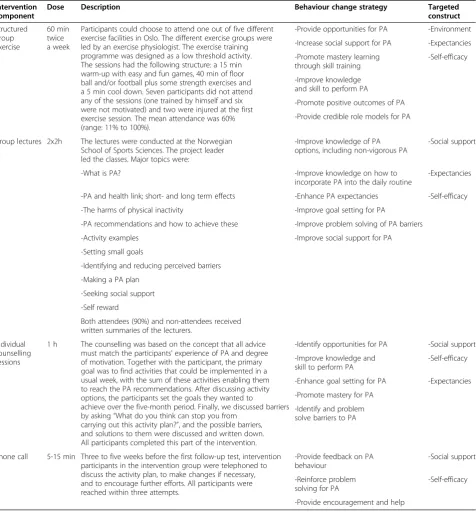
Table 1 Overview of the intervention components, attendance rates, behaviour change strategies and targeted social cognitive constructs
Intervention component
Dose Description Behaviour change strategy Targeted
construct
Structured group exercise
60 min twice a week
Participants could choose to attend one out of five different exercise facilities in Oslo. The different exercise groups were led by an exercise physiologist. The exercise training programme was designed as a low threshold activity. The sessions had the following structure: a 15 min warm-up with easy and fun games, 40 min of floor ball and/or football plus some strength exercises and a 5 min cool down. Seven participants did not attend any of the sessions (one trained by himself and six were not motivated) and two were injured at the first exercise session. The mean attendance was 60% (range: 11% to 100%).
-Provide opportunities for PA -Environment
-Increase social support for PA -Expectancies
-Promote mastery learning through skill training
-Self-efficacy
-Improve knowledge and skill to perform PA
-Promote positive outcomes of PA
-Provide credible role models for PA
Group lectures 2x2h The lectures were conducted at the Norwegian School of Sports Sciences. The project leader led the classes. Major topics were:
-Improve knowledge of PA options, including non-vigorous PA
-Social support
-What is PA? -Improve knowledge on how to
incorporate PA into the daily routine
-Expectancies
-PA and health link; short- and long term effects -Enhance PA expectancies -Self-efficacy
-The harms of physical inactivity -Improve goal setting for PA
-PA recommendations and how to achieve these -Improve problem solving of PA barriers
-Activity examples -Improve social support for PA
-Setting small goals
-Identifying and reducing perceived barriers
-Making a PA plan
-Seeking social support
-Self reward
Both attendees (90%) and non-attendees received written summaries of the lecturers.
Individual counselling sessions
1 h The counselling was based on the concept that all advice must match the participants’experience of PA and degree of motivation. Together with the participant, the primary goal was to find activities that could be implemented in a usual week, with the sum of these activities enabling them to reach the PA recommendations. After discussing activity options, the participants set the goals they wanted to
achieve over the five-month period. Finally, we discussed barriers by asking“What do you think can stop you from
carrying out this activity plan?”, and the possible barriers, and solutions to them were discussed and written down. All participants completed this part of the intervention.
-Identify opportunities for PA -Social support
-Improve knowledge and skill to perform PA
-Self-efficacy
-Enhance goal setting for PA -Expectancies
-Promote mastery for PA
-Identify and problem solve barriers to PA
Phone call 5-15 min Three to five weeks before the first follow-up test, intervention participants in the intervention group were telephoned to discuss the activity plan, to make changes if necessary, and to encourage further efforts. All participants were reached within three attempts.
-Provide feedback on PA behaviour
-Social support
-Reinforce problem solving for PA
-Self-efficacy
in a given time period. The activity monitor model 7164 was used at baseline and FU1, and the GT1M model at the FU2 test. The different types of Actigraph acceler-ometers have been shown to produce the same results during walking and running [40].
The primary outcome variable from the accelerometer data was the average counts per minute per day (CPM) (an indicator of the total PA level) throughout the seven-day measurement period. The secondary outcomes were the minutes spent sedentary behaviour, and in light-, moderate-, vigorous- and very vigorous-intensity PA using the following cut point (all in CPM): sedentary be-haviour≤100 CPM [41], light intensity PA, 101 to 1951 [42]; moderate intensity PA, 1952 to 5724; vigorous inten-sity PA, 5725 to 9497; and very vigorous inteninten-sity PA> 9497 [43]. These cut points are used widely and correlate with maximal oxygen uptake (r = 0.88) [43].
The participants were instructed to wear the acceler-ometer on the right hip during all waking hours, except while swimming and bathing, for seven days. The accel-erometers were programmed to start recording at 6 am the day after the participants received their accelerom-eter. The epoch length (sample interval) was set to 1 min. In the analysis of accelerometer data, epoch peri-ods with a value of zero for 60 min (with allowance for two exceptions above zero) or longer were interpreted as “accelerometer not worn” and removed from the ana-lyses [42,44]. PA data were used if the participant had accumulated a minimum of eight hours of activity data per day for at least two days, regardless of the type of day (workday or weekends). CPM did not differ between those who wore the monitor for two days (baseline: n = 7, FU1: n = 3) and those who wore the monitor for three days or more. Subsequently, data from those participants who had worn the monitor for two days were also included [45]. Accelerometer data were processed and analysed using the SAS-based (version 9) (SAS Institute Inc. Cary, NC, USA) program CSA-Analyser (http://csa. svenssonsport.dk).
One hundred and forty-two participants (95%) had valid recordings at the baseline test: four lost their moni-tor and four had fewer than two valid days of recordings. At the FU1 test, 126 participants (84%) had valid record-ings: 17 did not attend FU1, five had fewer than two days of recordings, and two did not return their accelerom-eter. Of the 130 participants at the FU2 test, we had valid accelerometer recordings on 97 (65%) of the ori-ginal baseline sample: 12 participants sent the monitor back without having used it, six had fewer than two days of valid recordings and 15 did not return the monitor (Figure 1).
The participants wore the monitor for an average of 6.3 ± 1.8 days (mean ± standard deviation (SD)) at base-line, 6.1 ± 1.5 days at FU1, and 5.6 ± 1.6 days at FU2. The
mean (± SD) wearing time was 13.5 ± 1.5 h∙day-1
at base-line, 13.6 ± 1.6 h∙day-1 at FU1 and 13.3 ± 1.9 h∙day-1
at FU2.
Social cognitive variables
The following potential mediators of change in PA were measured by questionnaire scales: self-efficacy, social support for PA, and outcome expectancies. These vari-ables were selected as the primary targets of the inter-vention. All scales were derived or modified from previously developed and validated scales (Table 2). The measurement properties of these scales are summarised in Table 2. The mean score of all relevant items was computed for each scale, for participants with a response rate of 75% or greater on the respective item [46]. Gener-ally, internal consistency (Cronbach’s alpha) properties were satisfactory (Table 2). Information about barriers to PA was collected by asking the participants to; “Rate how relevant the listed barriers are for you”. The scale went from 0 (not a barrier) to 5 (very relevant).
Statistical analyses
The outcome data were analysed on a per protocol basis, without imputations. Delta PA scores and the potential psychosocial mediators were calculated (baseline to FU2), and used as the dependent variable in the analysis of covariance (ANCOVA), and with baseline measure-ments and age as covariates when calculating the signifi-cance of differences between the groups. Independent and paired-sample t tests were used to test differences between and within groups at the baseline, respectively, and t tests were used for the drop-out analysis. Effect sizes were calculated as: delta mean in the intervention group - delta mean in the control group / standard devi-ation of delta mean in the control group. According to Baron and Kenny (1986), several steps are required to demonstrate a mediation effect [49]. The criterion for a change in the hypothesised mediator to be associated with the change in PA was not met in the current study, and thus further analysis was not undertaken.
Results
Socio-demographics
espe-cially the taxi drivers [51]. Table 3 presents more of the baseline characteristics.
Attrition
Of the 133 participants who completed FU1, three declined the FU2 test, and 19 in the intervention group and 14 in the control group did not have valid acceler-ometer recordings at the FU2 test. At baseline, those with valid accelerometer recordings at FU2 (n = 97) had a lower postprandial glucose level (mean difference =− 1.2: 95% CI (confidence interval) =− 0.04 to - 2.4; P = 0.04) and fasting insulin level (mean difference =− 22: 95% CI =−1.0 to - 43; P = 0.04) and higher CPM (mean difference = 49: 95% CI = 6.9 to 91; P = 0.02), compared with those with invalid accelerometer recordings at FU2 or drop-outs (n = 53).
Physical activity
Table 4 displays the PA data at all the three measure-ments times for the intervention and control groups. The delta differences (baseline to FU2) in all PA variables differed significantly between groups. CPM on both
weekends and workdays changed more in the interven-tion group than in the control group. The interveninterven-tion group had 84 more minutes of MVPA and 7.7 fewer hours of inactive time per week than the control group.
The intervention group increased the total PA level from baseline to the FU2 by a mean of 36 CPM (95% CI = 4 to 70; P = 0.02), an increase of 10% (95% CI = 2 to 17) and time spent in MVPA by an average of 7.3 min∙day-1 (95% CI = 0.8 to 13.7; P = 0.03), an increase of 21% (95% CI = 10 to 31). The intervention group reduced sedentary time by a mean of 0.7 hours∙day-1 (95% CI =−0.3 to −1.1; P = 0.001), a reduction of 9% (95% CI = 1.5 to 16). The PA vari-ables did not change in the control group.
In the intervention group, the only significant change in PA characteristics from FU1 to FU2 was sedentary time, which was lower at the FU2 test (mean difference −0.5, 95% CI =−0.04 to −0.9; P = 0.03). In the control group, CPM (mean difference−38, 95% CI =−64 to−11; P = 0.006) and light intensity (mean difference−0.5, 95% CI =−0.9 to−0.1; P = 0.01) decreased from FU1 to FU2.
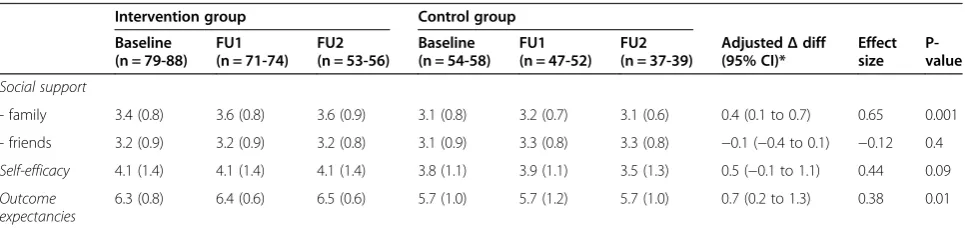
Social cognitive variables
Except for a higher score on outcome expectancies in the intervention group (mean difference = 0.6, 95% CI = 0.9 to 0.2; P<0.01), none of the social cognitive vari-ables differed between the two groups at baseline.
Support from family and outcome expectancies
increased more from baseline to FU2 in the intervention group than in the control group (Table 5). In the inter-vention group the participants scored higher at FU2 on social support from family (mean difference = 0.3, 95% CI = 0.07 to 0.45; P = 0.008) and outcome expectancies (mean difference = 0.3, 95% CI = 0.08 to 0.6; P = 0.01). Self-efficacy and social support from friends did not change.
The intervention group perceived six of the 15 listed PA barriers to be less of an obstacle than did the control group. A significant change (from baseline to FU2) was found for the following barriers: time constraints (mean difference = 0.7, 95% CI = 0.0 to 1.5; P = 0.04), not the
Table 3 Baseline characteristics for the intervention and the control group
Characteristic Intervention group
Control group
Mean difference
(n = 89) (n = 61) (95% CI)
Age (years) 35.7 (6.1) 39.7 (9.2) −3.9 (−6.6 to−1.2)*
Weight (kg) 83.7 (12) 84.1 (14.4) −0.3 (−4.7 to 4.1)
Height (cm) 174 (6.2) 174 (6.2) 0.6 (−1.3 to 2.7)
BMI (kg.m-²) 27.1 (3.2) 27.4 (4.2) −0.2 (−1.5 to 0.9)
Waist
circumference (cm)
98 (9) 99 (11) −1.1 (−4.6 to 2.3)
Peak VO2 (ml·kg-1·min-1)†
33.9 (5.2) 34.7 (6.5) −0.7 (−3.4 to 1.9)
Values are mean (standard deviation). The independent-samplettest was used to calculate significance of the difference between groups.CIconfidence interval,BMIbody mass index. * P = 0.005.†n = 30 and 69 for the control and the intervention groups, respectively.
Table 2 Measurement properties of psychosocial scales
Variable Number of items /
response format
Example of sample items Original reference source on which items were based
Cronbach`s alpha Baseline, FU1 and FU2 (range)
Social support Have your family/friends… [47]
- family 6 / 1 (never) - 5 (very often) …Encouraged you to be physically active?
0.85-0.87
- friends 6 / 1 (never) - 5 (very often) 0.87-0.88
Self-efficacy 7 / 1 (not at all confident) - 7 (very confident)
I am confident I can participate in planned physical activity when…I am tired
[48] 0.87-0.89
Outcome expectancies 6 / 1 (unlikely)–7 (very likely) If I am regularly physically active in the next month…Iwill get in better shape
sporty type (mean difference = 1.2, 95% CI = 0.4 to 2.0; P = 0.002), lack of motivation (mean difference = 1.1, 95% CI = 0.3 to 2.0; P = 0.009), too expensive (mean difference = 1.0, 95% CI = 0.2 to 1.8; P = 0.01), don’t know how (mean difference = 1.2, 95% CI = 0.3 to 2.1; P = 0.008), and don’t find any activities that are okay to do (mean difference = 1.1, 95% CI = 0.3 to 2.0; P = 0.01).
Changes in the SCT constructs from baseline to FU1 did not correlate with changes in PA (CPM) from baseline to FU2 (data not shown). Therefore, mediation analysis could not be undertaken [49].
Discussion
We have shown that a relatively simple PA programme can lead to both short- and long-term improvements in PA level among a sedentary, overweight, male, south Asian immigrant population, although the social cogni-tive mediators did not change markedly. The differences in CPM and MVPA between groups at FU1 were sus-tained and even increased at the six months follow-up (FU2). Inactive time, which did not change significantly from baseline to FU1, decreased significantly from base-line to FU2 in the intervention group compared with the control group.
Although the PA level increased from baseline to FU2, changes in the potential social cognitive mediators did not correlate with the change in PA, and mediation ana-lyses could not be performed. The lack of correlation might be because there were other unmeasured factors that mediated the change in PA such as social support from the exercise leader or perceived access to facilities. Another possible explanation is that the intervention did not adequately address the potential mediators or that the intervention was not of sufficient length to achieve greater changes in these variables. It might also be that the social cognitive measures have not been validated on this group. Another explanation is a ceiling effect, mean-ing that the participants scored relatively high on many of the variables at baseline and further improvements were therefore difficult to achieve, and the small changes make it difficult to obtain significant correlations with PA. The results may also be biased because the partici-pants were not physically active when the baseline test-ing was conducted and this may have made it difficult for them to answer the questions properly.
Compared with the control group, in the intervention group, only social support from family and outcome ex-pectancies increased in the intervention group from baseline to FU2, although the change in self-efficacy was
Table 5 Mean and standard deviation of social cognitive variables at all the three measurement times
Intervention group Control group
Baseline FU1 FU2 Baseline FU1 FU2 AdjustedΔdiff Effect
size P-value (n = 79-88) (n = 71-74) (n = 53-56) (n = 54-58) (n = 47-52) (n = 37-39) (95% CI)*
Social support
- family 3.4 (0.8) 3.6 (0.8) 3.6 (0.9) 3.1 (0.8) 3.2 (0.7) 3.1 (0.6) 0.4 (0.1 to 0.7) 0.65 0.001
- friends 3.2 (0.9) 3.2 (0.9) 3.2 (0.8) 3.1 (0.9) 3.3 (0.8) 3.3 (0.8) −0.1 (−0.4 to 0.1) −0.12 0.4
Self-efficacy 4.1 (1.4) 4.1 (1.4) 4.1 (1.4) 3.8 (1.1) 3.9 (1.1) 3.5 (1.3) 0.5 (−0.1 to 1.1) 0.44 0.09
Outcome expectancies
6.3 (0.8) 6.4 (0.6) 6.5 (0.6) 5.7 (1.0) 5.7 (1.2) 5.7 (1.0) 0.7 (0.2 to 1.3) 0.38 0.01
* Difference (baseline to FU2), all variables were adjusted for their respective baseline value and age. ANCOVA was used to analyse the data.CIconfidence interval,
FU1follow-up 1 (conducted immediately after the intervention),FU2follow-up 2 (conducted six months after the intervention). Note; Self efficacy and outcome expectancies range from 1 to 7; Social support range from 1 to 5.
Table 4 Mean and standard deviation of physical activity data at the three measurement times
Intervention group Control group
Baseline FU1 FU2 Baseline FU1 FU2 AdjustedΔdiff
(95% CI)*
Effect size
P-value
Total PA level (CPM) 328 (138) 407 (149) 389 (137) 281 (118) 317 (129) 260 (99) 81 (36 to 126) 0.64 0.001
PA level on weekends (CPM)† 304 (150) 422 (188) 370 (150) 278 (142) 319 (147) 249 (136) 124 (44 to 203) 0.47 0.003 PA level on weekdays (CPM) 332 (143) 407 (157) 388 (148) 283 (128) 320 (144) 265 (98) 72 (23 to 120) 0.48 0.004
Sedentary time (hours.day-1) 8.4 (1.6) 7.9 (1.8) 7.7 (1.5) 8.9 (1.5) 8.9 (1.5) 9.3 (1.4)
−1.1 (−1.8 to−0.5) −0.23 0.001 Light intensity PA (hours.day-1) 4.5 (1.4) 5.0 (1.2) 5.0 (1.2) 4.0 (1.0) 4.0 (1.1) 3.6 (1.0) 1.1 (0.6 to 1.6) 0.64 <0.001
MVPA (min.day-1) 35 (21) 46 (23) 44 (23) 28 (19) 33 (21) 27 (17) 12 (4.4 to 21.1) 0.72 0.003
* Difference (baseline to FU2), all variables were adjusted for their respective baseline value and age. ANCOVA was used to analyse the data.†n = 41 and 30 at the FU2 for the intervention and the control groups, respectively.PAphysical activity,CPMcounts per min,MVPAmoderate and vigorous physical activity,CI
borderline significant. This means that the participants in the intervention group reported more support for being physically active, stronger beliefs that positive out-comes will follow participation in PA, and the perception that they had more control over being physically active when faced with barriers (e.g., time constraints). The intervention group perceived many of the PA barriers to be less of an obstacle for engaging in PA than did the control group. Although not individually correlated with changes in PA, the small differences in the aforemen-tioned variables might together have contributed signifi-cantly to the increased engagement in PA. These changes could have resulted from specific programme strategies such as having access to low-threshold exercise classes with people who are similar to oneself (same level of physical fitness and skills), help in structuring the week and planning for PA, professionals being available to address PA related problems (trainer), and increased knowledge of PA.
Our results are encouraging because immigrants/eth-nic minorities are considered an important group for health interventions but are also considered a challen-ging group to recruit into this kind of study. Some stud-ies have addressed PA in other ethnic minority groups. In a review of 14 studies mainly on African-Americans, the interventions included a wide range of approaches: community oriented, family oriented, church based and home based [52]. Only four studies had a randomised controlled design. Overall, the results from the interven-tions were disappointing, and only two studies achieved changes in PA level. In the review by Taylor et al. (1998) the authors concluded that it is not clear which factors are critical for efficacious interventions but that commu-nity/participant involvement and a thorough assessment of needs, attitudes, preferences and unique barriers be-fore the implementation of the intervention seem im-portant [52]. Interventions should therefore be tailored specifically to the targeted ethnic group because ethnic minority populations might have specific barriers to and mediators of PA that differ from other groups [53]. The use of focus groups and people from the target group in the planning and implementation phases of the project in the PAMH study might therefore have been vital to the success of this programme. For example the focus groups meetings revealed a lack of knowledge of what PA is and that floor ball is a familiar sport; this informa-tion was useful for designing our interveninforma-tion. In addition, members of the target group offered assistance in the recruitment phase and this may have been essen-tial for the interest in the project that was created in the milieu. This view is supported by the findings in a sys-tematic review in ethnic minorities, in which community participation was found to be very important for publi-cizing the intervention and increasing accessibility [37].
Strengths and limitations
The PA programme used an SCT framework and was tailored to each individual’s specific interests and prefer-ences, and aimed to enable the participants to incorpor-ate more PA into their daily routine. The PA behaviour was targeted through multiple intervention components, but because we did not undertake any process evalu-ation, we do not know the contribution of each of the various components. The lack of anthropometric and blood measures preclude any conclusions about the clin-ical value of the increased PA level. However, the increased PA level (both CPM and MVPA) in the inter-vention group at FU1 was sustained at FU2, and one might expect that the improvements in waist circumfer-ence and insulin resistance demonstrated at FU1 would also be present at FU2. The intervention group had a significantly higher PA level than the control group at baseline. In theory, this could mean a lower potential for intervention, which might have led to underestimation of the long-term effects compared with a situation in which the two groups were similar at baseline. A major limita-tion is the attrilimita-tion between baseline and FU2, which may have caused loss of the feature of randomisation [54]. Those who did drop out of the study had a lower PA level at baseline than those who did not drop out, and this might indicate that the intervention was more suitable for those who engaged in a minimum of PA at the start. It was not possible to satisfy the criterion of masking the exercise instructors or the participants from group allocation. RCTs that are not blinded tend to show greater intervention effects than RCTs that have this fea-ture [55]. Finally, persons who respond to this type of study could be motivated to increase their PA level, and so the external validity regarding wider populations may be questionable. Internally, however, a randomised design should prevent this from affecting the results.
Conclusions
Our results show that a multi component PA programme can increase PA in a group of immigrant Pakistani men in both the short and long term. However, we do not known what factors mediated these changes in PA.
Abbreviations
ANCOVA: Analysis of covariance; BMI: Body mass index; CI: Confidence interval; CPM: Counts per minute; CVD: Cardiovascular diseases; FU1: Follow-up 1; FU2: Follow-Follow-up 2; MVPA: Moderate- to vigorous intensity physical activity; PA: Physical Activity; PAMH: Physical activity and minority health; RCT: Randomised controlled trial; SCT: Social cognitive theory; T2D: Type 2 diabetes.
Competing interest
The authors declare that there are no competing interests.
Acknowledgements
This project was supported financially by the Norwegian ExtraFoundation for Health and Rehabilitation through EXTRA funds and the Norwegian School of Sport Sciences, Department of Sport Medicine. We would also like to thank our participants without whom this project would not have been possible.
Author details
1Department of Sport Medicine, Norwegian School of Sport Sciences, Ullevaal
Stadium, Box 4014, 0806 Oslo, Norway.2School of Human Movement Studies, The University of Queensland, Brisbane, Australia.
Authors’contributions
EA conceived and designed the study, performed all the statistical analysis, interpreted the data, and performed all testing and analysis. SAA conceived and designed the study. NWB interpreted the data. All authors participated in drafting and revising the article and approved the final version to be published.
Received: 24 August 2011 Accepted: 26 April 2012 Published: 26 April 2012
References
1. Leitzmann MF, Park Y, Blair A, Ballard-Barbash R, Mouw T, Hollenbeck AR, et al:Physical activity recommendations and decreased risk of mortality. Arch Intern Med2007,167:2453–2460.
2. Powell KE, Thompson PD, Caspersen CJ, Kendrick JS:Physical activity and the incidence of coronary heart disease.Annu Rev Public Health1987, 8:253–287.
3. Jeon CY, Lokken RP, Hu FB, van Dam RM:Physical activity of moderate intensity and risk of type 2 diabetes: a systematic review.Diabetes Care 2007,30:744–752.
4. Laaksonen DE, Lakka HM, Salonen JT, Niskanen LK, Rauramaa R, Lakka TA: Low levels of leisure-time physical activity and cardiorespiratory fitness predict development of the metabolic syndrome.Diabetes Care2002, 25:1612–1618.
5. Lee IM, Skerrett PJ:Physical activity and all-cause mortality: what is the dose–response relation?Med Sci Sports Exerc2001,33:S459–S471. 6. Sofi F, Capalbo A, Cesari F, Abbate R, Gensini GF:Physical activity during
leisure time and primary prevention of coronary heart disease: an updated meta-analysis of cohort studies.Eur J Cardiovasc Prev Rehabil 2008,15:247–257.
7. Tuomilehto J, Lindstrom J, Eriksson JG, Valle TT, Hamalainen H, Ilanne-Parikka P,et al:Prevention of type 2 diabetes mellitus by changes in lifestyle among subjects with impaired glucose tolerance.N Engl J Med2001, 344:1343–1350.
8. Knowler WC, Barrett-Connor E, Fowler SE, Hamman RF, Lachin JM, Walker EA,et al:Reduction in the incidence of type 2 diabetes with lifestyle intervention or metformin.N Engl J Med2002,346:393–403. 9. Anderssen SA, Carroll S, Urdal P, Holme I:Combined diet and exercise
intervention reverses the metabolic syndrome in middle-aged males: results from the Oslo Diet and Exercise Study.Scand J Med Sci Sports 2007,17:687–695.
10. Leon AS, Sanchez OA:Response of blood lipids to exercise training alone or combined with dietary intervention.Med Sci Sports Exerc2001,33:S502–S515. 11. Cornelissen VA, Fagard RH:Effects of endurance training on blood
pressure, blood pressure-regulating mechanisms, and cardiovascular risk factors.Hypertension2005,46:667–675.
12. Laaksonen DE, Lindstrom J, Lakka TA, Eriksson JG, Niskanen L, Wikstrom K, et al:Physical activity in the prevention of type 2 diabetes: the Finnish diabetes prevention study.Diabetes2005,54:158–165.
13. Lindstrom J, Ilanne-Parikka P, Peltonen M, Aunola S, Eriksson JG, Hemio K, et al:Sustained reduction in the incidence of type 2 diabetes by lifestyle intervention: follow-up of the Finnish Diabetes Prevention Study.Lancet 2006,368:1673–1679.
14. Marcus BH, Williams DM, Dubbert PM, Sallis JF, King AC, Yancey AK,et al: Physical activity intervention studies: what we know and what we need to know: a scientific statement from the American Heart Association Council on Nutrition, Physical Activity, and Metabolism (Subcommittee on Physical Activity); Council on Cardiovascular Disease in the Young; and the Interdisciplinary Working Group on Quality of Care and Outcomes Research.Circulation2006,114:2739–2752.
15. Bandura A:Health promotion by social cognitive means.Health Educ Behav2004,31:143–164.
16. Marcus BH, King TK, Clark MM, Pinto BM, Bock BC:Theories and techniques for promoting physical activity behaviours.Sports Med1996,5:321–331. 17. Keller C, Fleury J, Gregor-Holt N, Thompson T:Predictive ability of social cognitive theory in exercise research: An integrated literature review. Online J Knowl Synth Nurs1999,2:19–31.
18. Allen NA:Social cognitive theory in diabetes exercise research: an integrative literature review.Diabetes Educ2004,30:805–819. 19. Bauman AE, Sallis JF, Dzewaltowski DA, Owen N:Toward a better
understanding of the influences on physical activity: the role of determinants, correlates, causal variables, mediators, moderators, and confounders.Am J Prev Med2002,23:5–14.
20. Luszczynska A, Schwarzer R:Social cognitive theory. InPrediciting health behaviour. 2nd edition. Edited by Conner M, Norman P. Buckingham, England: Open University Press; 2008:127–169.
21. Jenum AK, Holme I, Graff-Iversen S, Birkeland KI:Ethnicity and sex are strong determinants of diabetes in an urban Western society: implications for prevention.Diabetologia2005,48:435–439. 22. Kumar BN, Selmer R, Lindman AS, Tverdal A, Falster K, Meyer HE:Ethnic
differences in SCORE cardiovascular risk in Oslo, Norway.Eur J Cardiovasc Prev Rehabil2009,16:229–234.
23. Fischbacher CM, Hunt S, Alexander L:How physically active are South Asians in the United Kingdom? A literature review.J Public Health (Oxf ) 2004,26:250–258.
24. Williams ED, Stamatakis E, Chandola T, Hamer M:Assessment of physical activity levels in South Asians in the UK: findings from the Health Survey for England.J Epidemiol Community Health2011,65:517–521.
25. Kolt GS, Schofield GM, Rush EC, Oliver M, Chadha NK:Body fatness, physical activity, and nutritional behaviours in Asian Indian immigrants to New Zealand.Asia Pac J Clin Nutr2007,16:663–670.
26. Palaniappan LP, Araneta MR, Assimes TL, Barrett-Connor EL, Carnethon MR, Criqui MH,et al:Call to action: cardiovascular disease in Asian Americans: a science advisory from the American Heart Association.Circulation2010, 122:1242–1252.
27. Dassanayake J, Dharmage SC, Gurrin L, Sundararajan V, Payne WR:Are Australian immigrants at a risk of being physically inactive?Int J Behav Nutr Phys Act2011,8:53.
28. Tremblay MS, Bryan SN, Perez CE, Ardern CI, Katzmarzyk PT:Physical activity and immigrant status: evidence from the Canadian Community Health Survey.Can J Public Health2006,97:277–282.
29. Bellary S, O'Hare JP, Raymond NT, Mughal S, Hanif WM, Jones A,et al: Premature cardiovascular events and mortality in south Asians with type 2 diabetes in the United Kingdom Asian Diabetes Study - effect of ethnicity on risk.Curr Med Res Opin2010,26:1873–1879.
30. Dassanayake J, Dharmage SC, Gurrin L, Sundararajan V, Payne WR:Are immigrants at risk of heart disease in Australia? A systematic review.Aust Health Rev2009,33:479–491.
32. Bhopal R, Fischbacher C, Vartiainen E, Unwin N, White M, Alberti G: Predicted and observed cardiovascular disease in South Asians: application of FINRISK, Framingham and SCORE models to Newcastle Heart Project data.J Public Health (Oxf )2005,27:93–100.
33. Rajpathak SN, Gupta LS, Waddell EN, Upadhyay UD, Wildman RP, Kaplan R, et al:Elevated risk of type 2 diabetes and metabolic syndrome among Asians and south Asians: results from the 2004 New York City HANES. Ethn Dis2010,20:225–230.
34. Creatore MI, Moineddin R, Booth G, Manuel DH, DesMeules M, McDermott S,et al:Age- and sex-related prevalence of diabetes mellitus among immigrants to Ontario, Canada.CMAJ2010,182:781–789.
35. Mather HM, Keen H:The Southall Diabetes Survey: prevalence of known diabetes in Asians and Europeans.Br Med J (Clin Res Ed)1985,291:1081–1084. 36. Wandell PE, Carlsson A, Steiner KH:Prevalence of diabetes among
immigrants in the Nordic countries.Curr Diabetes Rev2010,6:126–133. 37. Netto G, Bhopal R, Khatoon J, Lederle N, Jackson A:A Health promotion and
prevention interventions in Pakistani, Chines and Indian communiities related to CVD and Cancer, review of the published evidence in the UK, other parts of Europe and the United States.: A report commisioned by the NHS Health Scotland; 2008 [http://www.healthscotland.com/uploads/documents/8886-HealthPromotionAndPreventionInterventions20080801.pdf].
38. Davey GJG, Roberts JD, Patel S, Pierpoint T, Godsland IF, Davies B, Mckeigue PM:Effects of exercise on insulin resistance in South Asians and Europeans.Journal of Exercise Physiology2000,3.
39. Andersen E, Høstmark AT, Anderssen SA:Intervention effects on physical activity and insulin levels in Pakistani immigrant men living in Oslo: a randomised controlled trial.Diabetes Res Clin Pract2011, In press. 40. John D, Tyo B, Bassett DR:Comparison of four ActiGraph accelerometers
during walking and running.Med Sci Sports Exerc2010,42:368–374. 41. Matthews CE, Chen KY, Freedson PS, Buchowski MS, Beech BM, Pate RR,et
al:Amount of time spent in sedentary behaviors in the United States, 2003–2004.Am J Epidemiol2008,167:875–881.
42. Ekelund U, Brage S, Griffin SJ, Wareham NJ:Objectively measured moderate- and vigorous-intensity physical activity but not sedentary time predicts insulin resistance in high-risk individuals.Diabetes Care 2009,32:1081–1086.
43. Freedson PS, Melanson E, Sirard J:Calibration of the Computer Science and Applications, Inc. accelerometer.Med Sci Sports Exerc1998,30:777–781. 44. Troiano RP, Berrigan D, Dodd KW, Masse LC, Tilert T, McDowell M:Physical
activity in the United States measured by accelerometer.Med Sci Sports Exerc2008,40:181–188.
45. Trost SG, McIver KL, Pate RR:Conducting accelerometer-based activity assessments in field-based research.Med Sci Sports Exerc2005,37:S531–S543. 46. Van Sluijs EM, Van Poppel MN, Twisk JW, Brug J, Van MW:The positive
effect on determinants of physical activity of a tailored, general practice-based physical activity intervention.Health Educ Res2005,20:345–356. 47. Sallis JF, Grossman RM, Pinski RB, Patterson TL, Nader PR:The development
of scales to measure social support for diet and exercise behaviors.Prev Med1987,16:825–836.
48. Fuchs R, Schwarzer R:Selbstwirksamheit zur sportlichen aktivitat: reliabilitat und validitat eines neuen mefinstruments - Self-efficacy towards physical exercise: reliability and validity of a new instrument. Zeitschrift fur Differentielle und Diagnostische Psychologie1994,15:141–154. 49. Baron RM, Kenny DA:The moderator-mediator variable distinction in
social psychological research: conceptual, strategic, and statistical considerations.J Pers Soc Psychol1986,51:1173–1182.
50. Matthews DR, Hosker JP, Rudenski AS, Naylor BA, Treacher DF, Turner RC: Homeostasis model assessment: insulin resistance and beta-cell function from fasting plasma glucose and insulin concentrations in man. Diabetologia1985,28:412–419.
51. Andersen E, Høstmark AT, Lorentzen C, Anderssen SA, Eds:Low level of objectively measured physical activity and cardiorespiratory fitness, and high prevalence of metabolic syndrome among Pakistani male immigrants in Oslo, Norway.Norwegian Journal of Epidemiology2011, 20:199–208.
52. Taylor WC, Baranowski T, Young DR:Physical activity interventions in low-income, ethnic minority, and populations with disability.Am J Prev Med 1998,15:334–343.
53. Yancey AK, Ory MG, Davis SM:Dissemination of physical activity promotion interventions in underserved populations.Am J Prev Med2006, 31:S82–S91.
54. Hollis S, Campbell F:What is meant by intention to treat analysis? Survey of published randomised controlled trials.BMJ1999,319:670–674. 55. Maher CG, Sherrington C, Herbert RD, Moseley AM, Elkins M:Reliability of
the PEDro scale for rating quality of randomized controlled trials.Phys Ther2003,83:713–721.
56. Plasqui G, Westerterp KR:Physical activity assessment with
accelerometers: an evaluation against doubly labeled water.Obesity (Silver Spring)2007,15:2371–2379.
57. Brage S, Wedderkopp N, Franks PW, Andersen LB, Froberg K:Reexamination of validity and reliability of the CSA monitor in walking and running.Med Sci Sports Exerc2003,35:1447–1454.
doi:10.1186/1479-5868-9-47
Cite this article as:Andersenet al.:Physical activity levels six months after a randomised controlled physical activity intervention for Pakistani immigrant men living
in Norway.International Journal of Behavioral Nutrition and Physical Activity 20129:47.
Submit your next manuscript to BioMed Central and take full advantage of:
• Convenient online submission
• Thorough peer review
• No space constraints or color figure charges
• Immediate publication on acceptance
• Inclusion in PubMed, CAS, Scopus and Google Scholar
• Research which is freely available for redistribution