Research Article ISSN: 2319-507X Radke DP, IJPRET, 2013; Volume 1(8):339-348 IJPRET
Available Online At www.ijpret.com
INTERNATIONAL JOURNAL OF PURE AND
APPLIED RESEARCH IN ENGINEERING AND
TECHNOLOGY
A PATH FOR HORIZING YOUR INNOVATIVE WORKPERFORMANCE EVALUATION OF CLUSTER BASED WIRELESS SENSOR NETWORK
USING M/G/1 QUEUING MODEL
D. P. RADKE, C. R. POTE
Department of Computer Technology, Priyadarshini College of Engineering, Rashtrasant Tukadoji Maharaj Nagpur University, Nagpur, Maharashtra, India
Accepted Date:
27/02/2013
Publish Date:
01/04/2013
Keywords
WSN,
Queuing theory,
M/G/1 Queuing model.
Corresponding Author
Mr. D. P. Radke
Abstract
Available Online At www.ijpret.com 1. INTRODUCTION
A wireless sensor network (WSN) is
envisioned as a cluster of tiny power
constrained devices with functions of
sensing and communications. Sensors
closer to a sink node have a larger
forwarding traffic burden and consume
more energy than nodes further away from
the sink An important issue in wireless
sensor networks is the limited availability of
energy and hence optimizing energy is very
important. In any sensor node, most of the
energy is consumed during packet
transmission. We propose a new scheme to
reduce the energy consumption of nodes
during packet transmission based on queue
threshold by taking channel contention into
account. For that we propose an analytical
model of a cluster based sensor network
using M/G/1 queuing model and analyze
the performance of the proposed scheme in
terms of performance parameters such as
average energy consumption and mean
delay. We will also derive the expression for
the optimal value of threshold. . For that
develop an analytical model of a cluster
based sensor network using M/G/1 queuing
model.An analytical model that specifically
represents the cluster head’s behavior in
IDLE state and BUSY state during it’s period
of active time. M/G/1 queuing model is
proposed to investigate network
performance in term of mean delay and
average energy consumption. M/G/1
queuing model is applied to Heterogeneous
and Homogeneous cluster based sensor
network and analysis the comparative
result of both. Queuing theory is the
mathematical study of waiting line, using
models to show results, and show
opportunities, within arrival, service and
departure process. In queuing theory, a
queuing model is used to approximate a
real queuing situation or system, so the
queuing behaviour can be analysed
mathematically.
1.1 Why Queuing Analysis?
An analytical model, which is one that can
be expressed as a set of equations that can
be solved to yield the design parameter like,
response time throughput etc…
For computer, operating system, and
networking problem and for many practical
real world problems, analytical model based
on queuing theory provide a reasonably
Research Article ISSN: 2319-507X Radke DP, IJPRET, 2013; Volume 1(8):339-348 IJPRET
Available Online At www.ijpret.com
Queuing analysis can literally be
accomplished in matter of minutes for a
well define problem.
2. LITERATURE REVIEW
The unique characteristics of WSNs such as
limited bandwidth, computing capacity,
data delivery delay and severe energy
constraints make their design more
challenging. A critical issue in wireless
sensor networks is represented by the
limited availability of energy within the
network and hence optimizing energy is
very important.
ZhiQuan et al. explained [4] the two
major techniques for maximizing the
sensor network lifetime: the use of energy
efficient routing and the introduction of
sleep/active modes for sensors. One
simple method proposed to prolong the
lifetime of sensor networks is the
introduction of active and sleep modes for
sensor nodes.
J. Carle et al. presented [5] a good
survey on energy efficient area
Performance Analysis of Cluster Based
Sensor Networks using N-Policy M/G/1
Queueing Model 178 monitoring for sensor
networks. The authors have observed that
the best method for conserving energy is
to turn off as many sensors as possible,
while still keeping the system functioning.
C.F. Chiasserini and M. Garetto
presented [2] an analytical model to
analyze the system performance in terms
of network capacity, energy consumption
and mean delay, against the sensor
dynamics in on/off modes and found there
exists trade-offs between energy
consumption and mean delay.
Most existing work on sensor
networks consider homogeneous sensor
networks where all sensor nodes are
assumed to have the same capabilities in
communications, computation, memory
storage, energy supply, reliability and
other aspects. To avoid more delay in the
data delivery that happens through
multi-hop communication, clusters are formed in
the sensor network and a cluster head is
selected for each cluster. Here, all nodes in
a cluster can communicate with the cluster
head directly but the energy consumed
and the time involved while selecting the
cluster head is more. Heterogeneous
Sensor Networks (HSNs) consists of two
Available Online At www.ijpret.com
and several recent papers have studied
about HSNs and these literatures showed
that HSNs can significantly improve sensor
network performance.
3. SYSTEM MODEL
Fig.1. Queuing system structure and
parameters for single-server Queue
In these models, three various sub
processes may be distinguished:
• Arrival Process: includes number of
customers arriving, several types of
customers, and one type of customers’
demand, deterministic or stochastic
arrival distance, and arrival intensity. The
process goes from event to event, i.e. the
event “customer arrives” puts the
customer in a queue, and at the same
time schedules the event “next customer
arrives” at some time in the future.
Available Online At www.ijpret.com
and several recent papers have studied
about HSNs and these literatures showed
an significantly improve sensor
Fig.1. Queuing system structure and
server Queue
In these models, three various
sub-processes may be distinguished:
includes number of
customers arriving, several types of
customers, and one type of customers’
demand, deterministic or stochastic
arrival distance, and arrival intensity. The
process goes from event to event, i.e. the
event “customer arrives” puts the
tomer in a queue, and at the same
time schedules the event “next customer
arrives” at some time in the future.
• Waiting Process:
queues, servers’ discipline (First In First
Out). This includes the event “start
serving next customer from q
which takes this customer from the
queue into the server, and at the same
time schedules the event “customer
served” at some time in the future.
• Server Process: includes a type of a server, serving rate and serving time.
This includes the event “cust
served” which prompts the next event
“start serving next customer from
queue”.
Queuing model can be represented using
Kendall’s notation.
The notation is X/ Y/ N where
X – Inter-arrival time distribution
Y – Service time distribution
N – Number of
Some standard notation for
distributions (X and Y) are :
M – Markovian (Possion, exponential)
distribution
D – Degenerate (Deterministic)
distribution (Constant)
G – General Distribution (Arbitrary)
PH – A phase type distribution
includes length of
queues, servers’ discipline (First In First
Out). This includes the event “start
serving next customer from queue”
which takes this customer from the
queue into the server, and at the same
time schedules the event “customer
served” at some time in the future.
includes a type of a
server, serving rate and serving time.
This includes the event “customer
served” which prompts the next event
“start serving next customer from
Queuing model can be represented using
The notation is X/ Y/ N where
arrival time distribution
Service time distribution
Number of servers
Some standard notation for
distributions (X and Y) are :
Markovian (Possion, exponential)
distribution
Degenerate (Deterministic)
distribution (Constant)
General Distribution (Arbitrary)
Research Article ISSN: 2319-507X Radke DP, IJPRET, 2013; Volume 1(8):339-348 IJPRET
Available Online At www.ijpret.com
The fundamental task of Queuing Model is
as follows: Given the following information
as a input,
• Arrival Rate
• Service time
• Number of Server
Provide as output information concerning:
• Item Waiting
• Waiting Time
• Items Queued
• Residence Time
3.1 M/G/1 Queuing Model
• M/G/1 (X/Y/N)
• Arrival distribution: Poisson rate (l) M tells the use of exponential
probability
• Service distribution: G signifies
general distribution time
• Number of server: N = 1 represent the number of server
M/G/1 queuing model is applied to
Heterogeneous and Homogeneous cluster
based sensor network.
In HSN model that consists of two physically
different types of sensor nodes. A small
number of powerful high-end sensors
(H-sensors) and a large number of low-end
sensors (L-sensors) uniformly distributed in
the field.
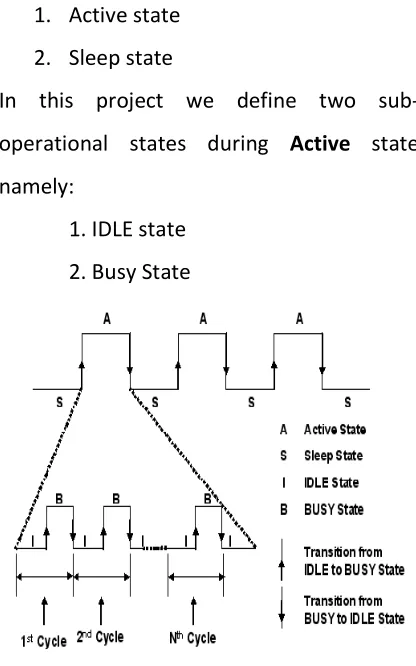
Two major states of HSN are:
1. Active state
2. Sleep state
In this project we define two
sub-operational states during Active state
namely:
1. IDLE state
2. Busy State
Fig. 2. Sub-operational states of H-sensor
node during active state.
All the H-sensors in all clusters during its
period of active time will be in IDLE state or
BUSY state. Here, an H-sensor node in a
cluster, during its period of active time,
remains in IDLE state, switches to BUSY
state when the node’s buffer is filled at
Available Online At www.ijpret.com
i.e., queue threshold and the node switches
back from BUSY state to IDLE state when
there are no packets in the buffer. The
average energy consumption of an H
node or CH depends on the queue
threshold since most of the energy is
consumed during transmission i.e., during
BUSY state. We also determine optimal
threshold value for which the H
nodes consume very less energy. Since the
focus of this work is to minimize the energy
consumption of individual H
in different clusters during its period of
active time based on queue threshold, we
analyse the behaviour of a single H
node.
Performance Analysis of Cluster Based
Sensor Networks using
N-Queuing Model
The following assumptions are made for
analysis:
• All L-sensor nodes in a HSN are identical
• All H-sensor nodes in a HSN are identical
• The arrival of data packets to H
nodes is assumed to follow a Poisson
process withmean arrival rate per CH (λ)
• Packets are of fixed size
Available Online At www.ijpret.com
i.e., queue threshold and the node switches
back from BUSY state to IDLE state when
there are no packets in the buffer. The
average energy consumption of an H-sensor
node or CH depends on the queue
nce most of the energy is
consumed during transmission i.e., during
BUSY state. We also determine optimal
threshold value for which the H-sensor
nodes consume very less energy. Since the
focus of this work is to minimize the energy
ual H-sensor nodes
in different clusters during its period of
active time based on queue threshold, we
analyse the behaviour of a single H-sensor
Performance Analysis of Cluster Based
-Policy M/G/1
assumptions are made for
sensor nodes in a HSN are identical
sensor nodes in a HSN are identical
• The arrival of data packets to H-sensor
nodes is assumed to follow a Poisson
process withmean arrival rate per CH (λ)
• Packets are delivered from H
to BS with mean service time (1/
• Channel access time follows general
distribution with mean 1/
• Buffer is assumed to be empty whenever
the H-sensor node switches from sleep to
active state
Fig. 3. Two-state transition diagram of an L
sensor in idle state and busy state
All the H-sensors in all clusters during its
period of active time will be in IDLE state or
BUSY state. Here, an H
cluster, during its period of active time,
remains in IDLE state, switches to BUSY
state when the node’s buffer is filled at
least with threshold number of packets (
i.e., queue threshold and the node switches
back from BUSY state to IDLE state when
there are nopackets in the buffer. The two
state transition diagram of an H
node in IDLE state and BUSY state is shown • Packets are delivered from H-sensor node
to BS with mean service time (1/μ)
• Channel access time follows general
distribution with mean 1/
• Buffer is assumed to be empty whenever
sensor node switches from sleep to
state transition diagram of an
L-sensor in idle state and busy state
sensors in all clusters during its
period of active time will be in IDLE state or
BUSY state. Here, an H-sensor node in a
cluster, during its period of active time,
mains in IDLE state, switches to BUSY
state when the node’s buffer is filled at
least with threshold number of packets (N)
i.e., queue threshold and the node switches
back from BUSY state to IDLE state when
there are nopackets in the buffer. The
two-transition diagram of an H-sensor
Research Article ISSN: 2319-507X Radke DP, IJPRET, 2013; Volume 1(8):339-348 IJPRET
Available Online At www.ijpret.com
in figure 3. During BUSY state, the H-sensors
deliver the packets to the BS. Such
switching actions between IDLE state to
BUSY state and BUSY state to IDLE state are
referred to as transitions.
The average energy consumption of an
H-sensor node or CH depends on the queue
thresholdsince most of the energy is
consumed during transmission i.e., during
BUSY state. We also determine optimal
threshold value (N*) of N for which the
H-sensor nodes consume very less energy.
Since the focus of this work is to minimize
the energy consumption of individual
H-sensor nodes in different clusters during its
period of active time based on queue
threshold, we analyses the behavior of a
single H-sensor node.
4. PERFORMANCE ANALYSIS
In this section, we analyze the behavior of a
single H-sensor node. As mentioned in
section II, thearrival of data packets to
H-sensors follows a Poisson process with
mean arrival rate per node (λ) and an
H-sensor in a cluster during its period of active
time, remains in IDLE state and switches to
BUSY state when the H-sensor node’s buffer
is filled at least with threshold number of
packets (N) and switches back from BUSY
state to IDLE state when there are no
packets in the node’s buffer. Weanalyze the
performance of the system in terms of the
following parameters.
(a) Mean Delay :
Mean delay experienced by the packets in
an H-sensor node is defined as the average
waiting time of the packets in the queue.
Based on M/G/1 queuing model, the mean
number of packets in the queue (L) is
determined as,
(b) Average Energy Consumption of an
H-Sensor Node :
During active time, the H-sensor node
remains in IDLE state when the number of
packets is less than the queue threshold.
When the threshold value is reached due
to the arrival of packets, the H-sensor node
waits for the free channel for a mean
Available Online At www.ijpret.com
channel is available, the node switches
from IDLE state to BUSY state and
transmits a preamble packet (271 bytes).
Preamble packet is used for
synchronization of an H-sensor node with
the BS for the packet transmission [14].
After synchronization with the BS, the
H-sensor node transmits all packets (each
packet is of 36 bytes long) to BS from its
buffer and switches back from BUSY state
to IDLE state when the buffer gets empty.
Hence a cycle during the active time of an
H-sensor node constitutes,
• Arrival of data packets
• Duration of time spent for channel
access
Transition from IDLE state to BUSY state
• Synchronization with the BS
• Transmission of packets to BS
• Transition from BUSY state to IDLE
state
The H-sensor node, during its period of
active time undergoes many such cycles
depending upon the value of N. To
determine the average energy consumption
of an H-sensor node during its period of
active time, we consider the following
parameters that are associated with the
energyconsumption of an H-sensor node
during transmission:
CH Energy consumption due to transmission
of a packet from CH to BS in joules
CT Energy consumption due to transitions
and synchronization in joules
E(N) Average energy consumption of an
H-sensor node as a function of N in joules
E[I] Average duration of time the H-sensor
node is in IDLE state
E[C] Average duration of cycle
NcyNumber of cycles per unit time
The value of queue threshold has significant
effect on the average number of cycles or
number of cycles per unit time (Ncy). The
Ncyincludes arrival of data packets, time
spent on channel access, transitions,
synchronization and transmission of
packets. Since the focus of this paper is to
reduce the average energy consumption
during transmission based on queue
threshold, the parameters that consumes
energy during BUSY state are alone
considered i.e., CT energy consumed due to
transitions and synchronization and CH
energy consumed during transmission. The
energy consumed during sleep state, the
Research Article ISSN: 2319-507X Radke DP, IJPRET, 2013; Volume 1(8):339-348 IJPRET
Available Online At www.ijpret.com
receive mode, the energy consumed during
data generation and channel access time in
active state are not considered.
The average energy consumption of an
H-sensor node E(N) is obtained and it is given
by :
(c) Optimal Threshold value (N*) of N:
The optimal threshold value (N*) the value
of N for which the sensor node consumes
minimum energy and it is given as :
5. CONCLUSION
In this work, we have proposed a new
energy minimization scheme by which the
average energy consumption of nodes that
acts as cluster head in the sensor network is
reduced based on queue threshold during
its period of active time. We have
developed an analytical model of a cluster
based sensor network by taking channel
contention into account using M/G/1
queuing model and the system
performance in terms of average energy
consumption and mean delay have been
determined.
REFERENCES
1. R. Jayaparvathy and R. Maheswar,
“Power Control Algorithm for Wireless
Sensor Networks using N-Policy M/M/1
Queueing Model”, IJCSE Vol. 02, No. 07,
August 2010, pp. 2378
2. C. F. Chiasserini and M. Garetto, “An
analytical model for wireless sensor
networks with sleeping nodes,” IEEE Trans.
Mobile Computing, vol. 5, no. 12, Dec.
2006, pp. 1706–1718.
3. R. Jayaparvathy and R. Maheswar,
“Power Optimization Method for
Heterogeneous Sensor Network with Finite
Buffer Capacity”, IJRTET, Vol. 3, No. 3, May
2010, pp. 218-220.-2382.
4. ZhiQuan, Ananth Subramanian and Ali H.
Sayed, “REACA: An Efficient Protocol
architecture for Large Scale Sensor
Networks,” IEEE Transactions on Wireless
Communications, vol. 6, no.10, October
2007, pp. 3846-3855.
5. J. Carle and D. Simplot-Ryl,
“Energy-efficient area monitoring for sensor
networks,” IEEE Computer, vol. 37, no. 2,
Available Online At www.ijpret.com
6. E. Duarte-Melo and M. Liu, “Analysis of
energy consumption and lifetime of
heterogeneous wireless sensor networks”
in Proc. IEEE Globecom, Nov. 2002,