Address for correspondence
Sarojamma. M*,
Balaji College of Pharmacy,Ananthapuram,
Andhra Pradesh, Mob: 9581884379 E-mail: [email protected]
Sarojamma . M et al. / JGTPS / 6(2)-(2015) 2546 – 2551
RP-HPLC ASSAY METHOD DEVELOPMENT AND VALIDATION FOR
SIMULTANEOUS ESTIMATION OF GABAPENTIN AND METHYLCOBALAMIN IN
TABLET DOSAGE FORMS
INTRODUCTION:
Gabapentin (Figure 1) is 2-[1-(amino methyl) cyclohexyl] acetic acid1. It is an anticonvulsant drug
for neuropathic pain and adjunct for seizures. It can be used in generalized anxiety disorders. Methylcobalamin (Figure 2) is (carbanide; cobalt; [5-5, 6-dimethyl benzimidazol-1- yl)-4-hydroxy-2-(hydroxymethyl) oxolan-3-yl] 1-[3- [2,13,18-tris (2-amino-2- oxoethyl)- 7,12,17- tris(amino- 3-oxopropyl)-3, 5, 8, 8, 13, 15, 18, 19- octamethy-2, 7, 12, 17 tetra hydrocorrin-3-yl] propanoyl amino] propan-2-yl hydrogen phosphate2. It is a form of
Vit-B12.It is a water soluble vitamin with a key role in the normal functioning of brain, and nervous system. It has been shown to protect those who take it from neurological conditions and ageing in a way that it makes different from other drugs or therapies3.
Figure 1: Chemical Structure of Gabapentin
Figure 2: Chemical Structure of Methylcobalamin
Literature survey revealed HPTLC3, UV4-5, HPLC6-9
methods for the estimation of Gabapentin and Methylcobalamin. The present study aims to develop simple, accurate, precise and selective RP-HPLC assay procedure for the analysis of A simple, selective, linear, precise, and accurate RP-HPLC method was developed and validated for the simultaneous estimation of Gabapentin & Methylcobalamin from bulk and formulation. Chromatographic separation was achieved isocratically on a Waters C18 column (250x4.6, 5µ particle size) using a
mobile phase Orthophosphoric acid: methanol in the ratio of 50:50 v/v. The flow rate was 0.8 ml/min and effluent was detected at 275 nm and 10µl of sample was injected. Rt of Gabapentin & Methylcobalamin was found to be 2.9 and 4.4 min respectively. Linearity of the method was in the concentration range of 50-150 % for Gabapentin & Methylcobalamin. Percent recoveries obtained for both the drugs were 100.00%. The percentage RSD for precision of the method was found to be less than 2%. The method was validated according to the ICH guidelines. The method developed was successfully applied for the analysis of simultaneous estimation of Gabapentin & Mecobalamine tablets.
Keywords: Gabapentin, Methylcobalamin, Methanol, orthophosphoric acid.
ABSTRACT
Sarojamma.M*,
Sathya Sowmya. P,
Abdul Ahad. H
Balaji College of Pharmacy,
Ananthapuram, A.P, India
Journal of Global Trends in Pharmaceutical Sciences
Journal home page: www.jgtps.com
ISSN: 2230-7346
Gabapentin and Methylcobalamin in bulk drug samples and in combined dosage. The method is optimized and validated as per the International conference on Harmonization (ICH) guidelines10.
Materials and Methods:
Quantitative HPLC was performed on Agilent 1220 infinity HPLC system connected with PDA Detector 2998 and Empower-2 Software. Analytical column was Agilent Zorbin C18 (250 X 4.6 mm, 5μ) Column. Pharmaceutical grade Gabapentin and Methylcobalamin were kindly supplied as a gift sample by Newland Laboratories, Hyderabad, and Andhra Pradesh, India. Methanol was of HPLC grade and Purchased from Merck, Darmstadt, Germany. Ortho phosphoric acid and orthophosphoric acid was analytical reagent grade supplied by Fischer Scientific Chemicals. Water HPLC grade was obtained from a Milli-Q-RO water
purification system. Gabapentin and
methylcobalamin Tablets (Nurokind G, gabapentin
(300 mg), methylcobalamin (500mg) Make:
Mankind Parma, New Delhi, India) was purchased from the local market.
Preparation of Ortho phosphoric acid buffer: Accurately weighed 6.8 gms of potassium dihydrogen Ortho-phosphate in a 1000 ml standard flask and dissolved in minimum quantity milli-Q water and finally the volume was made upto the mark with the same. pH was adjusted to 2.2 with 0.1 N HCl.
Preparation of mobile phase:
600 ml of above buffer solution was transferred into a 1000 ml volumetric flask, to this 400ml of methanol was added, shaken well, filtered and degassed.
Preparation of standard solutions:
Accurately weighed 600 mg of gabapentin and 1mg of methylcobalamin were dissolved in mobile phase and sonicated for 10 min room temperature, later the volume made upto 50 ml in volumetric flasks. For simultaneous quantitative studies of both drugs, a series of standard working solutions containing both the drugs were prepared by an appropriate dilution of a mixture of stock solutions. Preparation of sample solution:
A powder equivalent to 809 mg was accurately weighed, transferred into a 50 ml volumetric flask containing mobile phase. The above mixture was sonicated for about 10 min for complete mixing. This solution was filtered through Whatman No.1 filter paper. From the filtrate different aliquots were taken in separate 10 ml volumetric flasks and diluted with mobile phase up to the mark so as to get a concentration ranging from 50-150 μg/ml each of gabapentin and mecobalamin. Each of these solutions (10 μl) was then injected three times into the column. The mean peak areas of each drug were calculated and the drug contents in the tablets were
Method validation
The proposed method was validated as per ICH guidelines11.
Specificity (Forced decomposition studies) Specificity is the ability of the method to measure the analyte response in the presence of its excipients. The specificity of the developed LC method for gabapentin and Methylcobalamin was carried out in the presence of its degradants. Stress studies were performed for on tablets to provide an indication of the stability-indicating property and specificity of the proposed method. Intentional degradation was attempted with a stress condition of UV light (254 nm), acid (0.5N HCl), base (0.5N NaOH) and oxidation (3.0% H2O2) to evaluate the
ability of the proposed method to separate analytes from its degradation product. For light studies, study period was 10 days whereas for hydrolytic, acid, base and oxidation, it was 24 h. Peak purity test was carried out for the gabapentin and Methylcobalamin peak by using PDA detector in stress samples. Precision
The precision of the method verified by repeatability and by intermediate precision. Repeatability was checked by injecting six individual preparations of gabapentin and Methylcobalamin real sample (tablets). The intermediate precision of the method was also evaluated using different analyst and performing the analysis on different days. Precision of assay method was evaluated by carrying out six independent assays of real sample of gabapentin and Methylcobalamin at 100 μg/ml level against qualified reference standard. The intermediate precision of the assay method was evaluated by different analysts by making use of different columns and different lot of the sample.
Linearity
Linearity test solutions for the assay method were prepared from gabapentin and Methylcobalamin stock solution at six concentration levels from 50 to 150% of assay analyte concentration (50, 75, 100, 125 and 150 μg/ml). The peak area versus concentration data was treated by least-squares linear regression analysis. Linearity test solutions for the method were prepared by diluting stock solution to the required concentrations.
Accuracy
Accuracy of the assay method was evaluated in triplicate using three concentration levels 50, 100 and 150μg/ml on real sample (tablets). Standard addition and recovery experiments were conducted on real sample to determine accuracy the method. Study was carried out in triplicate using three (50, 100 and 150%) concentration levels. The percentages of recoveries
for gabapentin and Methylcobalamin were
Robustness
To determine the robustness of the developed method, experimental conditions were deliberately altered and the system suitability parameters were evaluated. Tailing factor for gabapentin and Methylcobalamin was recorded. The flow rate of the mobile phase was 0.8 ml/min, to study the effect of flow rate on the retention time, flow was changed by ± 0.2 units from 0.6 to 1.0 ml/min. The effect of the column temperature on retention time was studied at 25 and 35 ºC.
RESULTS AND DISCUSSION:
The absorption wavelength for Gabapentin and Methylcobalamin is determined after several trials. The absorbance spectra of the diluted standard and working solutions of Gabapentin and Methylcobalamin in methanol are recorded on a UV spectrophotometer. They are scanned in the wavelength 200 nm - 400 nm range using quartz cuvettes with 10 mm path length. The maximum absorption wavelength was observed at 275 nm for
the two drugs. This is in good agreement with the reported wavelengths for these drugs combination. Specificity (Forced decomposition studies)
Gabapentin and Methylcobalamin was found to degrade significantly in acid hydrolysis and in base hydrolysis and mild degradation was observed in UV and peroxide stress conditions.
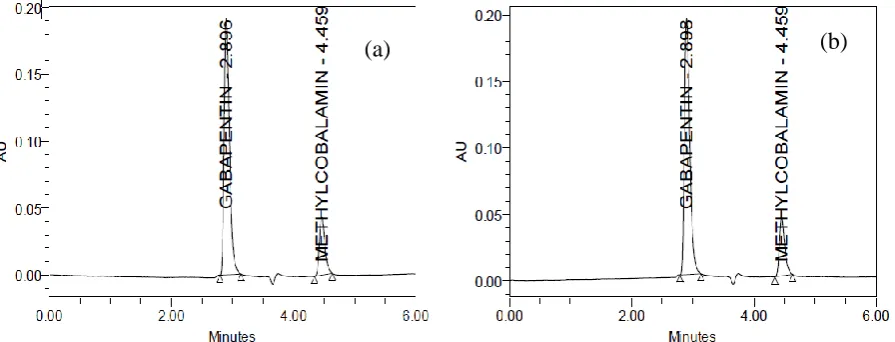
Figure 3a, 3b shows the representative
chromatogram of standard and sample gabapentin and Methylcobalamin respectively. Photodiode array detector was employed to check and ensure the homogeneity and purity of gabapentin and Methylcobalamin peak in all the stressed sample solutions. Assay studies were carried out for stress samples against gabapentin and Methylcobalamin qualified working standard. The results are presented in Table 1. The purity and assay of gabapentin and Methylcobalamin was unaffected by the presence of its degradation products and thus confirms the stability-indicating power of the developed method.
Figure 3. Representative chromatograms of a) Standards of Gabapentin and mecobalamin b) Tablet sample of Gabapentin and mecobalamin
Table 1: Data of Forced decomposition studies
Parameter Area of
Gabapentin
% Assay of Gabapentin
% Degradation of Gabapentin
Area of mecobalamin
%Assay of mecobalamin
% Degradation of mecobalamin
Acid 2917192 67 -32 3109695 70 -30
Base 2648221 61 -38 3231239 73 -27
Peroxide 2527496 58 -41 3227403 73 -27
Sunlight 2970691 68 -31 4110524 93 -7
Heat 3968873 91 -8 4125196 93 -7
Precision
The % RSD during the method precision study of Gabapentin was 0.14 and 0.06% for retention time and Peak area respectively and 0.16 % and 0.34 % for retention time and Peak area of Methylcobalamin
respectively. The % RSD for the area of Gabapentin and Methylcobalamin were well within 2 %, conforming good precision of the method. The % RSD values are presented in Table 2.
Table 2: Precision data
S.no Gabapentin Mecobalamin RT Area RT Area
injection1 2.902 577331 4.466 135567
injection2 2.912 577845 4.478 135737
injection3 2.905 576963 4.475 135338
injection4 2.908 577681 4.468 136090
injection5 2.902 578037 4.466 136098
Injection6 2.902 577669 4.467 134898
Mean 2.905 577587.667 4.470 135621.333
Std. Dev. 0.004 384.586 0.005 461.883
% RSD 0.142 0.067 0.116 0.341
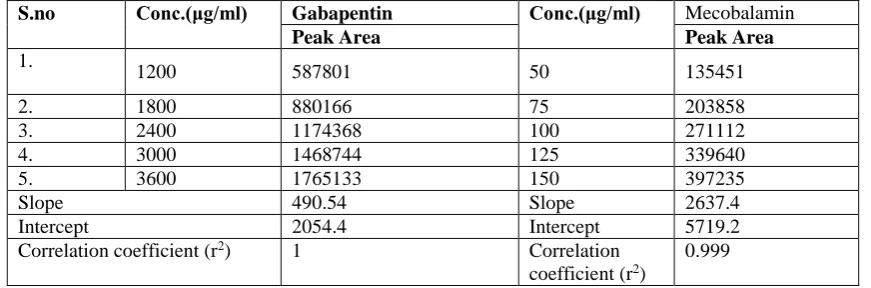
Linearity
Linear calibration plot for above method was obtained over the calibration range 50 μg/ml to 150 μg/ml. The results show that an excellent
correlation existed between the peak area and concentration of the analyte.
Table 3: Linearity data
S.no Conc.(μg/ml) Gabapentin Conc.(μg/ml) Mecobalamin Peak Area Peak Area 1.
1200 587801 50 135451
2. 1800 880166 75 203858
3. 2400 1174368 100 271112
4. 3000 1468744 125 339640
5. 3600 1765133 150 397235
Slope 490.54 Slope 2637.4
Intercept 2054.4 Intercept 5719.2
Correlation coefficient (r2) 1 Correlation
coefficient (r2)
0.999
Accuracy
Accuracy was determined by analyzing a sample of known concentration (reference standard solutions) and comparing the measured value with the true value, and using the method of standard
additions. A table 3 summarizes the accuracy results, expressed as percent recovery. The method showed good recovery.
Table 3: Results of Accuracy S.
No Analyte
Accuracy Level
Sample weight
Amount added (μg/ml)
Amount
Found (μg/ml) % Recovery % Mean 1
Gabapentin
50% 404.60 237.840 237.87 100
100
2 100 % 809.00 475.562 476.38 100
3 150% 1213.60 713.402 712.90 100
4
Mecobalamin
50% 50 0.399 0.40 100
100
5 100 % 100 0.797 0.80 100
6 150% 150 1.196 1.20 100
Robustness
The robustness of an analytical procedure is a measure of its capacity to remain unaffected by small, but deliberate, variations in method parameters, and provides an indication of its reliability during normal usage. In order to perform the robustness study of the proposed method deliberate modifications in flow rate and column temperature were made. The results are shown in Table 4. It can be seen that every employed
Table 4: Results of Robustness
Parameter
Gabapentin Mecobalamin RT Theoretical
plates Asymmetry RT
Theoretical
plates Asymmetry Decreased flow
rate(0.8ml/min) 4.077 1664871 1.2 6.288 13848 1.1
Increased flow
rate(1.2ml/min) 2.260 1667389 0.9 3.490 12780 1.0
Decreased
temperature(250c) 4.001 1667845 0.8 6.278 11932 1.0
Increased
temperature(350c) 4.084 1669852 0.9 6.282 11110 0.9
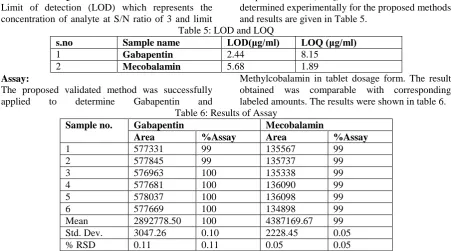
Detection and Quantification Limit:
Limit of detection (LOD) which represents the concentration of analyte at S/N ratio of 3 and limit
of quantification (LOQ) at which S/N is 10 were determined experimentally for the proposed methods and results are given in Table 5.
Table 5: LOD and LOQ
s.no Sample name LOD(μg/ml) LOQ (μg/ml) 1 Gabapentin 2.44 8.15
2 Mecobalamin 5.68 1.89 Assay:
The proposed validated method was successfully
applied to determine Gabapentin and
Methylcobalamin in tablet dosage form. The result obtained was comparable with corresponding labeled amounts. The results were shown in table 6. Table 6: Results of Assay
Sample no. Gabapentin Mecobalamin
Area %Assay Area %Assay
1 577331 99 135567 99
2 577845 99 135737 99
3 576963 100 135338 99
4 577681 100 136090 99
5 578037 100 136098 99
6 577669 100 134898 99
Mean 2892778.50 100 4387169.67 99
Std. Dev. 3047.26 0.10 2228.45 0.05
% RSD 0.11 0.11 0.05 0.05
CONCLUSION:
The wide linearity range, Accuracy, Short retention times, & Simple Mobile phase imply that the proposed method can be successfully employed for routine quantification of Gabapentin and Methylcobalamin in combined dosage form. The method is economic too as the cost of mobile phase used is less compared to costly solvents that has to be used like acetonitrile for the quantification of Gabapentin and Mecobalamin. Also the forced degradation studies imply that this method is Stability Indicating Method development & validated according to ICH guidelines, one can adopt in an industry confidently for routine analysis.
REFERENCES:
1. Stephen V. Sobel (5 November 2012).
Successful Psychopharmacology:
Evidence-Based Treatment Solutions for Achieving Remission. W. W. Norton. p. 124. ISBN 978-0-39370857-8.
2. The Merck Index, an encyclopedia of chemicals, drugs and biological. Fourteenth Edn USA; 2006.
3. Baheti KG and Galande VR. Validated Simultaneous Estimation of Gabapentin in the Presence of Methylcobalamin in Tablet by HPTLC Method; International Journal of Research in Pharmaceutical and Biomedical Sciences, 2(3), 2011, 1199-1202.
4. Sharma MC, Sharma S, Sharma AD.
Simultaneous Estimation and Validation of Gabapentin and Methylcobalamin in Tablet Dosage form: hydrotropic approach; Drug Invention Today, 3, 2011, 95-97.
5. Varsha RG, Baheti KG, Dehghan MH.
UV-Vis Spectrophotometric method For
Estimation of Gabapentin and
6. Syed SQ, Mohammed MAS, Ehab YA, Mohammed A, Abudhabi. Validation of an Isocratic HPLC Assay of Gabapentin in Pharmaceutical formulations and Stress test for Stability of Drug Substance. Scholars Research Library, 3(4), 2011, 342- 350. 7. Saravanan J, Shajan A, Joshi NH,
Varatharajan R and Valliappan K. A Simple and validated RP-HPLC method for the estimation of methylcobalamin in bulk and capsule dosage form. International Journal of Chemical and Pharmaceutical Sciences, 2010, 1(2), 13-16.
8. Bhatt KK, Emanual MP and Aswin M. Simultaneous Estimation of Pregabalin and
Methylcobalamin in. Pharmaceutical
Formulation by RP-HPLC Method. J Anal Bioanal Techniques, 4, 2013, 159.
9. Phyllis A. Balch, Prescription for Nutritional Healing, 4th ed., penguin groups, New York, 2006.
10. ICH topic Q2 (R1). Validation of analytical
procedures: text and methodology
International Conference on
Harmonization, Geneva, 4, 2005, 1-1. 11. ICH guidelines. ICH Harmonized Tripartite
Guideline Q2 (R1), Validation of analytical procedures: text and methodology, Current Step 4 Version, 2005.