3614
DEVELOPMENT AND VALIDATION OF UV SPECTROPHOTOMETERIC
METHOD FOR SIMULTANEOUS ESTIMATION OF EMITRICITABINE AND
TENOFOVIR DISPROXIL FUMARATE IN BULK AND TABLET FORMULATION
BY SIMULTANEOUS EQUATION METHOD.
Madhavi shinde*, Ashvini Shelke
1, Rajendra Mogal
2, Rahul Sable
3, Anil Jadhav
1Department of Pharmaceutical Chemistry, Sandip Institute of Pharmaceutical Sciences, Nashik, India-422213
2 Department of Pharmaceutics, Sandip Institute of Pharmaceutical Sciences, Nashik, India-422213 3 Department of Pharmacology, Sandip Institute of Pharmaceutical Sciences, Nashik, India-422213
*Corresponding author E-mail:[email protected]
ARTICLE INFO
ABSTRACT
Key words
:Tenofovir disoproxil fumarate, Emtricitabine,
Simultaneous Equation method,
Validation
The simple, accurate, rapid and precise method was developed for the simultaneous determination of tenofovir disoproxil fumarate (TEF) and emtricitabine (EMT) in combined tablets. The method involves the Simultameous equation method.Tenofovir (TEF) and Emtricitabine
(EMT) at their respective λmax 260 nm and 280nm shows linearity in
a concentration range of 5-30 μg/mL and 5-30 μg/mL respectively. Method employs formation and solving of simultaneous equation using 260nm and 280nm as two analytical wavelengths for both drugs using Distilled water. Reliability and analytical performance of the proposed methods, including linearity, range, precision, accuracy, detection and quantitation limits, were validated according to ICH guideline. The methods were successfully applied for the determination of EMT and TEF in laboratory-prepared mixtures and in their combined tablets.
INTRODUCTION:
Emtricitabine (4-amino-5-fluoro-1-[(2S,5R )-2- (hydroxymethyl)-1,3-oxathiolan-5-yl]-1,2-dihydropyrimidin-2-one), an analogue of cytidine, and Tenofovir disoproxil fumarate (({[(2R)-1-(6-amino-9H
-purin-9-yl)propan-2-yl]oxy}methyl)phosphonic acid), are
nucleoside reverse transcriptase inhibitor (NRTI) that are used for the treatment of HIV infection.
Fig 1: Chemical Structure of Emitricitabine
The chemical name of tenofovir disoproxil
fumarate is 9- [(R) - 2[[bis[
[(isopropoxycarbonyl)oxy]methoxy]phosphiny
l]methoxy]propyl] adenine fumarate.
Tenofovir disoproxil fumarate (tenofovir DF) is a bioavailable prodrug of tenofovir, a potent
nucleotide analogue reverse-transcriptase
inhibitor with activity against human immunodeficiency virus (HIV) and hepatitis B
virus. Fig 2: Chemical Structure of
Tenofovir disoproxil fumarate
Journal of Global Trends in Pharmaceutical Sciences
3615 A literature survey revealed that liquid
chromatography techniques have been
reported for the simultaneous determination of
emtricitabine, and tenofovir disoproxil
fumarate in pure drug, pharmaceutical dosage forms and biological samples. Hence, the authors have attempted to develop a simple, rapid, precise and accurate method for the simultaneous estimation of these drugs in tablet dosage forms. Confirmation of the applicability of the developed method was validated according to the International Conference on Harmonization (ICH) for the simultaneous determination of emtricitabine, and tenofovir disoproxil fumarate in bulk and in tablet dosage forms.
MATERIAL AND METHODS:
Chemicals and Reagents:
Pharmaceutical grade of
Emitricitabine and tenofovir disproxil
fumarate were kindly supplied as gift sample by Lupin. Distilled water was used as solvent. The marketed formulations were purchased from local market were obtained from retail pharmacist.
Instruments:
UV-Visible
Spectrophotometer-ELICO SL 164 with cuvette cells of one cm light path were used for the measurement of absorbance. Electronic Balance 200 D was used for weighing the samples. Class ‘A’
volumetric glassware were used.
UltraSonicator- wensar was used for sonication purpose.
Procedure:
UV Spectrometric methods for determination of Emitricitabine and tenofovir Disproxil fumarate:
Selection of Solvent:
The solvent was selected by
determining the solubility of Emitricitabine and tenofovir Disproxil fumarate in various solvents namely Distilled water, Hydrochloric Acid, Sodium Hydroxide Solution, Methanol. Finally, Distilled water was chosen as the solvent for Emitricitabine and tenofovir Disproxil fumarate depending on absorption at its analytical wavelength.
Preparation of standard stock solution:
An accurately weighed quantity of about 20mg Emitricitabine and tenofovir Disproxil fumarate was taken in a 100 mL volumetric flask and was dissolved in Distilled wtaer with sonication. The volume was made upto mark with Distilled water to get the concentration of 200ppm.
Preparation of Working Standard Solution of Emitricitabine and tenofovir Disproxil
fumarate:
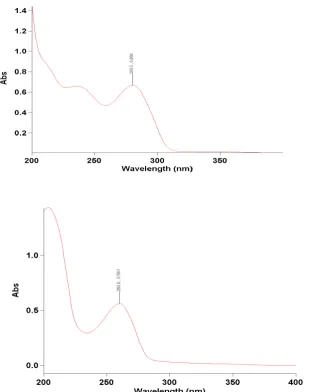
The aliquot portion of standard stock solution of Emitricitabine and tenofovir Disproxil fumarate was diluted appropriately with Distilled water obtaining concentration 10 μg/mL. Solution was taken in 1 cm cell and scanned in the range 200 nm to 400 nm and spectrum was recorder as showed in Fig.
Application of the proposed procedures for the simultaneous determination of EMT and TEN in laboratory prepared mixtures
Mixtures of the two drugs were prepared by diluting 1.0 mL of 200ppm stock solution of EMT and TEN with distilled water upto 10 mL. The concentrations of both EMT and TEN were determined by measuring the absorbance of the prepared mixtures at 280 nm and 260 nm. From these absorbance values, the concentrations of EMT and TEN were determined using Simultaneous equation method.
3616 other. So the absorbance of each drugs were
measured at both wavelengths λ1 & λ2 respectively. Both the drugs were determined
by simultaneous method (Vierodt’s method).
The absorptivity of EMT (X) at λ1 (281) and λ2 (260) is ax1 and ax2, respectively. The absorptivity of TEN (Y) at λ1 (281) and λ2 (260) is ay1 and ay2, respectively. The absorptivity of each solution was calculated by using the following formula:
Absorptivity=Absorbance/concentration (gm/1
00 ml. The absorbance of the sample
(formulation) at λ1 (281) and λ2 (260) is A1 and
A2 respectively. The total absorbance of the
mixture is equal to the sum of individual absorbance of X and Y.
A1 = ax1bCx + ay1bCy
A2 = ax2bCx + ay2bCy
Cx= A2ay1-A1ay2/ ax2 ay1- ax1 ay2
Cy=A1ax2-A2ax1/ ax2 ay1- ax1 ay2
Cx – concentration of EMT
Cy – concentration of TEN
Method Validation:
Specificity
Specificity was studied by measuring the absorbance of EMT, TDF individually at 280 nm and 260 nm against the blank and comparing the absorbance of drugs solutions to the blank. No interference was observed.
Linearity and range:
Five aliquots of each drug solutions were taken from standard stock solution and transferred to 10ml volumetric flask to get a final concentration of 5, 10, 15, 20, 25 and 30 μg/ml of Emitrictabine and 5, 10, 15, 20, 25 and 30 μg/ml μg/ml of Tenofovir Disoproxil Fumarate and the volume was made upto the mark with the distilled water and each flask content was measured to determine the absorbance at the selected wavelength. For simultaneous equation method the absorbance of all standard solutions were measured at 260nm and 280nm, the calibration curves of absorbance vs. concentration was plotted and correlation coefficient and regression line equations for both EMT and TDF were
determined. Straight line equations were obtained from these calibration curves. The linear regression equation of Emitricitabine y=0.0351x-0.0671 (R² = 0.9972) and Tenofovir Disoproxil Fumarate was y = 0.0252x +0.0140 R² = 0.9999. The result were reported in Table No 1& 2.
Precision
In intraday study concentration of two drugs were calculated on the same day after 6 hour. In inter day study the concentration of drug contents were calculated on two different days. In both intra and inter-day precision study for the methods % RSD were calculated. The result were reported in Table No 3,4,6.
Limit of Detection and Limit of Quantification:
ICH guideline describes several approaches to determine the detection and quantification limits. These include visual evaluation, signal-to-noise ratio and the use of standard deviation of the response and the slope of the calibration curve. In the present study, the LOD and LOQ were based on the third approach and were calculated according to the 3.3 × (SD/Slope) and 10 × (SD/Slope) criteria, respectively; where SD is the standard deviation of y-intercept of regression line and S is the slope of the calibration curve.
Accuracy: The accuracy of the proposed method was confirmed by Standard addition method. To the pre analyzed formulation a known amount of raw material was added and it can be analyzed by proposed methods. Recovery studies were carried out by at three different levels (50%, 100%, and 150% level). The amount of each drug recovered was calculated. The procedure was repeated for three times for each concentration. The results for recovery analysis are shown in table No 6.
RESULTS AND DISCUSSION:
A reliable Simultaneous Equation method was developed for simultaneous estimation of Emitricitabine and Tenofovir disoproxil Fumarate in bulk and Tablet by UV Spectrophotometry. Beers law was obeyed in
concentration range of 5-30 μg/ml for
3617
Fig 1& 2: UV Spectrum of Emitricitabine and UV spectrum of Tenofovir Disoproxil Fumarate
Table No.1 --Calibration data forEmitricitabine
S.no Concentration in
ppm
Absorbance
1 5 0.228
2 10 0.446
3 15 0.575
4 20 0.781
5 25 0.938
3618
Table No. 2 -Calibration data for Tenofovir Disoproxil Fumarate
S.no Concentration in ppm Absorbance
1 5 0.1368
2 10 0.2670
3 15 0.3933
4 20 0.5200
5 25 0.6396
6 30 0.7682
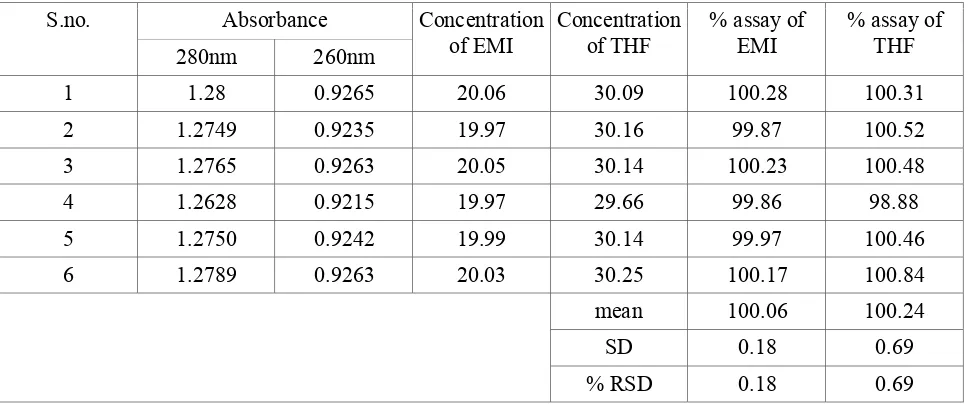
Table No 3: Intraday Precision
S.no. Absorbance Concentration
of EMI
Concentration of THF
% assay of EMI
% assay of THF
280nm 260nm
1 1.2798 0.9265 20.04 30.29 100.81 100.95
2 1.2742 0.9236 19.98 30.12 99.9 100.4
3 1.2721 0.9245 20.01 30 100.07 99.99
4 1.2658 0.9209 19.94 29.82 99.71 99.39
5 1.2788 0.9289 19.87 30.42 100.53 100.56
6 1.2769 0.9256 20.02 30.18 100.12 100.61
Mean 100.08 100.32
SD 0.28 0.55
% R. S.D 0.28 0.56
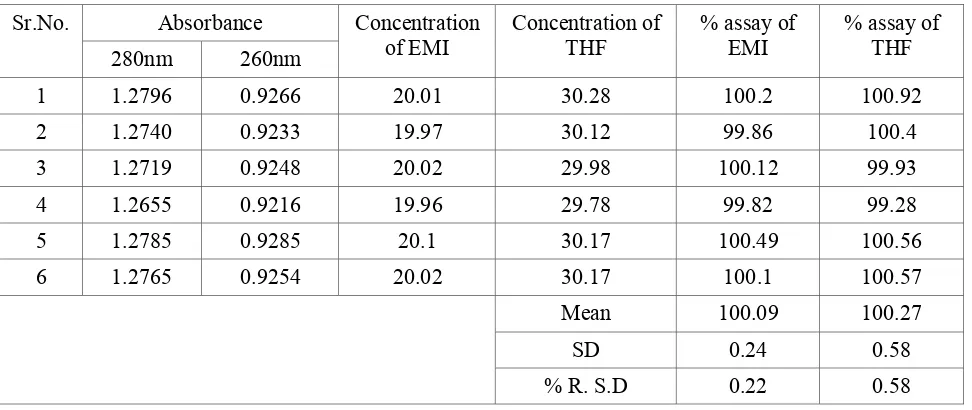
Table No 4: Intraday Precision after 6 hr
Sr.No. Absorbance Concentration
of EMI
Concentration of THF
% assay of EMI
% assay of THF
280nm 260nm
1 1.2796 0.9266 20.01 30.28 100.2 100.92
2 1.2740 0.9233 19.97 30.12 99.86 100.4
3 1.2719 0.9248 20.02 29.98 100.12 99.93
4 1.2655 0.9216 19.96 29.78 99.82 99.28
5 1.2785 0.9285 20.1 30.17 100.49 100.56
6 1.2765 0.9254 20.02 30.17 100.1 100.57
Mean 100.09 100.27
SD 0.24 0.58
3619
Table No 5: Intraday Precision 2nd day
S.no. Absorbance Concentration
of EMI
Concentration of THF
% assay of EMI
% assay of THF
280nm 260nm
1 1.28 0.9265 20.06 30.09 100.28 100.31
2 1.2749 0.9235 19.97 30.16 99.87 100.52
3 1.2765 0.9263 20.05 30.14 100.23 100.48
4 1.2628 0.9215 19.97 29.66 99.86 98.88
5 1.2750 0.9242 19.99 30.14 99.97 100.46
6 1.2789 0.9263 20.03 30.25 100.17 100.84
mean 100.06 100.24
SD 0.18 0.69
% RSD 0.18 0.69
Table No 6: Accuracy Data for emitricitabine and tenofovir Disoproxil fumarate in tablet sample
Sr.No. Level Absorbance Concentrati
on of EMI Concentration of THF % assay of EMI % assay of THF
280nm 260nm
1 50 1.9105 1.3925 30.17 44.93 100.57 99.84
2 50 1.9201 1.3920 30.11 45.38 100.38 100.85
3 50 1.9195 1.3909 30.09 45.39 100.29 100.86
4 100 2.5421 1.8595 40.33 59.58 100.82 99.3
5 100 2.5462 1.8605 40.34 59.74 100.85 99.57
6 100 2.5470 1.8613 40.36 59.75 100.89 99.59
7 150 3.1802 2.3105 50.02 75.01 100.03 100.02
8 150 3.1981 2.3235 50.3 75.44 100.59 100.58
9 150 3.1897 2.3231 50.32 75.07 100.65 100.09
Mean 100.56 100.08
SD 0.29 0.54
3620
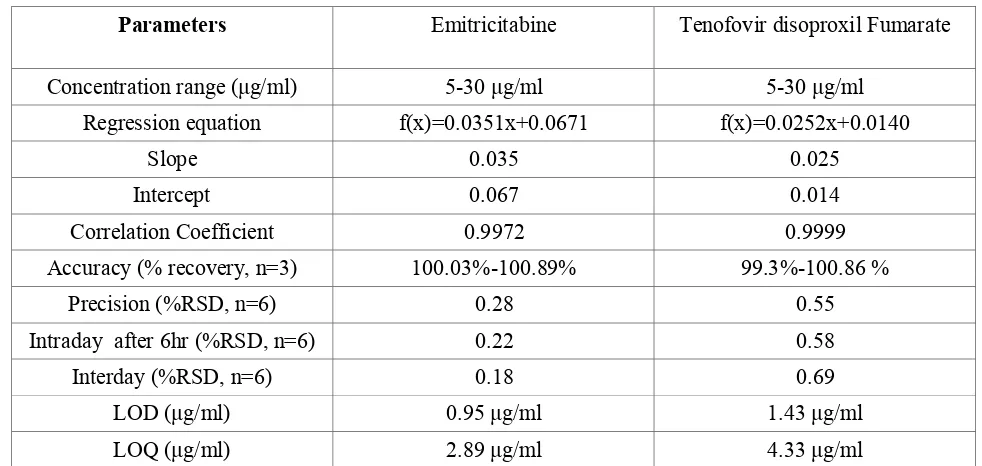
Table No 7: Validation Data for emitricitabine and tenofovir Disoproxil fumarate
Parameters Emitricitabine Tenofovir disoproxil Fumarate
Concentration range (μg/ml) 5-30 μg/ml 5-30 μg/ml
Regression equation f(x)=0.0351x+0.0671 f(x)=0.0252x+0.0140
Slope 0.035 0.025
Intercept 0.067 0.014
Correlation Coefficient 0.9972 0.9999
Accuracy (% recovery, n=3) 100.03%-100.89% 99.3%-100.86 %
Precision (%RSD, n=6) 0.28 0.55
Intraday after 6hr (%RSD, n=6) 0.22 0.58
Interday (%RSD, n=6) 0.18 0.69
LOD (μg/ml) 0.95 μg/ml 1.43 μg/ml
LOQ (μg/ml) 2.89 μg/ml 4.33 μg/ml
The correlation coefficient Emitricitabine and Tenofovir Disoproxil fumarate was found to be R2= 0.9972 and 0.9999. The mean % recoveries were found to be in the range of %
100.03-100.89% and 99.3-100.86 %
Emitricitabine and Tenofovir Disoproxil Fumarate respectively. Precision (% RSD) of Emitricitabine and Tenofovir Disoproxil Fumarate was found to be within the limit. The LOD and LOQ were 0.95 μg/ml and 2.89 μg/ml Emitricitabine and 1.43 μg/ml and 4.33 μg/ml of Tenofovir Disoproxil Fumarate, respectively. The proposed method was precise, accurate and reproducible and acceptable recovery of the analytes, which can be applied for the analysis of Emitricitabine and Tenofovir disoproxil Fumarate in bulk and Tablet. The result were reported in Table No 7.
CONCLUSION
A Simple, Specific, accurate, precise simultaneous equation method by UV has been developed which can be used accurately for quantitative estimation of emitricitabine and tenofovir disoproxil fumarate for routine analysis of drugs in combined dosage form. Method was validated as per ICH Q2 (R2) as it can be used by analytical department.
ACKNOWLEDGEMENT
The authors thank Dr. A.G. Jadhav principal, Sandip Institute of Pharmaceutical
Sciences for providing all the facilities for Research work. They also thank to Lupin Pharma, India for providing standard .They also thank the faculty of Sandip Institute of Pharmaceutical Sciences for their valuable suggestions and constant encouragement during research work.
REFERENCES:
1. International Conference On
Harmonisation Guideline On
Validation Of Analytical Procedures: Text And Methodology; Q2 (R1), 2005
2. A.H.Becket And J.B.Stenlak, Practical
Pharmaceutical Chemistry, 4th Edition Part- 2,284-285.
3. S.Budhavari, The Merck Index
(monograph#3521), 14, 598, (2006).
4. S.Budhavari, The Merck Index
(monograph#3565), 14, 606, (2006).
5. Ashutoshkar, Pharmaceutical Drug
Analysis 2 Nd Edition. New Age Publisher 2005 P.No:16-17
6. Deepthi Komaroju, G. Nagarjuna
Reddy, K. Dhanalakshmi "Method Development And Validation For
Simultaneous Estimation Of
Emtricitabine And Tenofovir
3621 Tablet Dosage Form By Using
RP-HPLC" International Journal Of Pharma Research & Review, Oct 2013; 2(10):1-11.
7. Swapnil A Ghorpade, Monali S. Sali,
Atul H. Kategaonkar, Dhaval M. Patel, Vishnu P Choudhari, Bhanudas
S Kuchekar "Simultaneous
Determination Of Emtricitabine And Tenofovir By Area Under Curve And Dual Wavelength Spectrophotometric Method" J. Chil. Chem. Soc., 55, Nº 1 (2010).
8. Bala Rami Reddy.Yenumula, Mutta
Reddy.Singampalli, “Simultaneous
Estimation Of Emtricitabine And Tenofovir Disoproxil Fumarate In Tablet Dosage Form By Reverse
Phase High-Performance Liquid
Chromatography"Soj Chromatograph Sci 1(1): 6.
9. Maithilee Joshi, A. P. Nikalje, M.