Abstract— In this project we would like to explain that to detect the tumours present on the brain. To analysis these there are so many methods like Magnetic Resonance Imaging (MRI) and so many other techniques, but for having the clear picture we are using the kernel Sparse Coding (KSR) for more clarification and spotting the tumours and then we used the texture feature which is the key and also the supporting feature for the KSR coding. This coding is better than the MRI results. By using this KSR method the reckoning of the cerebral will be easier and also the mapping of the cerebral will be acquired with more efficiency.
Index Terms—kernel sparse coding (KSR), Magnetic Resonance Imaging (MRI), Cerebral trauma, texture, tumors.
I. INTRODUCTION
Cerebral Edema will develop the inflammatory reaction if it is gradually affecting. It may end up with the consequence of cerebral trauma, hemorrhages, abscess, tumour, allergy, hypoxia and other metabolic and toxic factors. To solve this issue, we used several methods before like Magnetic Resonance Imaging (MRI) and so more, but in this project, we used the kernel sparse code (KSR) which is helpful for better results and less processing time and also less cost. In this KSR method we used the mapping method with the help of texture method it will separates the gray image which was generated by the MRI and then it will textures the image which means that spotting for the diseases on the cerebral and then the KSR method will map that particular texture and then it will spot for the tumours and then it will check for the tumours for the next upcoming textures it will repeat the process, this segmentation process will be goes on. In this segmentation technique there are two methods which are supervised and unsupervised. The total segmentation data will be collected and make it as image data and it will make it as the anatomic objective measure.
Manuscript received June 15, 201`4.
First Author name, His Department Name, University/ College/ Organization Name, ., (e-mail: [email protected]). City Name, Country Name, Phone/ Mobile NoSecond Author name, His Department Name, University/ College/ Organization Name, City Name, Country Name, Phone/ Mobile No., (e-mail: [email protected]).
Third Author name, His Department Name, University/ College/ Organization Name, City Name, Country Name, Phone/ Mobile No., (e-mail: [email protected]).
II. IMAGING MODALITIES Methods Used:
Kernel Sparse Coding (KSR).
Texture Features.
Gray Level Co-occurrence Matrix (GLCM).
BRATS Dataset
III. SOFTWARE DESCRIPTION A. Kernel Sparse Coding
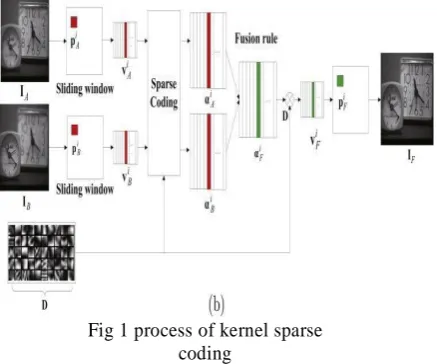
Firstly, we will discuss about the Magnetic Resonance Imaging so called MRI, the MRI process is used for detecting the diseases on the body. It will be done by convert the captured image into the gray image and then it will spot for the tumours and also for other diagnoses. It will take more time to do all this process, to avoid all these problems we shifted to Kernel Sparse Coding (KSR). This process is used to detect the every corner and unclear part of the image, it is also used for detecting the nonlinear similarities in the image.
Fig 1 process of kernel sparse coding
The main reason for using this method is it will reduce the quantisation errors on the image and also it will boost the sparse coding for better performance. The name itself can be derived that kernel means seed and the spare coding is used for weighing the images which is used for the face recognition and also for spotting the diseases. The working of this process is it will first divide the image which was converted into gray image by using the MRI. Then it will map the image into various sections like sub images and then it will segment the weight of the image at every corner and if it found any dissimilarity in the image it will check for the surroundings and send the image with a highlighted part which is defected. The accuracy of this
Kernel Sparse Coding & Texture Feature based
Segmentation for Cerebral Edema
method is very high.
S.
No Input Image
Entropy plot for Quadrant A
Entropy plot for Quadrant
C Segmented Image
1
2
3
4
5
6
Fig: 2: Input Image, Entropy in Quadrant A and C and Segmented Image
IV. TEXTURE FEATURES
The texture features are used for identification of the object, it means it will segment the image into different parts which are said to be sub segments and then later on it will check the each and every sub image segmentation and mark the different parts of the image with different textures with that we can easily spot the diseases and any other differences
there are several types of texture segmentations are available as follows:
Fig.3 : Texture pattern
V. GRAY LEVEL CO-OCCURRENCE MATRIX (GLCM): The Gray Level co-occurrence matrix is used for weighing the image which has been converted into gray image will be weighed by this and it will give the results in the matrix format and then it will calculate the different weights of other sub images and then it will give the final matrix and then later on it will be send to the KSR coding the coding will convert that and it will give the final image with the expected output.
Fig.4 Pattern of GLCM
The calculation of the image results will be held on different formulas such as:
VI. BRATS DATASET:
The BRATS database means the Brain Tumour and segmentation database for the given image which after segmenting the image using the above mentioned KSR and GLCM methods you will get the prescribed output for the occurred result and then it will be stored in the dataset.
Fig 5. BRATS extraction and result.
To acquire the good output we need to train the program with the several functions and then later it will give the good result for the segmented output.
Fig2.4.2 Several test cases for the BRATS dataset.
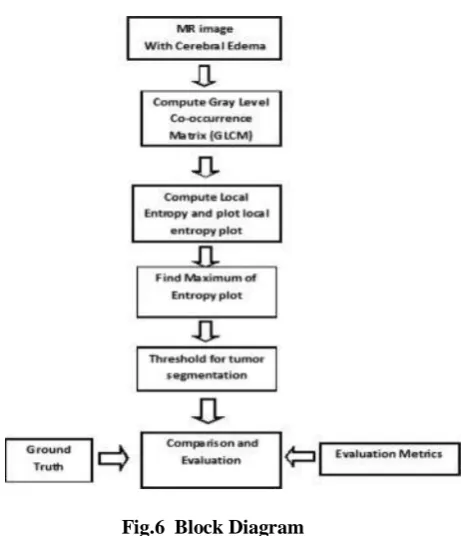
VII. BLOCK DIAGRAM
Fig.6 Block Diagram
Fig.7 Performance Evaluation
VIII. WORKING
The working of the project will be like this firstly it will convert the captured image into the gray image using the MRI procedure. It will be done into gray image by scaling the image and then later on it will calculate the all like correlation and entropy and then it will convert them into the final matrix and then it will send the weights to the BRATS dataset. This dataset which is used for saving the matrix values and then it will make all the vales and then it will form all the values in one particular form and then it will spot the whole image as above mentioned like giving more and more tries we will get the good results. Then later on it will send it to the KSR coding which will convert all the vales into the computer-based formats and it will differ the effected part and the normal value according to the values and it will be classify like this and it will make it as image and it will gives the output image and thus how we will get the results for the captured image.
Fig5.3 wave forms for the acquired weightage.
Weights of the image and then it will measure the colour codes of the each and every part of the image and then later on it will convert all the colour codes into gray colour code. We are doing this process is for better understanding for the
development and also for the good results. After converting the image into the gray image and then the main part will be start from here . Then the image will be sent to the GLCM which is used for calculating the image weights and then it will convert to the matrix and by using some formulas.
IX. CONCLUSIONS
The final conclusion is that we are using this method because for reducing the time complexity and also for this there is an advantage that it had a supporting thing like kernel and it will boost the code and this process will diagnoses each and every part of the image. It will gives the exact output for the captured or given image
REFERENCES
[1] Belhumeur, P.N., Hespanha, J.P., Kriegman, D.J.: Eigenfaces vs. fisherfaces: Recognition using class specific linear projection. TPAMI 19(7), 711–720 (1997)Google Scholar
[2] Bo, L., Sminchisescu, C.: Efficient match kernels between sets of features for visual recognition. In: NIPS (2009)Google Scholar
[3] Boiman, O., Shechtman, E., Irani, M.: In defence of nearest- neighbour based image classification. In: CVPR (2008)Google Scholar
[4] Boureau, Y., Bach, F., LeCun, Y., Ponce, J.: Learning mid-level features for recognition (2010)Google Scholar [5] Duda, R.O., Hart, P.E., Stock, D.G.: Pattern Classification, 2nd
edn. John Wiley & Sons, Chichester
(2001)zbMATHGoogle Scholar
[6] van Gemert, J.C., Geusebroek, J.M., Veenman, C.J., Smeulders,A.W.M.: Kernel codebooks for scene categorization. In: Forsyth, D., Torr, P., Zisserman, A. (eds.) ECCV 2008, Part III. LNCS, vol. 5304, pp. 696–709. Springer, Heidelberg (2008)CrossRefGoogle Scholar
[7] Georghiades, A., Belhumeur, P., Kriegman, D.: From few to many: Illumination cone models for face recognition under variable lighting and pose. TPAMI 23(6), 643–660 (2001)Google Scholar
[8] Griffin, G., Holub, A., Perona, P.: Caltech-256 object category
dataset. In: Technical Report (2007)Google Scholar
[10] He, X., Yan, S., Hu, Y., Niyogi, P., Zhang, H.: Face recognition using Laplacian faces. TPAMI 27(3), 328–340 (2005)Google Scholar
[11] Ho, J., Yang, M.H., Lim, J., Lee, K.C., Kriegman, D.J.: Clustering appearances of objects under varying illumination conditions. In: CVPR (2003)Google Scholar
[12] Hyvärinen, A.: The fixed-point algorithm and maximum likelihood estimation for independent component analysis. Neural Process. Lett. 10(1) (1999)Google Scholar
First Author Dr. Josephine Selle Jeyanathan Assistant Professor
Electronics And Communication Engineering, Kalasalingam academy of research and education
Madurai, India [email protected]
Second Author S.V. Nikhil Electronics And Communication Engineering, Kalasalingam academy of research and education Madurai, India [email protected]
Third Author T. Bhanu Teja Electronics and communication Engineering, Kalasalingam academy of research and Education Madurai, India [email protected]