in the population sciences published by the Max Planck Institute for Demographic Research Konrad-Zuse Str. 1, D-18057 Rostock · GERMANY www.demographic-research.org
DEMOGRAPHIC RESEARCH
VOLUME 25, ARTICLE 4, PAGES 135-172
PUBLISHED 12 JULY 2011
http://www.demographic-research.org/Volumes/Vol25/4/ DOI: 10.4054/DemRes.2011.25.4
Research Article
Intergenerational family constellations in
contemporary Europe: Evidence from the
Generations and Gender Survey
Allan Puur
Luule Sakkeus
Asta Põldma
Anne Herm
This publication is part of the proposed Special Collection "Intergenerational family ties in Europe: Multiple linkages between individuals, families and social contexts", edited by Pearl Dykstra.
© 2011 Allan Puur et al.
This open-access work is published under the terms of the Creative Commons Attribution NonCommercial License 2.0 Germany, which permits use, reproduction & distribution in any medium for non-commercial purposes, provided the original author(s) and source are given credit.
1 Introduction 136
2 Previous findings related to the demographic foundations of family
change 137
3 Data and analytical approach 140
4 Results 142
4.1 The patterns of kin availability 142
4.1.1 Children 142
4.1.2 Parents 145
4.1.3 Grandchildren 147
4.1.4 Grandparents 150
4.1.5 Great-grandchildren 151
4.2 A synthetic account of the family constellations 153
5 Summary and discussion of the findings 157
6 Acknowledgements 161
References 162
Intergenerational family constellations in contemporary Europe:
Evidence from the Generations and Gender Survey
Allan Puur1 Luule Sakkeus2
Asta Põldma3 Anne Herm4
Abstract
Demographic research has drawn attention to the multiple ways in which changes in mortality and childbearing have produced major shifts in intergenerational family structures. The aim of this article is to contribute to this body of research by analysing the data from the Generations and Gender Surveys for nine European countries. In the study, data pertaining to the availability of ascending (parents and grandparents) and descending (children, grandchildren, and great-grandchildren) kin of each respondent are combined to shed light on the family structures in which individuals are embedded at various stages of their lives. The findings provide new insights into the ways in which various past and present demographic regimes come together to form specific intergenerational family constellation patterns across Europe. This convergence may yield family constellations of very similar “heights” in countries with sharply contrasting demographic histories. The results also indicate that certain demographic scenarios may halt or temporarily reverse the trend towards the further vertical extension of family constellations.
1. Introduction
Intergenerational support within the family is recognised as being fundamentally important to individual well-being and social integration. Research investigating the foundations of changes in the family has drawn attention to ways in which variations in mortality, fertility, and nuptiality translate into major shifts in the number and configuration of ties through which intergenerational support is provided and received (Watkins, Menken, and Bongaarts 1987; Uhlenberg 1996; Murphy and Grundy 2003). According to a widely accepted theory of family change during the transition to the modern demographic regime, declines in mortality and fertility have resulted in the verticalisation of family structures: i.e., more generations are alive, but with fewer members in each generation (Bengtson, Rosenthal, and Burton 1990).
Demographic transition theorists (Notestein 1953; Kirk 1996) expected the shift towards the modern demographic regime to result in a new equilibrium between low levels of mortality and fertility. However, developments have not occurred as forecast. Following a brief respite provided by the post-war baby boom, fertility resumed its decline and fell below replacement levels (Frejka and Sardon 2004; Frejka and Sobotka 2008). Although the 2000s have witnessed some recovery, fertility remains under replacement in virtually all of the countries of Europe (Goldstein, Sobotka, and Jasilioniene 2009). With regard to longevity, predictions about stagnation in life expectancy have not been realised, and mortality has continued to decline even in countries with the highest life expectancy (Oeppen and Vaupel 2002; Vallin and Meslé 2009).
These developments continue to transform family constellations, with significant implications for well-being and social integration, but the nature and extent of these changes is relatively poorly charted. A major reason for this lack of knowledge is related to the availability of data, since a comprehensive understanding of family structures cannot be derived from conventional sources of demographic information. Measures based on vital statistics are indispensable for describing trends in mortality and fertility; however, they appear to have limited ability to provide insight into the ways in which the different processes interact, affect families, and shape lives. The measures based on household units that are prevalent in censuses and surveys usually disregard non-co-residing family members.
overlooked. In order to construct the models, researchers need to make assumptions about the underlying processes, which could influence the results. This may be a minor concern when comparing highly contrasting demographic regimes. But when the differences are more subtle, such as the variations across contemporary European countries, the dependence of the results on modelling assumptions may become an issue. An alternative research strategy draws on observational data from sample surveys that collect information on non-co-residing kin (Farkas and Hogan 1995; Grundy, Murphy, and Shelton 1999; Dykstra and Komter 2006). The drawbacks of the survey-based approach typically relate to biases resulting from partial coverage of the target population, high rates of non-response, and inaccuracy of reporting. The estimates are also subject to sampling variation, and the types of kin on which information are collected tend to be limited.
This article is intended to complement the aforementioned body of research by providing an analysis of the newly available comparative data from the Generations and Gender Surveys (GGS). Our objective was to examine the variations in intergenerational family constellations at the beginning of the 21st century. We addressed the following questions: How many generations, in ascending and descending directions, surround individuals in contemporary populations? How common are vertically extended lineages that consist of three, four, or even five generations? How many people are deprived of family, lacking inter- and/or intragenerational ties? In answering these questions, the cross-national comparative perspective of the GGS made it possible to identify – at the level of individuals and of families – the consequences of demographic regimes that are characteristic of particular groups of European countries and regions. These issues have become increasingly important for policy makers in light of an ageing population: when support from family members is insufficient or unavailable, a change in family constellations may shift the burden of support from kin and social networks to society as a whole, through tax or insurance schemes.
2. Previous findings related to the demographic foundations of
family change
number of children born to the average family. According to Bengtson, Rosenthal, and Burton (1990), these mutually reinforcing developments have led to an increase in the proportion of families characterised by a “beanpole” structure made up of three, four, or even five living generations, but with fewer members in each generation. The shift towards this type of family is also referred to as the “verticalisation” of family structures, which has two aspects: an increase in the number of relationships across generational lines, as multi-generation families become more common; and a trend towards fewer horizontal kin ties (Hagestad 2000).
Although these theoretical premises are widely accepted, relatively few studies have empirically examined the change in family constellations during the transition from the pre-modern to the modern demographic regime. Using family status life tables for the United States in 1800, 1900, 1960, and 1980; Watkins, Menken, and Bongaarts (1987) showed that demographic modernisation implies a longer time spent in the roles of child, parent, and spouse. Their results indicated that, contrary to conventional wisdom, the rise in longevity has more than compensated for the effects of decreased fertility and increased divorce rates over the long term. Post et al. (1997) conducted a study that is of particular interest in the context of this article. Their study drew on observational data from Dutch genealogical records. For the period 1830–1990, they continuously assessed the effect of the demographic transition on the number of kin from the onset through to the completion of the regime change. Somewhat surprisingly, the results did not reveal a fundamental change in the number of vertical ties over the period studied. Despite a decline in fertility, the average numbers of children, grandchildren, nephews, and nieces were as high or higher in 1990 as they were in the early 19th century, mainly as a result of the sharp decrease in infant and child mortality. The number of ascending kin (parents, grandparents, uncles, aunts) changed very little.
A closer examination of the findings of the Dutch study suggests that the number of kin follows a two-stage pattern: at the early stages of the demographic transition, the number of descending and lateral kin increases, followed by a decrease at the later stages. At the macro level, the birth of the largest cohorts at the height of the transition appears to demarcate the line between these two stages. In the following 70–80 years, this wave travels from the bottom to the top of the population pyramid, producing a complex transformation in family constellations. Although the authors reported no measures that would directly address the configuration of family structures, their results are at odds with the notion of a straightforward linear trend towards the beanpole family structure.5 The latter probably did not gain momentum until the later stages of demographic modernisation, when the effect of falling fertility rates counteracted the
5 Ideally, verticalisation should be expressed as an increase in the ratio between vertical and horizontal family
effect of decreasing infant and child mortality. Until that point, the growth in the number of lateral ties probably exceeded that of vertical ties; this assumption is supported by the increase in the number of lateral kin, which peaked in the 1930s– 1960s (Post et al. 1997).
As of the 2000s, advanced European countries are already 60–70 years into the post-transitional stage of demographic development. The question of whether there has been a steady progression towards more vertical family structures during this period cannot be fully answered from existing research. Observational studies of intergenerational family constellations are relatively scarce, and are often restricted to cross-sectional snapshots at specific points in time (Farkas and Hogan 1995; Grundy, Murphy, and Shelton 1999; Knipsheer et al. 2000; Dykstra and Komter 2006). In one of the few exceptions, Pennec (1997) examined the trends in the probability of being in a multi-generation family in France. The study indicated that membership in a four-generation family became increasingly common among cohorts born between 1920 and 1950. The upward trend drew its strength from several developments that converged and reinforced each other in these generations: a continuing decline in mortality, a decrease in childlessness, and a shift towards earlier family formation. It is likely that the steep rise in the incidence of multi-generation families reported for France extends to other countries that experienced the disappearance of the historical marriage pattern, characterised by a high age at first marriage and a high proportion of individuals who never marry, as well as a baby boom in the period after WWII.
In this article, we examined the generational structure of families in nine European countries at the beginning of the 21st century. Against the backdrop of the opposing effects of childbearing and mortality, and the persistent diversity of the underlying demographic processes (Frejka and Sobotka 2008; Vallin and Meslé 2005), we expected to find considerable variation in intergenerational family constellations across countries. Under these circumstances, an increase in the number of generations in the family, and in the incidence of multigenerational ties, may have become a matter of degree, dependent on the effects of competing influences.
3. Data and analytical approach
Our empirical analysis is based on data extracted from national surveys carried out within the framework of the Generations and Gender Programme (Vikat et al. 2007).6 These surveys enable direct observation of the family ties which link successive generations of a family, irrespective of co-residence, as well as various types of exchanges that take place as a result of these ties. These kinds of issues can only be partially examined by means of other cross-nationally comparative datasets. For instance, SHARE (Survey of Health and Retirement in Europe) has information only on older age groups; ECHP (EC Household Panel) and its successor, EU-SILC (EU Survey on Income and Living Conditions), yield only limited information about family members living outside the household; and two rounds of the ISSP (International Social Survey Programme) have collected data only on adult generations of kin. Unlike many studies of intergenerational family structures that draw their evidence solely from the experience of women (e.g., Watkins, Menken, and Bongaarts 1987; Pennec 1997; Murphy, Martikainen, and Pennec 2006), the GGS provides information about both sexes.
The results presented in the following sections pertain to the nine GGS countries for which the micro-data from the first wave of the survey were available to the authors in the fall of 2010.These are Bulgaria, Estonia, France, Georgia, Germany, Hungary, the Netherlands, Romania, and Russia. Although the selection does not include countries from the northern and southern parts of the continent, it is considered to be reasonably representative of both the historical and contemporary demographic diversity existing in Europe. From a historical perspective, the countries cover almost the whole spectrum of demographic modernisation, from the vanguard (France) to the latecomers (e.g., Georgia and the Russian Federation). With respect to more recent
6 The authors gratefully acknowledge the Population Activities Unit, United Nations Economic Commission
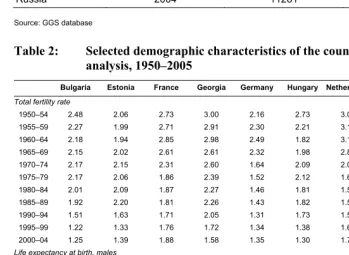
periods, they feature considerable variation in mortality and fertility regimes, which provides an opportunity to examine the interplay between demographic processes and family structure. Table 1 in the appendix contains a summary of the characteristics of each national survey. Appendix Table 2 presents the key indicators characterising the demographic profile of the countries included in the analysis.
The starting point for the analysis was to define the family network. The GGS collected information on the following types of kin: children, parents, grandchildren, grandparents, great-grandchildren, partners, and siblings (UNECE 2005). Information about family members in each of these roles was collected irrespective of co-residence with the respondent. The amount of detail about each type of kin varies with the nature of the relationship. More information is available about members of the immediate family of the respondent (children, parents, and partners). Information about more distant relatives (grandparents, great-grandchildren) is limited to the number of living kin at the time of the survey, which provides the common denominator for the analysis. With regard to intergenerational ties, the GGS collected information primarily on biological ties; information on non-biological ties, independent of co-residence, is systematically available only with regard to children (adopted, foster, and stepchildren).7For that reason, the study is restricted to biological relationships that can be linked to patterns of longevity and childbearing.
We applied the so-called “egocentric” perspective to mapping family constellations (Hagestad 2000; Herlofson and Hagestad 2011). In this approach, the survey respondent serves as an anchor, and the descending and ascending family generations are analysed from his or her position. The age range of the GGS respondents (18–79) reduces the bias towards a “top-down” or “bottom-up” perspective, which are characteristic of studies focusing on specific age groups. Nonetheless, in interpreting the results, it should be remembered that the anchors are not representative of the two extremes of the age distribution (children and the extremely elderly).
The analysis was undertaken in two stages. First, we considered the proportion of the population who had close kin in descending (children, grandchildren, and great-grandchildren) and ascending (parents and grandparents) generations. Second, we combined the data concerning the older and younger generations in order to highlight the generational structure in which individuals are embedded. This approach provided us with synthetic measures, such as the number of family generations, the proportion of individuals who lack intergenerational family ties, and the generational position of the anchor. In addressing these aspects, we sought to map the similarities and
7 Information on non-co-resident stepchildren was limited to children of the current partner. Data on children
dissimilarities in family constellations between the countries and regions of Europe. The results were expected to cast light on the ways in which variations in demographic regimes with respect to longevity and childbearing converge and produce specific patterns of intergenerational structures. The details pertaining to specific variables are discussed in the following sections.
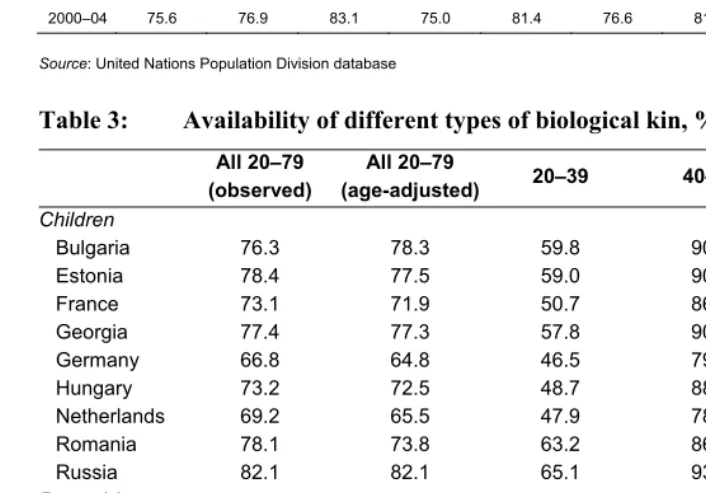
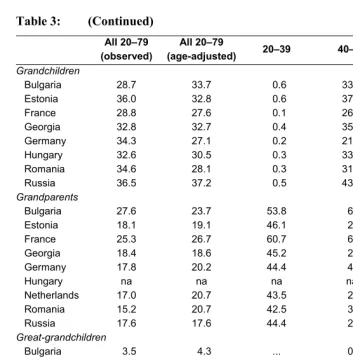
To conserve space, the results have been presented in graphic format. In addition, Tables 3–5 in the appendix contain information pertaining to the survey population aged 20–79, and three aggregate age groups representing younger (20–39), middle-aged (40–59), and older adults (60–79); on the availability of kin, the number of generations in the family, and the generational position of the anchor. 8 In interpreting the results, it is important to keep in mind that the study draws on surveys that are subject to bias resulting from limited coverage of the target population, non-response, and inaccuracy of reporting. The GGP infrastructure project is currently collecting detailed information on these issues. To gauge the net effect of some significant biases associated with the present study, we compared GGS estimates of the number of children and the proportion of childlessness for women, with reports based on demographic statistics (Frejka and Sardon 2004; Rowland 2007; Dykstra 2009). In most countries, the surveys seem to overreport the proportion of childlessness, while underreporting the number of children and the prevalence of descending intergenerational ties. However, based on a careful review of the results, we believe that the imperfections of the data do not invalidate the main findings.
4. Results
4.1 The patterns of kin availability
4.1.1 Children
The GGS revealed a noticeable variation in the availability of children. Among the countries included in the analysis, the overall proportion of respondents having at least one biological child appears to be lowest in Germany, where only two-thirds (67%) of respondents aged 20–79 had children, followed by the Netherlands (69%). At the other end of the spectrum, the proportion of adults with children in the Russian Federation was 82%, making the percentage of childless respondents almost half as high as in
8 To account for the variation at the upper and lower age limits of the samples, and to ensure better
Germany. Among the remaining countries, France and Hungary had similar levels of around 73%; while in Bulgaria, Estonia, and Romania, the proportion of the adult population with children was somewhat higher.9
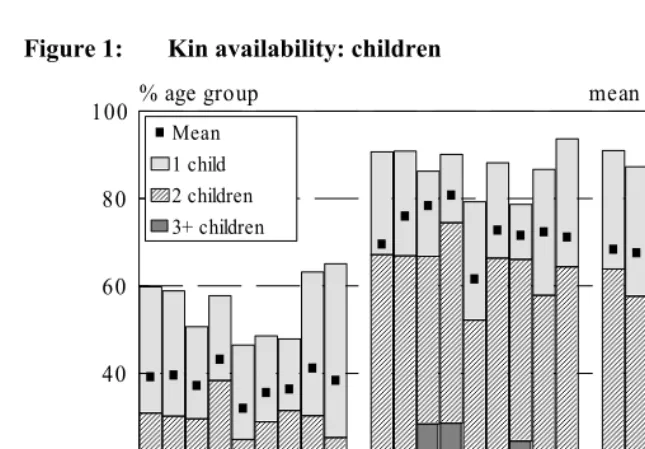
In order to understand the reasons for the observed variations, it is necessary to consider several factors that determine the availability of children among the adult population, such as the proportion of adults who ever become parents, the timing of entry into parenthood, and the levels of child and adult mortality. The contribution of fertility patterns is illustrated in greater detail in Figure 1, which shows the availability of children for three aggregate age groups. These data revealed that, in most countries, 85%–90% of the elderly (the 60–79 age group) had at least one surviving biological child.
A similar situation was also found to exist among the middle-aged (40–59), who will dominate the older population beginning in the mid-2020s. Only Germany had a markedly lower availability of children: it was the sole country among those included in the analysis where the proportion of the childless exceeded one-fifth of both the middle-aged and elderly populations. The latter figure should be treated with caution, as the German GGS has been known to overstate childlessness in older age groups (Kreyenfeld et al. 2010). The pattern reveals the consequences of the persistence of very low fertility; in West Germany, the total fertility rate has been below 1.5 since 1975, which accords with the mean number of children for the middle-aged population, as shown in Figure 1.10
9 It should be noted that the general measures of kin availability are affected by differences in the age
structure of the population across countries. We have therefore calculated age-adjusted measures using the 2005 population of Europe as a standard (Appendix Tables 3–5). The variation in the age structure may slightly alter the relative position of individual countries; however, it does not affect the overall pattern.
10 To assess the impact of restricting the analysis to biological ties, measures of child availability were
Figure 1: Kin availability: children BU EE FR GE DE HU NL RO RU BU EE FR GE DE HU NL RO RU BU EE FR GE DE HU NL RO RU 0 20 40 60 80
100 % age group
0,0 0,5 1,0 1,5 2,0 2,5 mean number of children
3+ children 2 children 1 child Mean
Source: GGS database, authors’ calculations
The measures of child availability for young adults (20–39), unlike the measures for the middle-aged and older populations, are strongly affected by the postponement of childbearing, which increases the divergence. Whether these larger differentials will be reflected in the ultimate level of childlessness for these younger generations hinges on the extent to which the postponed births will be recuperated at later stages of these cohorts’ reproductive periods. There are indications that the degree of recuperation varies across regions and countries of Europe (Frejka and Sardon 2004; Frejka and Sobotka 2008), but further exploration of this issue is beyond the scope of this article.
expectancy (e.g., the Russian Federation), the differences between the proportion of elderly with children ever born and surviving did not exceed 3%–4%. However, nearly one person in five in these countries had lost a child before reaching his or her 75th birthday.
Figure 2: Kin availability: children ever born and surviving
Bulgaria Estonia France Georgia Germany Hungary Netherlands Romania Russia
0 20 40 60 80
100 % population 70-79
0,0 0,5 1,0 1,5 2,0 2,5 3,0 mean number of children
1+ child ever-born 1+ child alive
Mean number ever-born Mean number alive
Source: GGS database, authors’ calculations
The apparent discrepancy between the sets of measures – the reduction in child availability (no more than four percentage points) and the proportion of elderly who had experienced the loss of a child (up to 20%) – points to the fact that parents are less likely to outlive their children if they have many offspring. On the other hand, despite the relatively minor impact on kin availability, the effects of the death of a child on the well-being of the elderly should not be overlooked. Paradoxically, it may be the decreasing probability of that event that increases the difficulty of the adjustment (Atchley 1975; Hagestad 1988).
4.1.2 Parents
countries of Eastern Europe, the lowest incidence of parental ties was found, not surprisingly, in Romania, Estonia, and the Russian Federation; with 55%, 59%, and 61% of respondents, respectively, having at least one living parent.11 The countries with the highest prevalence of ascending intergenerational ties were Bulgaria (70%) and France (69%). In the remaining four countries, the proportion with at least one living parent ranged between 63% and 66%.
Given Bulgaria’s life expectancy of 69 years for men and 76.2 years for women at the time of the survey, with little improvement since the 1970s, the top-ranking position of the country may seem surprising. This is partly due to the age structure of the population, but it also draws attention to other factors that affect the ties upwards from the anchor. It often goes unnoticed in studies of intergenerational constellations that, next to longevity, the availability of ascending kin depends on the timing of fertility in the parental generation, particularly the age of onset of childbearing, and determines the ages of parents relative to their children. Due to a persistent pattern of early childbearing for most of the 20th century, Bulgaria was found to exhibit the shortest generational distance (26.3 years) between the anchor and his or her parents, which offset the relatively low life expectancy. For France, the corresponding distance was 29 years. Estonia, west of the Hajnal line, displayed the greatest distance between generations (29.6 years), which partly explains the country’s low ranking.
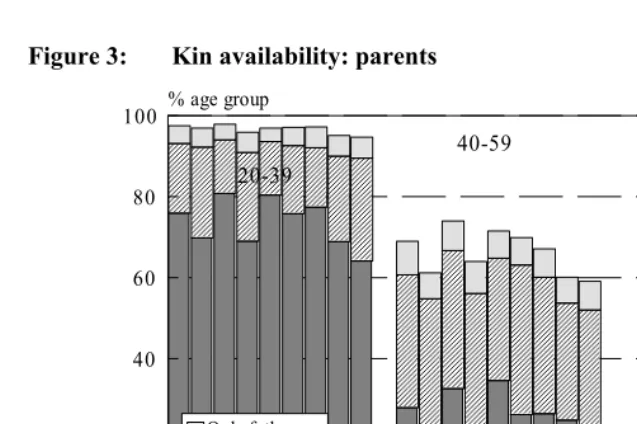
Figure 3 presents a comparative profile of parental ties for young, middle-aged, and older adults. It appears that, even under conditions of high mortality, 95% of young adults aged 20–39 had at least one surviving parent. In countries that are more advanced in terms of the health transition, the corresponding proportion was 98%. Among young adults, the largest variation was related to whether one (typically the mother) or both parents was still alive. Although the likelihood of having ascending kin was significantly lower in the 40–59 age group, three-fifths or more of the middle-aged population of contemporary Europe had surviving parent(s). France was at the top of the list, with 74% of its 40–59-year-olds having at least one living parent; Russia was at the other extreme, with a corresponding figure of 59%. Another characteristic of the middle-aged population relates to the shifting proportion between individuals whose parents are both alive and those with only one surviving parent: in all nine countries, the latter clearly outnumbered the former. This implies that the loss of a parent (typically the father) was an experience shared by a majority of the population aged 40–59 (65%– 83%).
11 As the age-adjusted measures in Appendix Table 3 indicate, the bottom-ranking position of Romania stems
Figure 3: Kin availability: parents BU EE FR GE DE HU NL RO RU BU EE FR GE DE HU NL RO RU BU EE FR GE DE HU NL RO RU 0 20 40 60 80
100 % age group
Both parents
Only mother
Only father
20-39
40-59 60-79
Source: GGS database, authors’ calculations
Among the population aged 60–79, having a living parent becomes an exception. The prevalence of parental ties appears to be highest in France, where 16% of older persons had surviving parent(s). In high mortality countries, the proportion did not exceed 5%. The observed patterns translate into a spread of about 10 years in the age at which the loss of parents occurs in contemporary Europe. As a result, the shift to the position of the oldest generation in the family takes place at a markedly different point in the course of the anchor’s life. This timing results in differences in the period at which the greatest demands are made on adult children, and it will also affect other factors, such as the average age at inheritance (Avery and Rendall 2002).
4.1.3 Grandchildren
beyond adjacent generations. The most prevalent of these historically novel multigenerational ties is the link between grandchildren and grandparents. This relationship appears to be more complex than that of parents and children. Dependence on the behaviour of multiple generations makes its configuration less evident (Herlofson and Hagestad 2011).
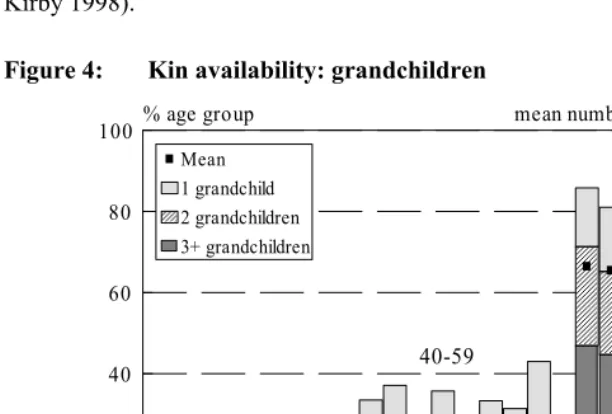
In general, ties between non-adjacent generations are less prevalent than those between adjacent generations, for obvious reasons: grandchildren can be born only to adults who are parents themselves, and whose offspring have reached reproductive age. Therefore, about one-third of the population aged 20–79 were found to have grandchildren. Across countries, the availability of grandchildren varied from 29% in Bulgaria and France to 37% in Russia.12 However, a large majority of the 60–79 age group had grandchildren (Figure 4). The GGS data revealed that on average, four-fifths of the 60–79-year-olds living in contemporary Europe have become grandparents. In fact, among the older population, ties with grandchildren were shown to be only slightly less common than ties with children, as discussed in the previous section. This finding underscores the significance of grandparenthood as an essential feature of contemporary families after midlife, notwithstanding the particularities of the demographic context.
Among the countries included in the analysis, Romania, France, and Germany exhibited somewhat lower levels (76%–78%). In the remaining countries, more than 80% of the population aged 60–79 were grandparents, with the highest levels found in Bulgaria and the Russian Federation (86% in both cases). At the same time, the mean number of grandchildren seems to be independent of the reported rates of prevalence. This finding is exemplified by the fact that the country with the highest availability of grandchildren among the older population (the Russian Federation) was also found to have the lowest number of grandchildren. Similarly, the country with the second lowest incidence of grandchildren (France) ranked second highest, next only to Georgia, in terms of numbers.
Compared to the 60–79 age group, the variation in the availability of grandchildren across countries reached higher levels among the middle-aged population. At the high end, the proportion of grandparents in Russia was 43% of 40–59-year-olds, whereas the corresponding figure for Germany was nearly half that figure (22%). In the synthetic cohort framework, this implies an approximate 10-year spread in the modal ages of entry into grandparenthood, exceeding the variation across countries in the age at onset of parenthood. Previous research has provided evidence that age at grandparenthood is
12 The low prevalence of grandchildren in Bulgaria is due to the age structure of the population (Appendix
closely related to the nature of multigenerational bonds (Barranti 1985; Uhlenberg and Kirby 1998).
Figure 4: Kin availability: grandchildren
BU EE FR GE DE HU RO RU BU EE FR GE DE HU RO RU BU EE FR GE DE HU RO RU 0 20 40 60 80
100 % age group
0,0 1,0 2,0 3,0 4,0 mean number of grandchildren
3+ grandchildren 2 grandchildren 1 grandchild Mean 20-39 40-59 60-79
Source: GGS database, authors’ calculations
4.1.4 Grandparents
In the countries included in the analysis, a relatively small minority of the population aged 20–79 had at least one surviving grandparent. In accordance with a “top-down” view of that relationship, discussed in the previous section, the lower availability of grandparents stems from the restriction of the survey sample to the adult population and the exclusion of children and adolescents, among whom the availability of grandparents was highest. In Bulgaria and France, the overall availability of grandparents was somewhat higher, with 28% and 25% of adults aged 20–79, respectively, having at least one surviving grandparent at the time of the survey. In the other countries, the prevalence of grandparental ties was considerably lower, ranging from 15%–18%.13
Figure 5 provides details of the availability of grandparents in aggregate age groups. In all of the countries for which data are available, the ties persist well into young adulthood. The proportion of young adults aged 20–39 with at least one surviving grandparent was highest in France (61%). In Bulgaria as well, more than half (54%) of the population aged 20–39 had ascending ties across two generations. In Estonia, Georgia, Germany, the Netherlands, Romania, and Russia, the corresponding percentages range between 42% and 46%. Differences across countries in the mean number of surviving grandparents follow a similar pattern. It is interesting to note that the proportion of young adults with surviving grandparents tends to exceed the relative number of middle-aged adults with living parents, as discussed in the earlier sections. A particularly pronounced difference can be seen in Estonia and the Russian Federation, where the former phenomenon was shown to be more than 1.5 times more frequent than the latter. At the other extreme is Germany, where the proportion of young adults with living grandparents was slightly lower than the proportion of middle-aged adults with living parents. Such variations add to the diversity of intergenerational relationships across contemporary Europe.
13 The harmonised datafiles of the Hungarian GGS do not include information about grandparents; therefore,
Figure 5: Kin availability: grandparents BU EE FR GE DE NL RO RU BU EE FR GE DE NL RO RU BU EE FR GE DE NL RO RU 0 20 40 60 80
100 % age group
0,00 0,25 0,50 0,75 1,00 1,25 mean number of grandparents
4 grandparents 3 grandparents 2 grandparents 1 grandparent Mean 20-39 40-59 60-79
Source: GGS database, authors’ calculations
A more refined breakdown by five-year age groups, not shown in Figure 5, reveals that a large majority of 20–24-year-olds—ranging from 84% in France to 71% in Germany—still have living grandparent(s). This pattern indicates that, at present, intergenerational ties between grandchildren and grandparents frequently span three or more decades. An increasing number of grandparents are now living to see their grandchildren grow up, complete their education, start living independently, form families, and have children. As noted by Sprey and Matthews (1982), these developments are introducing new dimensions into the grandparent-grandchild relationship.
4.1.5 Great-grandchildren
limited to 2%–4% of respondents aged 20–79. Across countries, the highest percentage is observed in the Russian Federation (4.6%), with Germany and France exhibiting the lowest levels (1.9% and 2.5%).14 The low prevalence is partly due to sample selection, since the GGS excludes the population over 80 years of age, who are most likely to have great-grandchildren.
The low prevalence of ties across four generations does not mean that the proportion of individuals experiencing these relationships is equally low. After age 60, the age-specific prevalence of great-grandchildren increases rapidly, and reaches quite high levels in the oldest age groups (Figure 6). In most countries for which data are available, 30% or more of 75–79-year-olds were found to be great-grandparents, and to have family networks that extend across four generations. The findings pertaining to great-grandchildren lend further support to the assertion that demographic patterns cumulate across generations.
Figure 6: Kin availability: great-grandchildren
20-24 25-29 30-34 35-39 40-44 45-49 50-54 55-59 60-64 65-69 70-74 75-79
0 10 20 30 40 50
60 % age group
Bulgaria France Georgia Germany Hungary Romania Russia
Source: GGS database, authors’ calculations
14 Estonia and the Netherlands did not collect information on great-grandchildren, and are therefore excluded
In Figure 6, we find at the extremes of the distribution the same countries that exhibited the sharpest contrast in the age of entry into grandparenthood: the Russian Federation is at the top and Germany is at the bottom. But instead of a twofold difference between the extremes in the prevalence of grandparenthood, the data reveal a threefold difference (48% vs. 16% in the 75–79 age group) in great-grandparenthood. These results suggest that the timing of childbearing plausibly exerts a stronger influence than advances in longevity on the incidence of multigenerational ties.
4.2 A synthetic account of the family constellations
The previous sections presented the findings pertaining to different family relationships separately. This approach predominates in contemporary social science, as researchers tend to view parent-child relationships and ties to other family members in isolation, rather than as part of a longer chain connecting the generations. A comprehensive view of these connections requires measures that summarise the patterns across the whole spectrum of intergenerational ties. A convenient way to produce such a summary is to inventory the generations in the individual's kin network. From a theoretical perspective, this reveals the vertical extension of intergenerational constellations, which appears to be the main direction in which contemporary families are evolving (Treas and Bengtson 1982; Bengtson, Rosenthal, and Burton 1995).
Figure 7 shows the number of generations in the anchor’s family. Contrary to popular belief, the GGS findings indicate that the verticalisation of family ties has not (yet) resulted in the dominance of kin networks of four or five living generations. In the countries included in the analysis, families consisting of three generations appear to be the most common.15 On average, about three-fifths of adults aged 20–79 were shown to be embedded in that type of generational structure. Despite the diversity of the underlying demographic regimes, the variation in the incidence of three-generation families was relatively small. In most countries, it was slightly above 60% (from 60% in France to 63% in Estonia). Germany, at 55%, had a lower incidence of three-generation families.
15 The data for Hungary and the Netherlands are not presented in this section. The Hungarian GGS did not
The majority of the remaining two-fifths of the population aged 20–79 was almost evenly divided between two- and four-generation families. The proportion of respondents with five-generation families was so small that we included them in the 4+-generation category.16 Across countries, the ratio between families with more or less complex vertical structures follows a different pattern. In Bulgaria, France, and the Russian Federation, four-generation families were found to outnumber two-generation families. However, the opposite was true for Estonia, Georgia, Romania, and Germany. At the extremes, four-generation families in Bulgaria were more than one-third more prevalent than two-generation families, while in Germany, two-generation families were nearly twice as common as those with four.
The least common constellation was the one-generation family; individuals in such families are often called solos (Hagestad 2000). Solo individuals lack intergenerational ties, but they are not necessarily without family: an overwhelming majority have siblings and/or a partner. The incidence of one-generation families was found to be highest in Germany, where this structure accounted for 7.8% of the population aged 20– 79; one-fifth of solo individuals lacked family ties along the horizontal axis as well, with neither siblings nor partner. The proportion of individuals in one-generation families was also relatively high in Romania (6%), which corresponds to the high levels of childlessness among the older population of this country (Dykstra 2009). In Estonia, France, and Georgia, a lack of intergenerational ties was half as common as it was in Germany (3.7%–3.9%). The lowest proportions of solo individuals were found in Russia (2.7%) and Bulgaria (1.8%).
16 Families with five generations are reported in the GGS. They occur among a small number of middle-aged
Figure 7: Number of family generations
Bulgaria Estonia France Georgia Germany Netherlands Romania Russia
0 20 40 60 80
100 % population 20-79
0,0 0,5 1,0 1,5 2,0 2,5 3,0 3,5 mean number of generations
4+ 3 2 1
mean
Source: GGS database, authors’ calculations
Despite the noticeable differences described above, the mean number of generations varied within a narrow range of 2.9 to 3.0 for most of the countries. This suggests that divergent demographic regimes can produce strikingly similar outcomes in terms of the height of the family constellation. Among the countries included in the analysis, this is best exemplified by comparing France with the Russian Federation. The onset of demographic modernisation occurred nearly a century apart in these countries (Chesnais 1992; Vishnevsky 2006); they represent the demographic extremes that co-exist in contemporary Europe. In Russia, the stagnation in mortality that dates back to the 1960s grew into an acute health crisis during the societal transition of the 1990s (Vallin and Meslé 2005). Male life expectancy fell to 58–59 years, and only in recent years have Russian mortality rates shown signs of recovery.17 In France, on the other hand, life expectancy has made persistent gains, and ranks near the top of the EU countries for men as well as for women (78.0 and 85.0 years, 2009). The differences in fertility are also pronounced. France has one of the highest fertility levels in contemporary Europe, relatively close to replacement (with a period TFR of 2.00 in 2009). In the Russian
17 In 2009, life expectancy at birth was 62.8 years for males and 74.7 years for females in the Russian
Federation, the period fertility rates have been at the 1.2–1.5 level since the mid-1990s, and estimates of completed cohort fertility do not exceed 1.6 in the generations born since the mid-1960s (Zakharov 2008).
Notwithstanding the disparity in demographic regimes, the two countries are very similar in terms of the number of generations in the family. The differences in the incidence of families with varying numbers of generations do not exceed 1–2 percentage points, and the mean number of family generations is nearly identical (2.97 for both countries). The distinction between the generations above and below the anchor, not shown in detail, reveals the mechanism underlying this unexpected similarity. In France, where the life expectancy is higher, each age group of adults tends to have more ascending generations (parents and grandparents). In Russia, however, where childbearing has occurred earlier, adults have more descending generations. With regard to vertical balance, this indicates that intergenerational family structures in France exhibit greater “top-heaviness” relative to the Russian Federation.
Further differences in intergenerational family constellations relate to the times at which particular family relationships are generated or lost. As shown in the previous sections, there is considerable variation across countries in the ages at which ties with descending kin begin and those with ascending kin end. In the countries with a smaller age gap between parents and children, individuals move from the position of the youngest to the middle generation at a comparatively young age. According to our analysis, this also holds true for the second generational shift, in which individuals become the oldest generation in their families following the loss of their parents. In the countries with a shorter generational distance, the loss of parents tends to occur at a younger age. It follows that the family relationships of individuals in the same age groups differ considerably across countries, and that they also interact with age-related transitions in other areas of life (education, work, retirement, health, etc.) However, an examination of these interactions is beyond the scope of this article.
From another perspective, the generations surrounding the reference individual can be divided into adjacent (children and parents) and non-adjacent (grandchildren, grandparents, and great-grandchildren). The latter constitute multigenerational ties that have become increasingly common in the course of demographic modernisation (Bengtson 2001). The last section of Table 5 in the appendix shows the relative number of adults in families with multigenerational ties. 18 While the results confirmed a relatively high prevalence of multigenerational family ties in contemporary Europe, they also revealed a noticeable variation across countries. Interestingly, the country with the highest prevalence of 4+-generation families is not at the top of the list. According to our analysis, multigenerational family ties were most common in Estonia (60%), followed by Bulgaria (56%), France, and the Russian Federation (both 55%).19 At the other end of the spectrum, Germany exhibited the lowest prevalence, with only 42% of adults aged 20–79 having family ties across more than one generation. Multigenerational ties were shown to be more common in the younger and older segments of the adult population. The prevalence of the multigenerational family appeared to be lowest among the middle-aged.
Our results also indicated that, under the contemporary demographic regime, generational gaps in family structures are relatively uncommon. In no country did the proportion of adults aged 20–79 who are in multigenerational families, but lack family members in adjacent generations, exceed 1%. Such families are typical of older age groups in which individuals have lost their children, but have grandchildren. In the countries with higher levels of mortality, the incidence of gaps in the generational structure was more common, reaching 7%–11% among 75–79-year-olds.
5. Summary and discussion of the findings
The subject of this article is intergenerational family constellations in contemporary Europe, based on evidence from the first wave of the Generations and Gender Surveys. The authors examined the availability of biological kin in generations above and below the reference individuals, independent of co-residence in the same household unit. The results indicate that, in the countries included in the analysis, a majority of the adult population are members of three-generation families. A smaller proportion – less than
18 Families with multigenerational ties are defined as those with at least one family member in a generation
non-adjacent to the reference individual; i.e., families with grandchildren, grandparents, great-grandchildren, or great-grandparents.
19 The very high prevalence of multigenerational family ties in Estonia is partially a function of the age
one-fifth of the 20–79-year-olds in most countries – were found to belong to two- and four-generation families. Up to 8% were solo individuals, with no ascending or descending kin. These results corroborate the overall pattern of the findings from various studies of individual countries (Soldo 1996; Pennec 1997; Grundy, Murphy, and Shelton 1999; Knipsheer et al. 2000; Dykstra and Komter 2006).
The comparative perspective of the GGS revealed that there is considerable variation in intergenerational constellations. In the previous sections, we have shown how developments in the underlying demographic processes come together in families and affect individual lives. Our results demonstrate that the influences of longevity and childbearing patterns may counteract each other with regard to the height of intergenerational constellations and the prevalence of multigenerational families. Our results are in line with Matthews’s and Sun’s (2006) findings for the United States, which indicated that delayed childbearing may completely negate the gains from increased longevity. The analysis also showed that the persistence of relatively early childbearing may lead to a high prevalence of multigenerational ties, even at levels of life expectancy that are considered to be very low by modern standards. A salient finding is that the vertical height of family constellations has become, to a perceptible extent, a matter of degree. The average number of family generations, and/or the prevalence of multigenerational family relationships, depends on which of these competing influences prevails in a particular country.
Our results support the view that, in contemporary settings, the timing of demographic events plays an increasingly important role. In particular, the significance of the timing of childbearing is supported by the cumulation of its influence across several successive generations. Previous research has revealed the presence of this “multiplier effect” with regard to specific subgroups of the population or birth cohorts Wachter 1997; Hagestad 2000; Murphy, Martikainen, and Pennec 2006). In this article, we have described the “multiplier effect” at the national level. The availability of grandchildren and great-grandchildren displays a more pronounced variation across countries than the availability of immediate descending kin, which produces a polarisation of family patterns between countries with relatively early and late entry into parenthood. The trend towards a greater incidence of multigenerational ties has clearly increased the importance of the multiplier effect.
results also indicate that the role of underlying demographic processes varies according to the direction of intergenerational ties: childbearing patterns exert stronger influence on the availability of descending family members, while the effects of longevity are reflected in ascending ties.
The limitations of this study relate to the analytical approach imposed by the nature of the kin data collected in the GGS. The study focused on the vertical dimension of intergenerational constellations and biological ties. The rise in divorce in recent decades has increased the complexity of family networks and the importance of step ties (Wachter 1997; Dykstra and Komter 2006). The findings reported in the article describe differences in family structures across countries in the mid-2000s. The evidence does not provide a direct account of the changes in intergenerational constellations as they unfold. Nonetheless, the link between observed family patterns and past trends in the underlying demographic processes allows us to trace the plausible development of intergenerational families in the major regions of Europe.
It appears that, until the mid-1960s, changes in mortality and fertility made mutually reinforcing contributions to the vertical extension of family structures. In the countries west of the Hajnal line, the post-war decades witnessed a pronounced shift toward younger childbearing, and, hence, a shrinking of the age gap between children and adults. A concurrent decrease in childlessness and a rise in life expectancy further added to the incidence of intergenerational ties. In the areas east of the Hajnal line, a decline in the age distance between generations was primarily driven by a reduction in higher order births, but here as well, demographic developments resulted in a growing prevalence of multigenerational ties.
In the ensuing decades, the trends started to diverge along the boundaries that separated the state socialist regimes from the rest of Europe. West of the Iron Curtain, family and fertility patterns were increasingly moulded by the Second Demographic Transition (Lesthaeghe and van de Kaa 1986; van de Kaa 1987). With regard to the height of family constellations, the shift towards later childbearing and the rise in childlessness began to cancel out the results of the improvement in life expectancy. In most of Eastern Europe, the “postponement transition” did not gain momentum until the societal change of the 1990s (Sobotka 2004). The dissimilarities between mortality patterns also became more pronounced in the 1970s and 1980s, as the life expectancy began to stagnate in the countries of the Eastern bloc. However, the divergence in mortality and fertility patterns does not seem to have resulted in a major difference in the number of family generations, since the losses in life expectancy could be recouped by the shorter age gap between generations and lower rates of childlessness in Eastern Europe.
by the GGS are subject to further transformation. In light of the results reported in this article, the course of future changes should not be taken for granted. The continued rise in life expectancy will extend the shared survival of generations, and its influence will sooner or later override the opposing effect of delayed childbearing on adjacent generations. However, the outcome may not be self-evident with respect to multigenerational ties, in which the consequences of such postponement converge across three or four generations. It therefore seems reasonable to question whether the growth in the number of family generations and the prevalence of multigenerational ties is bound to continue in a straight line, independent of demographic scenarios and regimes.
The results presented in this article indicate that the answer may not be unequivocally affirmative, especially for a country like Germany, where the number of co-existing family generations was found to be appreciably lower than in the other countries included in the analysis. Distinguishing between ascending and descending family generations revealed that the country’s outlier position stems from the very low fertility and high levels of childlessness that have prevailed in the country since the mid-1970s. Although Germany ranks relatively high in terms of life expectancy, longevity has not counterbalanced the influence of persistent low fertility. In our view, this raises the possibility that, in certain demographic circumstances, the trend towards the further vertical extension of the family may come to a halt, or even be reversed. Nevertheless, such a development would not invalidate the concept of verticalisation and its associated growth in the height of family constellations. The latter appears to be an inseparable aspect of demographic modernisation, but in the stages following and preceding a major regime change, there is room for variation, including a reversal of the trend.20
The fertility patterns in contemporary Europe, which have been described as “diverse, delayed and below replacement” (Frejka and Sobotka 2008), suggest that more countries may gravitate towards the pattern exemplified by Germany. This hypothesis applies to other German-speaking countries and to several nations of southern Europe (Tomassini and Wolf 2000). Although fertility levels are no higher in many countries of Eastern Europe, it is likely that lower levels of childlessness are preventing them from following the same pattern. More conclusive answers about the transformation of family constellations must be sought from future surveys, which underscores the importance of safeguarding the continuity of internationally coordinated data collection on family constellations. But regardless of the outcome, the
20 For the pre-modern period, this phenomenon has been noted in 16th-18th century England by Smith and
structure of the family will continue to exert a significant influence on the lives of individuals linked by ties between interdependent generations.
6. Acknowledgements
References
Atchley, R.C. (1975). The life course, age grading, and age-linked demands for decision-making. In: Datan, N., and Ginsberg, L.H. (eds.). Life-span developmental psychology. New York: Academic Press: 261–278.
Avery, R.B. and Rendall, M.S. (2002). Lifetime inheritances of three generations of whites and blacks. American Journal of Sociology 107(5): 1300–1346.
doi:10.1086/344840.
Barranti, C.C.R. (1985). Grandparent-grandchild relationship: Family resource in an era of voluntary bonds. Family Relations 34(3): 343–352. doi:10.2307/583572.
Bengtson, V.L. (2001). Beyond the nuclear family: The increasing importance of multigenerational bonds. Journal of Marriage and the Family 63(1): 1–16.
doi:10.1111/j.1741-3737.2001.00001.x.
Bengtson, V.L., Rosenthal, C.J., and Burton, L.M. (1990). Families and ageing: Diversity and heterogeneity. In: Binstock, R.H., and George, L.K. (eds.).
Handbook of aging and the social sciences, 3rd ed. New York: Academic Press: 263–287.
Bengtson, V.L., Rosenthal, C.J., and Burton, L.M. (1995). Paradoxes of families and ageing. In: Binstock, R.H., and George, L.K. (eds.). Handbook of aging and the social sciences, 4th ed. San Diego: Academic Press: 253–282.
Bongaarts, J., Burch, T., and Wachter, K. (eds.). (1987). Family demography. Methods and their applications. Oxford: Clarendon Press.
Chesnais, J.-C. (1992). The demographic transition. Oxford: Clarendon Press.
Dykstra, P.A. (2009). Childless old age. In: Uhlenberg, P. (ed.). International Handbook on Population Aging. Springer: 671–690.
Dykstra, P.A. and Komter, A.E. (2006). Structural characteristics of Dutch kin networks. In: Dykstra, P.A., Kalmijn, M., Knijn, T.C.M., Komter, A.E., Liefbroer, A.C., and Mulder, C.H. (eds.). Family solidarity in the Netherlands. Amsterdam: Dutch University Press: 21–42.
Eurostat (2010). Eurostat database. [electronic resource] http://epp.eurostat.ec.europa. eu/portal/page/portal/eurostat/home/.
intergenerational relationships: Effects of societal change. New York: Springer: 1–28.
Frejka, T. and Sardon, J.-P. (eds.). (2004) Childbearing trends and prospects in low fertility countries: A cohort analysis. Dordrecht: Kluwer Academic Publishers. Frejka, T. and Sobotka, T. (2008). Overview Chapter 1: Fertility in Europe: Diverse,
delayed and below replacement. Demographic Research 19(3): 15–46.
doi:10.4054/DemRes.2008.19.3.
Goldman, N. (1986). Effects of mortality on kinship. Consequences of mortality trends and differentials. New York: United Nations: 89–87.
Goldstein, J.R., Sobotka, T., and Jasilioniene, A. (2009). The end of "lowest-low"
fertility? Population and Development Review 35(4): 663–699.
doi:10.1111/j.1728-4457.2009.00304.x.
Grundy, E., Murhpy, M., and Shelton, N. (1999). Looking beyond the household: Intergenerational perspectives on living kin and contacts with kin in Great Britain. Population Trends 97(3): 19–27.
Hagestad, G.O. (1988). Demographic change and the life course: Some emerging trends in the family realm. Family Relations 37(4): 405–419. doi:10.2307/584111.
Hagestad, G.O. (2000). Adult intergenerational relationships. Generations and Gender programme. Exploring future research and data collection options. New York and Geneva: United Nations: 125–143.
Herlofson, K. and Hagestad, G.O. (2011). Moving from macro to micro: Population and family structures in ageing societies. Demographic Research (forthcoming). Kirk, D. (1996). Demographic transition theory. Population Studies 50(3): 361–387.
doi:10.1080/0032472031000149536.
Knipscheer, K., Dykstra, P., Utasi, A., and Cxeh-Szombathy, L. (2000). Aging and the family. In: Beets, G. and Miltenyi, K. (eds.). Population aging in Hungary and the Netherlands. Amsterdam: Thela Thesis: 181–199.
Kohler, H.-P., Billari, F., and Ortega, J. (2002). The emergence of lowest-low fertility
in Europe. Population and Development Review 28(4): 641-680.
doi:10.1111/j.1728-4457.2002.00641.x
Le Bras, H. (1973). Parents, grands-parents, bisaïeux. Population 28(1): 9–38.
Lesthaeghe, R. and van de Kaa, D. (1986). Twee demografische transities? In: Lesthaeghe, R., and van de Kaa, D. (eds.). Bevolking: Groei en Krimp. Deventer: Van Loghum-Slaterus: 9–24.
Lesthaeghe, R. (2010). The unfolding story of the Second Demographic Transition.
Population and Development Review 36(2): 211–251. doi:10.1111/j.1728-4457.2010.00328.x.
Martin, L. and Culter, S. (1983). Mortality decline and Japanese family structure.
Population and Development Review 9(4): 633–649. doi:10.2307/1973543.
Matthews, S.H. and Sun, R. (2006). Incidence of four-geneneration family lineages: Is timing of fertility or mortality a better explanation? The Journals of Gerontology Series B: Psychological Sciences and Social Sciences 61(2): S99–S106.
Murphy, M. and Grundy, E. (2003). Mothers with living children and children with living mothers: The role of fertility and mortality in the period 1911–50.
Population Trends 112: 36–45.
Murphy, M., Martikainen, P., and Pennec, S. (2006). Demographic change and the supply of potential family supporters in Britain, Finland and France in the period 1911–2050. European Journal of Population 22(3): 219–240. doi:10.1007/ s10680-006-9003-8.
Notestein, F. (1953). The economics of population and food supplies: Economic problems of population change. In: Proceedings of the Eigth International Conference of Agricultural Economists. Oxford University Press: 13–31.
Oeppen, J., and Vaupel, J.W. (2002). Broken limits to life expectancy. Science 296(10): 1029–1031. doi:10.1126/science.1069675.
Ogg, J. and Renaut, S. (2006). The support of parents in old age by those born during 1945–1954: A European perspective. Ageing and Society 26(5): 723–743.
doi:10.1017/S0144686X06004922.
Pennec, S. (1997). Four-generation families in France. Population - An English Selection 9: 75–100.
Rowland, D.T. (2007). Historical trends in childlessness. Journal of Family Issues
28(10): 1311–1377. doi:10.1177/0192513X07303823.
Schoeni, R.F. (1998). Reassessing the decline in parent-child old-age coresidence during the twentieth century. Demography 35(3): 307–313. doi:10.2307/ 3004038.
Smith, J.E. and Oeppen, J. (1993). Estimating numbers of kin in historical England using demographic microsimulation. In: Reher, D.S., and Schofield, R. (eds.).
Old and new methods in historical demography. Oxford: Clarendon Press:280– 317.
Sobotka, T. (2004). Is lowest-low fertility in Europe explained by the postponement of childbearing? Population and Development Review 30(2): 195–220.
doi:10.1111/j.1728-4457.2004.010_1.x.
Soldo, B.J. (1996). Cross pressures on middle-aged adults: A broader view. Journal of Gerontology 51B(6): 271–273. doi:10.1093/geronb/51B.6.S271.
Sprey, J. and Matthews, S.H. (1982). Contemporary grandparenthood: A systemic transition. Annals of the American Academy of Political and Social Sciences
464(1): 91–103. doi:10.1177/0002716282464001009.
Tomassini, C. and Wolf, D.A. (2000). Shrinking kin networks in Italy due to sustained low fertility. European Journal of Population 16(2): 353–372. doi:10.1023/ A:1006408331594.
Treas, J. and Bengtson, V.L. (1982). The demography of mid- and late-life transitions.
Annals of the American Academy of Political and Social Science 464(1): 11–21.
doi:10.1177/0002716282464001002.
Uhlenberg, P. (1993). Demographic change and kin relationships in later life. Annual Review of Gerontology and Geriatrics 13: 219–238.
Uhlenberg, P. and Kirby, J.B. (1998). Grandparenthood over time: Historical and demographic trends. In: Szinovacz, M.E. (ed). Handbook on Grandparenthood.
Westport: Greenwood Press: 23–39.
Uhlenberg, P. (1996). Mortality decline in the twentieth century and the supply of kin over the life course. The Gerontologist 36(5): 681–685. doi:10.1093/geront/ 36.5.681.
Vallin, J. and Meslé, F. (2005). Convergences and divergences: An analytical framework for national and sub-national trends in life expectancy. Genus
LXI(1): 83–124.
Vallin, J. and Meslé, F. (2009). The segmented trend line of highest life expectancies.
Population and Development Review 35(1): 159–188. doi:10.1111/j.1728-4457.2009.00264.x.
Van de Kaa, D.J. (1987). Europe’s second demographic transition. Population Bulletin
42(1). Washington: Population Reference Bureau Inc.
Van de Kaa, D.J. (2004). Is the second demographic transition a useful research concept? Questions and answers. Vienna Yearbook of Population Research
(2004): 4–10. doi:10.1553/populationyearbook2004s4.
Van Imhoff, E. and Post, W. (1998). Microsimulation methods for population projection. Population - An English Selection 10(1): 97–138.
Vikat, A., Spéder, Z., Beets, G., Billari, F.C., Bühler, C., Désesquelles, A., Fokkema, T., Hoem, J.M., MacDonald, A., Neyer,G., Pailhé, A., Pinnelli, A., and Solaz, A. (2007). Generations and Gender Survey (GGS): Towards a better understanding of relationships and processes in the life course. Demographic Research 17(14): 389–440. doi:10.4054/DemRes.2007.17.14.
Vishnevsky, A. (ed.) (2006). Demografitšeskaja modernizatsija Rossii 1900–2000. Moscow: Novoe Izdatelstvo.
Wachter, K.W. (1997). Kinship resources for the elderly. Philosphical Transactions of the Royal Society of London. Series B Biological Sciences 352(1363): 1811– 1817. doi:10.1098/rstb.1997.0166.
Watkins, S.C., Menken, J.A., and Bongaarts, J. (1987). Demographic foundations of family change. American Sociological Review 52(3): 346–358.
Wrigley, E.A. (1977). Reflections of the history of the family. Daedalus 106: 71–85. Zakharov, S. (2008). Russian Federation: From the first to second demographic
Appendix
Table 1: Main characteristics of GGS datasets included in the analysis Survey year Sample size Age range
Bulgaria 2004 12858 18–79
Estonia 2004–05 7855 21–80
France 2005 10079 18–79
Georgia 2006 10000 18–79
Germany 2005 10017 18–79
Hungary 2004–05 13540 21–78
Netherlands 2002–04 8161 18–79
Romania 2005 11986 18–76
Russia 2004 11261 18–79
Source: GGS database
Table 2: Selected demographic characteristics of the countries included in the analysis, 1950–2005
Bulgaria Estonia France Georgia Germany Hungary Netherlands Romania Russia
Total fertility rate
1950–54 2.48 2.06 2.73 3.00 2.16 2.73 3.06 2.87 2.85 1955–59 2.27 1.99 2.71 2.91 2.30 2.21 3.10 2.62 2.82 1960–64 2.18 1.94 2.85 2.98 2.49 1.82 3.17 2.04 2.55 1965–69 2.15 2.02 2.61 2.61 2.32 1.98 2.80 2.96 2.02 1970–74 2.17 2.15 2.31 2.60 1.64 2.09 2.06 2.62 2.03 1975–79 2.17 2.06 1.86 2.39 1.52 2.12 1.60 2.53 1.94 1980–84 2.01 2.09 1.87 2.27 1.46 1.81 1.52 2.25 2.04 1985–89 1.92 2.20 1.81 2.26 1.43 1.82 1.56 2.28 2.12 1990–94 1.51 1.63 1.71 2.05 1.31 1.73 1.58 1.50 1.55 1995–99 1.22 1.33 1.76 1.72 1.34 1.38 1.60 1.35 1.25 2000–04 1.25 1.39 1.88 1.58 1.35 1.30 1.73 1.29 1.30
Life expectancy at birth, males
Table 2: (Continued)
Bulgaria Estonia France Georgia Germany Hungary Netherlands Romania Russia
Life expectancy at birth, females
1950–54 66.1 68.3 69.9 64.4 69.6 65.8 73.4 62.8 67.3 1955–59 68.8 71.4 72.4 66.4 71.5 69.1 74.7 65.9 69.9 1960–64 72.1 73.4 74.1 68.3 72.9 71.0 75.8 68.8 72.8 1965–69 73.1 74.2 75.1 70.3 73.6 71.9 76.4 67.9 73.4 1970–74 73.4 74.7 76.2 71.8 73.8 72.4 77.0 71.5 73.6 1975–79 73.6 74.4 77.6 73.2 75.5 72.8 78.6 72.0 73.1 1980–84 74.2 74.3 78.8 73.2 76.8 73.0 79.5 72.6 72.7 1985–89 74.7 74.8 80.1 74.0 78.2 73.6 79.9 72.7 73.6 1990–94 74.7 74.0 81.4 74.3 79.1 73.9 80.2 73.2 72.5 1995–99 74.6 75.3 82.3 74.7 80.2 75.3 80.5 73.6 72.2 2000–04 75.6 76.9 83.1 75.0 81.4 76.6 81.0 75.1 71.8
Source: United Nations Population Division database
Table 3: Availability of different types of biological kin, % All 20–79
(observed)
All 20–79
(age-adjusted) 20–39 40–59 60–79 Children
Bulgaria 76.3 78.3 59.8 90.6 91.0
Estonia 78.4 77.5 59.0 90.9 87.4
France 73.1 71.9 50.7 86.3 87.1
Georgia 77.4 77.3 57.8 90.0 89.1
Germany 66.8 64.8 46.5 79.3 76.9
Hungary 73.2 72.5 48.7 88.3 87.3
Netherlands 69.2 65.5 47.9 78.7 86.3
Romania 78.1 73.8 63.2 86.7 83.2
Russia 82.1 82.1 65.1 93.7 89.1
Parent(s)
Bulgaria 69.8 65.3 97.4 69.0 8.3
Estonia 59.0 62.2 97.0 61.3 5.3
France 68.9 70.1 97.9 74.0 16.3
Georgia 62.7 62.6 95.9 64.0 5.6
Germany 63.8 66.7 96.9 71.5 10.3
Hungary 66.4 67.9 97.1 69.9 14.0
Netherlands 65.2 65.4 97.2 67.0 9.3
Romania 55.0 62.8 95.1 60.1 5.5
Table 3: (Continued) All 20–79 (observed)
All 20–79
(age-adjusted) 20–39 40–59 60–79 Grandchildren
Bulgaria 28.7 33.7 0.6 33.5 85.9
Estonia 36.0 32.8 0.6 37.0 81.0
France 28.8 27.6 0.1 26.6 77.0
Georgia 32.8 32.7 0.4 35.6 81.1
Germany 34.3 27.1 0.2 21.9 78.1
Hungary 32.6 30.5 0.3 33.2 80.1
Romania 34.6 28.1 0.3 31.5 75.6
Russia 36.5 37.2 0.5 43.0 86.3
Grandparents
Bulgaria 27.6 23.7 53.8 6.9 1.0
Estonia 18.1 19.1 46.1 2.7 0.0
France 25.3 26.7 60.7 6.6 0.0
Georgia 18.4 18.6 45.2 2.7 0.0
Germany 17.8 20.2 44.4 4.8 0.2
Hungary na na na na na
Netherlands 17.0 20.7 43.5 2.8 0.1
Romania 15.2 20.7 42.5 3.9 0.1
Russia 17.6 17.6 44.4 2.7 0.1
Great-grandchildren
Bulgaria 3.5 4.3 ... 0.6 16.4
Estonia na na ... na na
France 2.5 2.5 ... 0.1 10.3
Georgia 4.3 4.1 ... 0.3 17.9
Germany 1.9 1.7 ... 0.0 6.9
Hungary 3.4 3.5 ... 0.2 13.6
Netherlands na na ... na Na
Romania 3.7 3.4 ... 0.1 15.0
Russia 4.6 5.2 ... 0.0 21.6