Vol.8 (2018) No. 4-2
ISSN: 2088-5334
Breast Tissue Classification via Interval Type 2 Fuzzy Logic Based
Rough Set
Wan Noor Aziezan Baharuddin
1, Siti Norul Huda Sheikh Abdullah
2, Shahnorbanun Sahran
1, Ashwaq
Qasem
1, Rizuana Iqbal Hussain
3, Azizi bin Abdullah
11
Pattern Recognition Research Group,Centre of Artificial Intelligence, Faculty Technology and Information Science, UniversitiKebagsaan Malaysia, 43650 Bangi, Selangor ,Malaysia.
E-mail: [email protected] , [email protected] , [email protected] and [email protected]
2
Center for Cyber Security, Faculty Technology and Information Science, UniversitiKebagsaan Malaysia, 43650 Bangi, Selangor ,Malaysia.
E-mail: [email protected]
3
Department of Radiology, UniversitiKebangsaan Malaysia Medical Centre, 56000, Cheras, Kuala Lumpur, Malaysia. E-mail:[email protected]
Abstract— BIRADS is a Breast Imaging, Reporting and Data System. A tool to standardize mammogram reports and minimizes ambiguity during mammogram image evaluation. Classification of BIRADS is one of the most challenging tasks to radiologist. An apt treatment can be administered to the patient by the oncologist upon acquiring sufficient information at BIRADS stage. This study aspired to build a model, which classifies BIRADS using mammograms images and reports. Through the implementation of type-2 fuzzy logic as classifier, an automatically generated rules will be applied to the model. To evaluate the proposed model, accuracy, specificity and sensitivity of the modal will be calculated and compared vis-à-vis rules given by the experts. The study encompasses a number of steps beginning with collection of the data from Radiology Department, Hospital of National University of Malaysia (UKM). The data was initially processed to remove noise and gaps. Then, an algorithm developed by selecting type-2 fuzzy logic using Mamdani model. Three types of membership functions were employed in the study. Among the rules that used by the model were obtained from experts as well as generated automatically by the system using rough set theory. Finally, the model was tested and trained to get the best result. The study shows that triangular membership function based on rough set rules obtains 89% whereas expert rules achieve 78% of accuracy rates. The sensitivity using expert rules is 98.24% whereas rough set rules obtained 93.94%. Specificity for using expert rules and rough set rules are 73.33%, 84.34% consecutively. Conclusion: Based on statistical analysis, the model which employed rules generated automatically by rough set theory fared better in comparison to the model using rules given by the experts.
Keywords— breast cancer; classification; fuzzy logic; mammogram; rough set.
I. INTRODUCTION
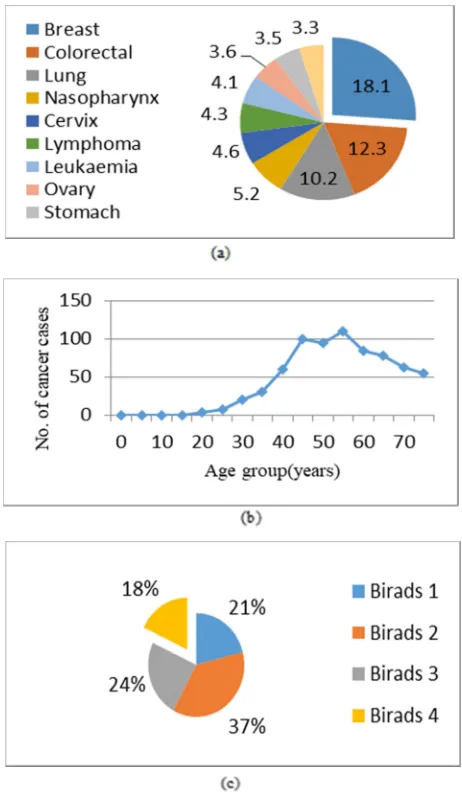
Cancer is among the major cause of fatality in Malaysia. Around 18, 219 new cancer cases were diagnosed in 2007 based on National Cancer Registry [1]. Most of these cases (55.4%) were female. In Malaysia, Breast cancer is the most occurring cancers among population in 2007. Fig.1(a) shows details of the most ten common cancers in Malaysia in 2007.
Cancer occurred when a cell in human body divides uncontrollably creating mass, calcification or distortion known as tumors. Malignant tumors in breast cell is known as breast cancer [2]. In Malaysia, this type of disease is predominant among women between age 20 to 75 for every 100, 000 populations (Fig. 1(b)). Most of them were diagnosed at stage II (Fig. 1(c)).
All Malaysian especially women should be well educated on the issue of breast cancer. Berita Harian, a renowned newspaper in Malaysia reported that over 700,000 women in Malaysia had been afflicted by this disease [3]. In addition to that, it is also reported that mammogram is one of the best screening method to retard the spread of said cancer to other part of human body by way of early detection. Timely diagnosis of the cancer will translate to more effective treatment to be administered on the patients [4]. This tool utilizes X-Ray system to diagnose the disease [5].
display screen or because underexposure of the film. To overcome this problem, Computer Aid Detection (CAD) is using digital mammography, which can improve image storage and transmission by taking electronic image of breast and save in computer.
Screening mammogram, which is used for early detection of breast cancer, will improve the treatment given and reduce mortality. However, human intervention in screening and identifying process will certainly incur a significant error and thusly, an erroneous diagnosis. Kerlikowske et. al.[6] claimed that about 10% to 30% error occurs in determination of cancer performed by typical radiologist.
In the recent years, CAD has been used as a second reader for radiologist. This made the radiologist decision making of abnormalities detection of medical image faster, more sensitive and less cost [7]. The common steps of CAD system are image acquisition image, prepressing if needed segmentation. Evaluation method maybe applied to test the system.
In breast cancer, mammogram, which is the input image of CAD system, will be reviewed by radiologist after CAD segmented it to identify the suspicious region [8]. The importance of analysing mammogram using CAD to detect breast cancer in early stage has been proven by earlier researchers [8,9].
Machine learning has ability in handling the different data problem like noise, complexity and big. For those reasons, machine learning is using in CAD system to improve it in dealing with mammogram data. Thus, it is highly useful in cancer detection because it can learn from past examples [9,10,11]. Breast cancer medical data is not only the mammogram but it also large information about patients describe their medical condition. Moreover, it also has incomplete data such that to derive a conclusion from it is still inadequate.
To handle uncertainties machine learning like Type-2 Fuzzy Logic, and rough set theory are used to classify BIRADS [12,13,14]. These two methods are selected because of their ability to handle uncertainty and have been used to classify BIRADS based on extracted features from mammogram only [15]. Some important information and sign from the data are extracted. The different signs of breast cancer which can be seen in mammogram are mass, calcification, and architectural distortion [2]. The result from mammogram reports will determine the severity of patients.
This paper presents a type-2 fuzzy logic classifier model integrated with an automatically generated rules by rough set to classify BIRADS using mammogram images and reports. The evaluation will be done by using accuracy, specificity and sensitivity of the modal compared with the rules provided by the experts.
II. MATERIAL AND METHOD
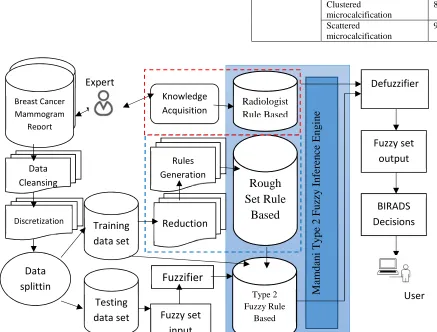
The proposed method was given in Fig. 2.
A. Data collection:
The study commenced with collection of patient data from UKM Medical Center. The data collection process is done in Radiology department of hospital UKM. Patient with BIRADS 1,2,3,4 and 5 was considered in this study. In more details, 100 mammogram images with their reports was collected. In general, data was incomplete and rife with noise and uncertainty for BIRADS classification of the patients.
Fig. 1 (a) Percentage of cancer in Malaysia, (b) Female Breast. Age-specific Cancer Incidence per 100,000 populations, Malaysia in year 2007 and (c) Female breast, stage at diagnosis, Malaysia in year 2007
Data
collection processing
Pre-Modelling of Fuzzy Type2
Generate Automatic rules using Rough Set Inferencing
All of the data was crucial to be pre-processed as shown in Fig.3 [16,17]. The actual number of attributes were 13 consisting of Density, Mass, Calcification, Others, Impression (normal, benign, mostly likely benign, suspicious of malignancy, malignant), recommendation (follow-up mammogram, biopsy and others), and results (BIRADS class either 1 to 5).
While developing a good model, a clean data had been allocated for training and testing dataset. The first step was determining class attribute for the model using training datasets followed by the utilization of the model to classify testing data in order to obtain the most accurate model.
B. Pre-processing:
The pre-processing steps started with compensating incomplete data using mean values. To avoid missing data, discretization was employed and thusly, to define the data range. Data cleaning is needed to be cleaned thoroughly so as to enhance the model.
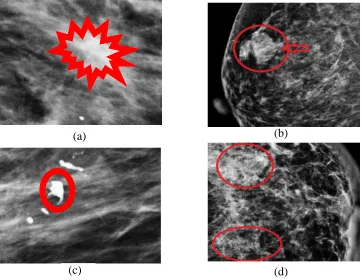
Attribute selection that will be utilized in the model has been executed as shown in Fig.4. As shown in Table 1, expert notates the attribute based on its degree of seriousness. Examples of mammogram images for attribute selected were given in Fig.5.
TABLE 1
LINGUISTIC VARIABLE FOR FUZZY LOGIC MODEL. Linguistic
Variable
Linguistic Value Notation
Distortion Has distortion 1 No distortion 0 Mass No density mass 0 Low density mass 1 Rounded density mass 2 Faint density lesion 3 Lobulated mass 4 Spiculate mass 5 High density mass 6 Calcification No Cluster calcification 0 Vascular Calcification 1 Macrocalcification 2 Scattered
Macrocalcification
3
Popcorn
macrocalcification
4
Bilateral
macrocalcification
5
Coarse calcification 6 Microcalcification 7 Clustered
microcalcification
8
Scattered microcalcification
9
Rough
Set Rule
Based
Defuzzifier
Breast Cancer Mammogram
Report
Knowledge Acquisition
Fuzzy set
output
DataCleansing
Rules Generation
Training
data set
BIRADS
Decisions
Expert
Radiologist Rule Based
Reduction
M
am
da
n
i T
ype
2 F
uz
zy I
n
fe
re
n
ce
E
ng
ine
Discretization
Data
splittin
Fuzzifier
Type 2 Fuzzy Rule
Based
Testing
data set
Fuzzy set
input
User
C. Development of Proposed Type-2 Fuzzy Logic Model To classify BIRADS for breast cancer, type-2 fuzzy logic had been selected. This fuzzy rule based system was also known as Mamdani. According to Caramihai et al.[18], Fuzzy logic model can be developed based on three steps. Firstly, was the determination of input and output variables that described breast cancer tissue problem and choose interval for the variable. The second step was defining linguistic set values of breast cancer tissue along with its membership function that could be mapped onto fuzzy variable range and finally was constructing rule sets using radiologist rules and auto-generated rules using rough set in parallel by associating their input and output.
In this study, about five assumptions were drawn to develop type-2 fuzzy logic model for mammogram images:
1. All fuzzy set were interval type-2 fuzzy set (distortion, masses, Calcification).
2. Antecedence and consequence were changed according to its membership function.
3. Testing input on membership functions (Gaussian, Triangular and Trapezoidal methods).
4. Operation of fuzzy were t-norm and product implication methods.
5. Applying central method (type reduction) and average method (defuzzification).
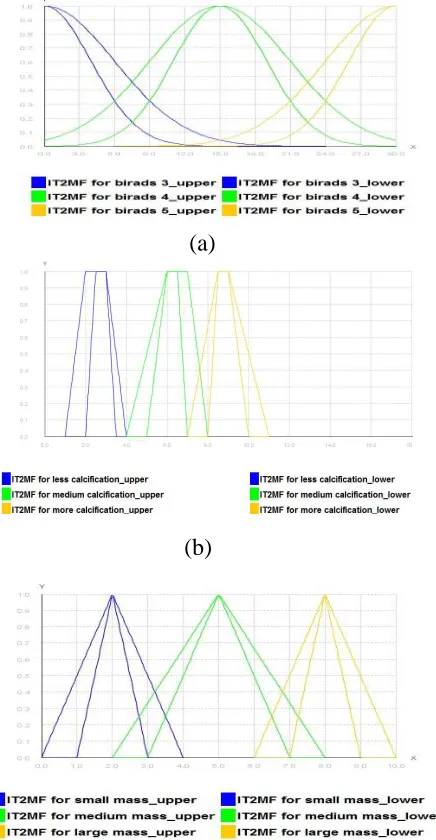
An Interval type-2 fuzzy logic had upper and lower membership functions. Three types of membership function were selected including trapezoidal, triangular and Gaussian. The Gaussian membership function has regular standard deviation ( and mean value between , . The mean value gains from Eq.1
exp ; , (1)
Upper membership function was defined by:
, ; 1 ! !
, ; " (2) Lower membership function was defined by:
#
, ; ! $% &
, ; " $% &
(3)
where,
, , ∝ exp .
The triangular membership function uses three parameters(), *, +,:
- Triangular : ), *, +
⎩ ⎪ ⎪ ⎨ ⎪ ⎪
⎧ 0, ! ), <
= < ) ! ! *
>
> =, * ! ! +
0 + ! .
(4)
Parameter (), *, +, (with ) * + ) were used to determine the coordinate for 3 cornered in triangular membership function.
(a)
(b)
(c)
(d)
Membership functions for trapezoid as equation 5:
- @A)BCDEFG : ), *, +, G
⎩ ⎪ ⎪ ⎪ ⎨ ⎪ ⎪ ⎪
⎧ 0, ! ), <
= < ) ! ! *
1, * ! ! + H
H >, + ! ! G
0 G ! .
(5)
where parameter (), *, +, G, (with ) * + G) was to determine coordinate for 4 existing corners in trapezoidal membership function.
Membership function employed for the model is shown in Fig.6. First is to change input to crisp value. It will be implemented by fuzzifier. Three types of inputs which are calcification ( , distortion and mass I . are gained from mammogram reports.
D. Rules generation by expert:
Subsequently was the rules generation phase. Based on expert knowledge, the rules were developed. In this study, the M-rules can be generated as:
J ∶ IF is O )PG … . and Iis O, THEN - is V V 1, … . , W
It also could be written as:
JX∶ YO FZ [\X )PG … )PG IFZ [\X, ]^_ - FZ `X P 1,2, …
where O is antecedent and V is consequence for fuzzy rules .
The details of the linguistic variables for the fuzzy membership function using expert rule are shown in Table 2.
E. Proposed Rules Generation using Rough Set:
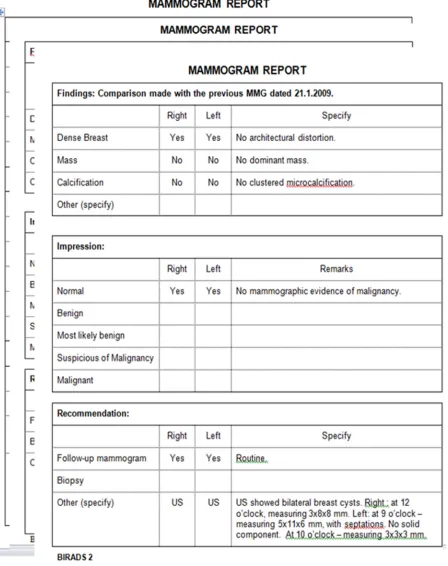
Besides using rules from experts, the study also generated rules automatically using mammogram reports from Radiology Department. From the existing obtained mammogram report, a set of rules were drawn by performing subgroup for data that possessed many criteria. RN patient numbers and their mammogram reports noting about density, mass, calcification and BIRADS decisions are shown in Fig.4. Here, density, mass and calcification constituted the conditions while BIRADS as the target decisions.
Rough set theory was used for producing rules from a set of attribute association. This method was selected because of the ability to handle inconsistence data in dataset. It also was also capable in recognizing redundancy of information and match them together.
The first step was to identify similar classes containing a set of conditions for each patient (P numbers). For example, P7, P10, P12 were patient numbers (Table 3). It generated an equivalent class by identifying similar attribute values of each patient number. In this context, equivalent class namely E1, E2 and E3, represented its own set of patient numbers and its similar attribute in relation to its equivalent class.
The second step was to develop a differential matrix as shown in Table 4. Here, the overlapping or similar attributes from each equivalence class were then identified in detail. It could be observed that, architectural distortion was an attribute that discriminated between E1 and E2 classes. Apart from that, the mass and calcification were attributes that differentiated between E1 and E3 classes.
The third step was to calculate relative differential function (f). It was used to obtain the minimum set attributes that distinguished between classes. Thus, the function of Table 4 could be derived as follows:
f(E1) = Architectural Distortion AND Mass OR Calcification.
f(E2) = Architectural Distortion AND Architectural Distortion OR Mass OR Calcification. f(E3) = Mass OR Calcification AND Architectural
Distortion OR Mass OR Calcification.
(a)
(b)
(c)
Furthermore, a relative reduction (RED) employed a relative function for generating another set of new rules. This relative reduction aimed to take the attributes that only effect on the function. Below are examples of RED function: RED(E1) = (Architectural Distortion AND Mass) OR (Architectural Distortion AND Calcification).
RED(E2) = Architectural Distortion. RED(E3) =Mass OR Calcification.
The last step was to generate rules using relative degradation. OR operator was incorporated to divide into two rules, while AND operator was to unite into one rule. The example is as followed:
From RED(E1) = if Architectural Distortion = yes AND Mass = speculate BIRADS = 5.
From RED(E1) = if Architectural Distortion = yes AND calcification = scattered BIRADS = 5.
From RED (E2) = If Architectural Distortion = yes
BIRADS = 3
From RED (E3) = If Mass = speculate BIRADS 3 From RED (E3) = If Mass = scattered BIRADS = 4
About 21 rules had been generated by rough set theory for mammogram reports. Examples of automatically generated rules using rough set are as per below:
IF calcification distribution is large, no distortion and less mass THEN BIRADS 2.
2. IF calcification distribution is medium, no distortion and less mass THEN BIRADS 2 OR BIRADS 3. 3. IF calcification distribution is little, no distortion and
several mass THEN BIRADS 2 OR BIRADS 4. 4. IF the calculation distribution is very large AND no
distortion AND lot of mass THEN BIRADS 5 OR BIRADS 4
Table 5 shows the details of the linguistic variable of the fuzzy memberships function using rule generated by rough set.
F. Inferencing Process
Development of inference engine was implemented thereafter. This was a basic component in fuzzy logic to calculate firing level for every input and antecedence rules. Upon that, the firing level was applied into consequence of fuzzy set. Fuzzy inference engine for BIRADS which was output for the model can be written as below b - : TABLE II
DETAILS OF THREE INPUT VARIABLES FOR GAUSSIAN, TRIANGULAR AND TRAPEZOIDAL MEMBERSHIP FUNCTION USING EXPERT RULES.
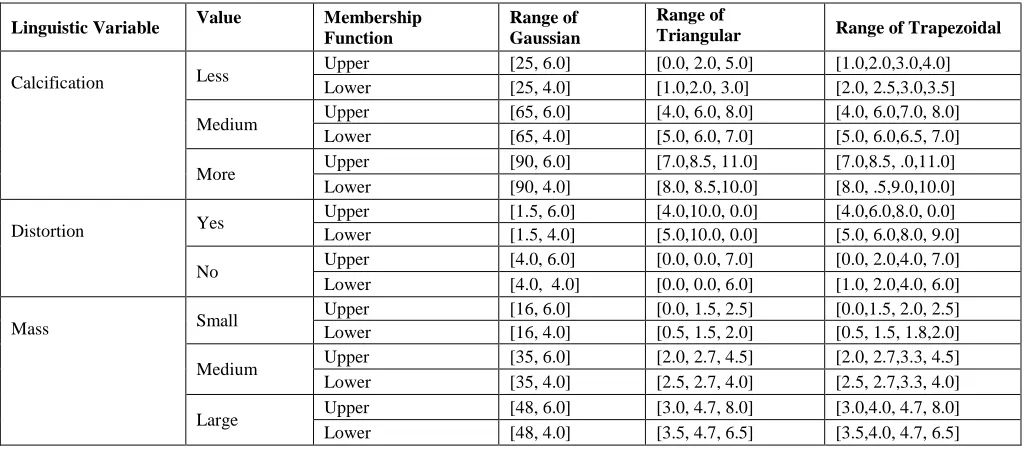
Linguistic Variable Value Membership Function
Range of Gaussian
Range of
Triangular Range of Trapezoidal
Calcification Less
Upper [25, 6.0] [0.0, 2.0, 5.0] [1.0,2.0,3.0,4.0] Lower [25, 4.0] [1.0,2.0, 3.0] [2.0, 2.5,3.0,3.5]
Medium Upper [65, 6.0] [4.0, 6.0, 8.0] [4.0, 6.0,7.0, 8.0] Lower [65, 4.0] [5.0, 6.0, 7.0] [5.0, 6.0,6.5, 7.0]
More Upper [90, 6.0] [7.0,8.5, 11.0] [7.0,8.5, .0,11.0] Lower [90, 4.0] [8.0, 8.5,10.0] [8.0, .5,9.0,10.0]
Distortion Yes
Upper [1.5, 6.0] [4.0,10.0, 0.0] [4.0,6.0,8.0, 0.0] Lower [1.5, 4.0] [5.0,10.0, 0.0] [5.0, 6.0,8.0, 9.0]
No Upper [4.0, 6.0] [0.0, 0.0, 7.0] [0.0, 2.0,4.0, 7.0] Lower [4.0, 4.0] [0.0, 0.0, 6.0] [1.0, 2.0,4.0, 6.0]
Mass Small
Upper [16, 6.0] [0.0, 1.5, 2.5] [0.0,1.5, 2.0, 2.5] Lower [16, 4.0] [0.5, 1.5, 2.0] [0.5, 1.5, 1.8,2.0]
Medium Upper [35, 6.0] [2.0, 2.7, 4.5] [2.0, 2.7,3.3, 4.5] Lower [35, 4.0] [2.5, 2.7, 4.0] [2.5, 2.7,3.3, 4.0]
Large Upper [48, 6.0] [3.0, 4.7, 8.0] [3.0,4.0, 4.7, 8.0] Lower [48, 4.0] [3.5, 4.7, 6.5] [3.5,4.0, 4.7, 6.5]
TABLE III
EXAMPLE OF THE SAME CLASS OF INPUT ATTRIBUTES. Equivalence
Class
Architectural Distortion
Mass Calcification
E1 (P7,P10, P12)
Architectural Distortion
High dense mass
Scattered
E2 (P21) No
Architectural Distortion
Speculate mass
Macro calcification
E3 (P90-96) No
Architectural Distortion
No dense Mass
No Cluster Microcalcifications
TABLE IV
EXAMPLE OF DISCERNIBILITY MATRIX AFTER PERFORMING EQUIVALENCE CLASS.
E1 E2 E3
E1 - Architectural Distortion
Mass, Calcification E2 Architectural
Distortion
- Architectural Distortion, Mass, Calcification E3 Mass,
Calcification
Architectural Distortion, Mass, Calcification
c - V - d e f [1gggg 1 d O1gggg 1
hi
j . d … .
∏l∐ nhin [Bgggg B ∏ OBgggg B op - ∈ ` (6) where [rggg F membership function for mass, calcification and distortion is, Orb F is type-2 membership function for antecedence F at rules s and Vsggg - is type-2 membership function for consequence at rules-s.
The equation above also can be written as:
c - V - ∏ Ot u (7) where Ot u is firing lever for set of mass, calcification and distortion data. When interval type-2 is used in mammogram, the firing level will be in the interval of the set value like:
Ot u vt w , vt w ≡ vt, v t (8)
The fourth step was type-reduction. The study used center of type reduction method due to its the ability to reduce every rules F to type-1 set l-tw, -ywo.
-t ∑•}€${|}~|} ∑•}€${|} , -y
∑•}€${•}~•} ∑•}€${•}
(9)
where vyw, vtw is firing level for -yw and -tw for rule I. It
maximized -y and minimized -t . vywvtw . in interval vt, v t .Karnik-Mendel algorithm also was applied in type reduction step.
Last step was defuzzification. This step made use of centroid of defuzzification
-> ∑„}€$~|}‚ƒ} ~}
∑„}€$ ‚ƒ ~} (10)
where range of - has been discretized into point. + is centroid method. In the study, interval set of l-t , -y o was obtained from type reduction by using average of -t and-y . Then, crisp value of type-2 fuzzy logic system for the model was simplified through:
- ~|%~• (11)
III.RESULTS AND DISCUSSION
To test the proposed model, self-collected data from Hospital UKM, radiology department has been used. The size of data is 100 of mammogram images with their reports. The objective of the model is to classify the data based on three input variables mass, calcification and distortion into TABLE V
DETAILS OF THREE INPUT VARIABLES FOR GAUSSIAN, TRIANGULAR AND TRAPEZOIDAL MEMBERSHIP FUNCTION USING ROUGH SET RULES Linguistic
Variable Value
Membership Function
Range of Gaussian
Range of
Triangular Range of Trapezoidal
Calcification
Less Upper [7, 6.0] [0.0, 1.0, 2.5] [0.0, 1.0,1.3, 2.5] Lower [7, 4.0] [0.5, 1.0, 1.5] [0.5, 1.0,1.3, 1.5] Few Upper [14, 6.0] [1.8, 2.5, 3.2] [1.8,2.0, 2.5, 3.2] Lower [14, 4.0] [2.2, 2.5, 2.8] [2.2, 2.0,2.5, 2.8] Severe Upper [21, 6.0] [2.8, 3.5, 4.2] [2.8, 3.4, 3.7 4.2] Lower [21, 4.0] [3.2, 3.5, 3.8] [3.2, 3.4, 3.7,3.8] Medium Upper [25, 6.0] [3.8, 5.0, 6.5] [3.8,4.5, 5.0, 6.5] Lower [25, 4.0] [4.5, 5.0, 5.5] [4.0,4.5, 5.0, 5.5] Plenty Upper [30, 6.0] [5.5, 7.5, 9.5] [5.5, 7.0,7.5, 9.5] Lower [30, 4.0] [7.0, 7.5, 8.0] [6.0,7.0, 7.5, 8.0] Lot Upper [40, 6.0] [8.5, 9.5, 10.5] [8.5, 9.3,9.5,10.5]
Lower [40, 4.0] [9.2, 9.5, 9.8] [8.5,9.3, 9.5, 9.8] More Upper [50, 6.0] [9.5, 10.5, 11.0] [9.0, 9.3, 9.5, 9.8]
Lower [50, 4.0] [10.3, 10.5,11.0] [9.5, 10.0, 10.5, 11.0]
Distortion
No Upper [1.5, 6.0] [0.0, 0.0, 7.0] [9.8,10.0,10.5,10.8] Lower [1.5, 4.0] [0.0, 0.0, 6.0] [0.0, 2.0,4.0, 7.0] Yes Upper [4.0, 6.0] [4.0, 10.0, 10.0] [1.0, 2.0,4.0, 6.0]
Lower [4.0, 4.0] [5.0, 10.0, 10.0] [4.0, 7.0, 10.0, 10.0]
Mass
Less Small Upper [7.0, 6.0] [0.0, 1.5, 2.2] [5.0, 7.0,10.0, 10.0] Lower [7.0, 4.0] [0.5, 1.5, 1.8] [0.0, 1.3, 1.5, 2.2] Small Upper [15.0, 6.0] [1.8, 2.5, 3.2] [0.5, 1.3, 1.5, 1.8] Lower [15.0, 4.0] [2.2, 2.5, 2.8] [1.8, 2.4, 2.6, 3.2] Less medium Upper [21.0, 6.0] [2.8, 3.5, 4.2] [2.2, 2.4,2.6, 2.8]
Lower [21.0, 4.0] [3.2, 3.5, 3.8] [2.8, 3.4, 3.6, 4.2] Medium Upper [28.0, 6.0] [3.8, 5.0, 6.2] [3.2,3.4, 3.6, 3.8]
Lower [28.0, 4.0] [4.5, 5.0, 5.5] [3.8,4.8, 5.2, 6.2] Big Upper [35.0, 6.0] [5.8, 6.5, 7.2] [4.5, 4.8, 5.2, 5.5]
corresponding BIRADS. Selecting these inputs is because their effects in determining BIRADS class based on the expert.
K-fold cross validation used to divide data into training data and testing data because every data had a tendency to be trained and tested. This method started by randomly dividing data into k blocks with equal size. One block was used in testing while the others were used for training. A method of k-fold was shown in Fig.7.
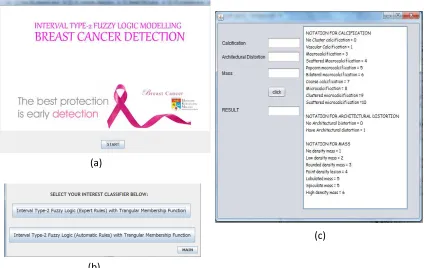
Whenever a user wishes to utilize the system, it is prerequisite upon him to identify which type of membership function he desires to use as well as the rules to be applied in the system, either expert based rules or rough ret rules.
The user is firstly required to log into the system as Fig. 8 (a) and select the preferred classifier as in Fig. 8 (b).
Thereafter, the user needs to fill in the form about mammogram reports as Fig. 8 (c). The form consists of three input used for the model and one output which is BIRADS, that will be displayed later.
Coefficient matrix for every membership function is detailed in Table 7.
Sensitivity, accuracy and specificity can be calculated for the coefficient matrix using formulae below:
Sensitivity is probability of correct positive detection of breast cancer from the total number of positive detection
…†‡ˆ‰Š‰‹‰ŠŒ #•‘ %#’“#Ž• ,
where #TP (true positive) is number of patients predict as having breast cancer and they are having. #FN (false negative) is number of patients predict as having breast cancer and they haven’t in the real.
Specificity is probability of correct negative detection of breast cancer from the total number of negative detection.
Specificity = #•“ #•“ % #’‘ ,
where #TN (true negative) is number healthy patients predict as healthy #FP is number of unhealthy patients predict as healthy.
Moreover, accuracy is as probability for correct detection (positive or negative) to the total number of the population.
Accuracy = #•‘ %#•“
”•”–— •˜ ™•š›”›œ•% ”•”–— •˜ ž•Ÿ–”›œ• Example
of testing Total number of example mammogram
data record
Experiment 1
Fig. 7 Division of mammogram data using k-fold method.
(c)
A comparison of rough set rules using standard voting and Naive Bayes is tabulated in Table 7. This was the best result achieved with data folding. At fold-8, Naive Bayes shows the highest result of classification which is 71.79% which divided data into training and testing (60:40). It was due to the small sample size of data and also ensure that the highest accuracy was obtained. It also produced 21 rules that was applied into the model. Naive Bayes is a good classifier too as it is capable to give an exceptional result for small data and reduce error more effectively.
The study also made a comparison between rules given by expert and rules generated automatically by rough set theory. Triangular membership function, trapezoidal membership function and Gaussian membership function were used in the model.
Table 8 shows that, rough set rule outperforms expert rule based on the three fuzzy membership functions in term of accuracy and specificity. Even if the sensitivity using expert rule is a little bit higher than using rough set rules but the different is not that much. Moreover, the sensitivity obtained by rough set rules still acceptable and comparable in term of medical application needed.
T-test has been applied to prove the significant between rules given by expert and rules generated automatically by rough set theory. Based on T-Test result, the proposed method using rough set rules is statistically significant than expert rules with (P= 0.0047< 0.05).
Rough set theory is a good method because it has an efficient algorithm to recognize the pattern of mammogram data.
This method has an ability to identify relationship between the data used. Besides, rough set theory also can evaluate the data clearly. For example, while generating rules, rough set will identify pattern and relationship of the data to yield a sound rule. In other word, Fuzzy rough set can generalize the rules and overcome the limitation of rule generated by expert. In consequent, model that utilized rules from rough set perform batter compare to expert rules. Furthermore, there is a higher probability of expert diagnosing patient as the lowest BIRADS that yields to lower accuracy of the model
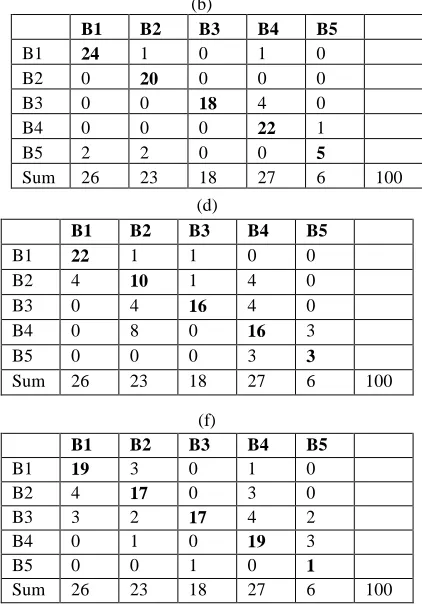
TABLE VI
COEFFICIENT MATRIX FOR, (A) TRIANGULAR MEMBERSHIP FUNCTION USING EXPERT RULES, (B)TRIANGULAR MEMBERSHIP FUNCTION USING ROUGH SET RULES, (C)TRAPEZOIDAL MEMBERSHIP FUNCTION USING EXPERT RULES, (D)TRAPEZOIDAL MEMBERSHIP FUNCTION USING ROUGH SET RULES, (E)
GAUSSIAN MEMBERSHIP FUNCTION USING EXPERT RULES AND (F) GAUSSIAN MEMBERSHIP FUNCTION USING ROUGH SET RULES.
(a)
B1 B2 B3 B4 B5
B1 22 1 0 0 0
B2 4 17 1 4 0
B3 0 4 17 4 0
B4 0 1 0 19 3
B5 0 0 0 0 3
Sum 26 23 18 27 6 100
(b)
B1 B2 B3 B4 B5
B1 24 1 0 1 0
B2 0 20 0 0 0
B3 0 0 18 4 0
B4 0 0 0 22 1
B5 2 2 0 0 5
Sum 26 23 18 27 6 100 (c)
B1 B2 B3 B4 B5
B1 18 1 2 5 1
B2 4 13 1 7 1
B3 4 4 15 4 2
B4 0 5 0 10 0
B5 0 0 0 1 2
Sum 26 23 18 27 6 100
(d)
B1 B2 B3 B4 B5
B1 22 1 1 0 0
B2 4 10 1 4 0
B3 0 4 16 4 0
B4 0 8 0 16 3
B5 0 0 0 3 3
Sum 26 23 18 27 6 100
(e)
B1 B2 B3 B4 B5
B1 15 5 0 0 1
B2 4 17 2 10 0
B3 7 0 15 4 3
B4 0 1 0 13 0
B5 0 0 0 0 2
Sum 26 23 18 27 6 100
(f)
B1 B2 B3 B4 B5
B1 19 3 0 1 0
B2 4 17 0 3 0
B3 3 2 17 4 2
B4 0 1 0 19 3
B5 0 0 1 0 1
Sum 26 23 18 27 6 100
TABLE VII
COMPARISON OF ACCURACY OF ROUGH SET RULES. USING STANDARD VOTING AND NAÏVE BAYES
8 Fold Standard voting Naive Bayes
Train: Test
Accuracy (%)
No. of rules
Accuracy (%)
No. of rules
10:90 35.22 4 26.13 4
20:80 34.61 8 28.20 8
30:70 26.09 10 33.33 10
40:60 37.28 16 44.06 16
50:50 46.93 20 59.18 20
60:40 48.71 21 71.79 21
70:30 48.27 23 68.96 23
80:20 55.00 24 70.00 24
TABLE VIII
PERCENTAGE OF ACCURACY, SENSITIVITY AND SPECIFICITY FOR EVERY MEMBERSHIP FUNCTION USING EXPERT RULES AND ROUGH SET RULES
Membership function Accura cy (%) Sensitivit y (%) Specificity (%)
Expert Gauss 64 97.92 50
Triangular 78 98.24 73.33 Trapezoid 58 12.55 37.5 Rough
set
Gauss 73 96.36 66.67
Triangular 89 93.94 84.34 Trapezoid 67 1.5 70.37
IV.CONCLUSIONS
Breast cancer detection in early stage can reduce mortality rate among women. Uncertainty exists in determination of BIRADS of breast cancer can be removed by applying fuzzy logic method. The study utilizes type-2 fuzzy logic and produced rules from rough set and expert. Comparison between the models was carried out to identify a better model for developing BIRADS. The model also utilizes three types of different membership function and it is observed that triangular membership function is better in relative to others. This project has proven that rules generated by Rough Set produces better model and accuracy for predicting BIRADS classification. On the other hand, expert rules are still insufficient to model real-life scenario. A second opinion regarding to BIRADS classification is highly imperative to support and substantiate the decision made by a specific expert. Therefore, BIRADS classification intelligent system has shown the significance of using general rules derived from a set of knowledge base instead of a single expert.
ACKNOWLEDGMENTS
This work was supported by Arus Perdana “Using Stem Data Through Smart Self-Crime Prevention at Schools for Open Data Readiness Tajuk Program: Fusion Technologies for Stem Education in Schools to Enhance Open Data Readiness in an Innovative Digital Economy (AP-2017-005/2)”. and Impak Perdana“Object Descriptor Via Optimized Unsupervised Learning Approaches (Pemerihalan Objek Secara Kaedah Pembelajaran Tak Terselia Beroptimasi (DIP-2015-023)”). We have obtained Ethics approval entitled “FF-338-2012 Breast Cancer Diagnostic Imaging System Using Mammogram and Ultrasound” from Hospital UKM, Malaysia, for collecting and conducting experiments on breast cancer patient records. Finally, especial thanks Dr Rizuana Iqbal Hussain from Radiology Department of UKM Hospital, for her help and guiding about breast cancer. We would like to thank Neno Fitri for help in data collection.
REFERENCES
[1] National Cancer Registry Report, N, 2007. Malaysia Cancer Statistic – Data and Figure.
[2] Bozek, J., Delac, K. &Grgic, M, 2008. Computer-Aided Detection and Diagnosis of Breast Abnormalities in Digital Mammography (September), 10–12.
[3] http://www2.bharian.com.my/articles/Kanserpayudaraancam700_000 wanitaMalaysia/Article/.
[4] Sameti, M, 1998. Detection of Soft Tissue Abnormalities in Mammographic Images for Early Diagnosis of Breast Cancer the University of British Columbia. Retrieved from
http://circle.ubc.ca/bitstream/handle/2429/9987/ubc_1999-389723.pdf?sequence=1
[5] Silverstein, M. J., Lagios, M. D., Recht, A., Allred, D. C., Harms, S. E., Holland, R., Holmes, D. R. et al, 2005. Image-detected breast cancer: state of the art diagnosis and treatment. Journal of the American College of Surgeons, 201(4), 586–97.
[6] Kerlikowske, K., Carney, P. A., Geller, B., Mandelson, M. T., Taplin, S. H., Malvin, K., Ernster, V. et al, 2000. Performance of screening mammography among women with and without a first-degree relative with breast cancer. Annals of internal medicine, 133(11),
855–63. Retrieved from
http://www.ncbi.nlm.nih.gov/pubmed/11103055
[7] R. M. Rangayyan, F. J. Ayres, J. L. Desautels, "A review of computer-aided diagnosis of breast cancer: Toward the detection of subtle signs", Journal of the Franklin Institute, vol. 344, pp. 312-348, 2007.
[8] Fenton, J. J., Taplin, S. H., Carney, P. A., Abraham, L., Sickles, E. A., D'orsi, C., & Elmore, J. G. (2007). Influence of computer-aided detection on performance of screening mammography. New England Journal of Medicine, 356(14), 1399-1409.
[9] Qasem, A., Abdullah, S. N. H. S., Sahran, S., Wook, T. S. M. T., Hussain, R. I., Abdullah, N., & Ismail, F. (2014, March). Breast cancer mass localization based on machine learning. In Signal Processing & its Applications (CSPA), 2014 IEEE 10th International Colloquium on (pp. 31-36). IEEE.
[10] Kamaruddin, N. (2017). Active Contour Model Using Fractional Sync Wave Function for Medical Image Segmentation. Asia-Pacific Journal of Information Technology and Multimedia, Vol. 5(2). [11] Dubey, A.K., Gupta, U. and Jain, S., 2018. Comparative Study of
K-means and Fuzzy C-K-means Algorithms on The Breast Cancer Data. International Journal on Advanced Science, Engineering and Information Technology, 8(1), 18-29.
[12] Baharuddin, W. N. A., Hussain, R. I., Abdullah, S. N. H. S., Fitri, N., & Abdullah, A. (2013). Mamdani-fuzzy expert system for BIRADS breast cancer determination based on mammogram images. In Soft Computing Applications and Intelligent Systems (pp. 99-110). Springer, Berlin, Heidelberg.
[13] Baharuddin, W. N. A., Abdullah, S. N. H. S., Sahran, S., Qasem, A., bin Abdullah, A., Iqbal, R., & Ismail, F. (2016, March). Type 2 Fuzzy Logic for mammogram breast tissue classification. In Industrial Informatics and Computer Systems (CIICS), 2016 International Conference on (pp. 1-6). IEEE.
[14] Hamouda, S.K.M., Wahed, M.E., Alez, R.H.A. and Riad, K., 2018. Robust breast cancer prediction system based on rough set theory at National Cancer Institute of Egypt. Computer methods and programs in biomedicine, 153, .259-268.
[15] Hassanien, AboulElla. 2007. Fuzzy rough sets hybrid scheme for breast cancer detection. Image and vision computing, Vol. 25.2, pp. 172-183.
[16] Tan, P., Steinbach, M. &Vipin, K. 2006. Introduction to Data Mining Instructor’ s Solution Manual.
[17] Han, J. &Kamber, M. 2006. Data Mining Concepts and Techniques pp.1–723