Computational fluid dynamics and experimental analysis of direct
solar dryer for fish
Oluwasanmi Iyiola Alonge, Surajudeen Olanrewaju Obayopo
* (Department of Mechanical Engineering, Obafemi Awolowo University, Ile-Ife, Nigeria. P.M.B. 13)Abstract: Fish preservation is the most important post-harvest process in commercial fishery. The traditional methods of fish
preservation are inefficient and susceptible to contamination. Few existing solar fish dryers are not designed for optimal drying performance. In this study, a direct solar dryer for fish was numerically modeled, fabricated and evaluated for performance enhancement. The modeling was performed using Computational Fluid Dynamics code to simulate different dimensions of the designed dryer at varying fan speeds. By applying desirability function method, (70×60×40) cm3 drying chamber with a plane of 25 cm away from the base for tray location gives optimal temperature and the best uniform air flow distribution. The performance of the fabricated dryer using the numerical model results was experimentally evaluated during the dry season and the wet season of the year without load. Maximum collector efficiency of 77.2% and temperature elevation of 26.7o C was observed at natural convection (0 m s-1 fan speed) for both seasons. Using root mean square error and mean bias error, predictions were within acceptable limit (10%) and there were no significant differences between the experimental and numerically predicted values by statistical t-test (p≤0.05) at fan speeds considered.
Keywords: direct solar dryer, CFD, optimal temperature, collector efficiency
Citation: Alonge O. I., and S. O. Obayopo, 2019. Computational fluid dynamics and experimental analysis of direct solar dryer
for fish. Agricultural Engineering International: CIGR Journal, 21(2): 108–117.
1 Introduction
ASolar energy is the most considerable energy source in the world. The world receives 170 trillion (KW) solar energy and 30% of this energy is reflected back to the space, 47% is transformed to low temperature heat energy, 23% is used for evaporation/rainfall cycle in the Biosphere and less than 0.5% is used in the kinetic energy of the wind, waves and photosynthesis of plants (Ingle et al., 2013). Nigeria lies within a high sunshine belt and the country solar radiation is fairly distributed well. It varies from about 12.6 MJ/m2-day (3.5 kWh m-2-day) in the costal latitudes to about 25.2 MJ m-2 day (7.0 kWh m-2-day) in the far north (Irtwange, 1991).
Man has increasingly become dependent on natural resources to satisfy his needs and some methods of
Received date: 2018-03-14 Accepted date: 2018-08-20
*Corresponding author: S. O. Obayopo, Senior Lecturer in
Mechanical Engineering Department, Obafemi Awolowo University, Ile-Ife, Nigeria. Tel: +2348130871298. Email: [email protected].
utilizing solar energy have reached a stage of development where they can compete economically with methods of using conventional energy source (Arinze, 1983). Solar drying is a potential decentralized thermal application of solar energy particularly in developing countries (Sharma et al., 2009).
Drying reduces moisture, with a consequent weight reduction, prolongs shelf life and preserves the nutritional quality of the food. Fish farming is a fast growing business in Nigeria with production rate increasing annually. Fresh fish contains up to 80% of water and to spoilage during storage, moisture content must be reduced to 15% (Bala and Mondols, 2001).
aromatic hydrocarbons (PAH) which are carcinogenic (Mustayen et al., 2014). Solar dryer is considered as a cleaner and sustainable solution compared to traditional drying approaches. Researchers have developed different solar dryer to alleviate the problems associated with traditional methods although without adequate modeling of the dryer towards parameter optimization for optimal drying performance.
A comprehensive review of the various designs and details of construction and operational principles of practical solar dryers was presented by Ekechukwu and Norton (1999). A systematic approach for the classification of solar energy dryers were also evolved, identifying two generic groups, namely passive or natural circulation solar energy dryers and active or forced convection. Mustayen et al. (2014) presented a review on the performance study of different solar dryers. The paper presents the state of various kinds of solar dryers that are widely used today. The indirect, direct, and mixed mode dryers that have shown potential in drying agricultural products in the tropical and subtropical countries are discussed. A cabinet drying system was constructed and tested by Al-Juamily et al. (2007) and the results showed that the most effective factor on the drying rate was the drying air temperature inside the cabinet; effect of air velocity was minimal and therefore there was no need for high air velocity inside the cabinet. To design a cost effective and compact solar dryer, a direct solar dryer type was considered in this study. It will also give room for the product to be dried to receive energy from both collector and solar incident radiation.
Numerical techniques have been used to numerically model the behavior of some kinds of dryers (Kituu et al., 2010, Hossain et al., 2009, Sadodin and Kashani 2010, Maia et al., 2012, Adeniyi et al., 2012) but with the need for optimization of solar dryer geometry and performance prediction at various operating condition before actual production of the prototype. The specific objective of this paper is to numerically simulate a direct solar dryer at different dimension for performance optimization, design, fabricate and carry out performance evaluation.
2 Materials and methods
2.1 Geometric considerations
Several response variables describing the quality characteristics and efficiency of the systems were to be optimized. Some of these variables are to be maximized and some are to be minimized. In many cases, these responses are competing, i.e., improving one response may have an opposite effect on another one, which further complicates the situation. In this study, the parameters considered were the height, the length, the breath of the dryer and the fan speed. It was recommended that a constant exchange of air and a roomy drying chamber should be attained in solar food dryer design with least height of 40 cm, thus the design should be made spacious (Alamu et al., 2010). In this study, a breath of 60 cm was used throughout the simulation and four different lengths (55 cm, 60 cm, 65 cm, and 70 cm) were considered to determine the optimum height that will ensure optimal performance of the dryer. Four different heights (40 cm, 45 cm, 50 cm and 55 cm) of the front side of the dryer were investigated in this study while the height of the back side depended on the angle of inclination of the glass and the height of the front side. According to Fagbenle (1991), the optimum angle of inclination for glass for sites in Nigeria with latitudes 8.5o N or less was (latitude angle +10o). Hence, the suitable angle of inclination for the glass is 17.48o (10º +7.48º).
These parameters were combined together as shown in Table 1. In order to determine the optimum position for the tray, the simulation of the dryer was performed without considering the tray and the product to be dried. The maximum air velocity to be used was determined using Equation (1) and (2). Inlet opening which will serve as air inlet was made the dimension of 12V, 0.2A DC fan (80 cm×2.5 cm×80 cm), capable of delivering 0.021 m3 s-1 of air, and which could induce forced convective in the dryer whenever necessary. Outlet opening was made 300 cm×5 cm. It is suggested for hot climate passive solar dryers, a gap 5 cm should be created as air vent (Alamu et al., 2010).
(Δ )
W a
CB
M M
W n
=
× (1) MV = Ma×VS (2)
where, Ma denotes the mass of air to remove moisture
(kg); MW is quantity of water to be removed (kg); ΔWCB is
point (kg/kg dry air); MV is volumetric flow rate; Vs is
specific volume of the drying air and n is the pickup value (0.2 considered appropriate for fish from literature).
Table 1 Dimension formulated (l ×b×h) cm3
l1 l2 l3 l4
h1 (55×60×40) (60×60×40) (55×60×40) (60×60×40) h2 (55×60×45) (60×60×45) (55×60×45) (60×60×45) h3 (55×60×50) (60×60×50) (55×60×50) (60×60×50) h4 (55×60×55) (60×60×55) (55×60×55) (60×60×55)
2.2 Governing equations
For all flow, CFD solves conservation equations for mass and momentum. For flows involving heat transfer or compressibility, an additional equation for energy conservation is solved. These equations can be written respectively, as follows:
( ) m
ρ
ρv S t
∂ + ∇ ⋅ =
∂ (3)
( )ρv (ρvv) p ( )τ ρg t
∂ + ∇ ⋅ = −∇ + ∇ ⋅ +
∂ (4)
( )
( ) ( ) ( )
m E
ρh P
ρvh γ T v τ
t t
v S S
∂ −∂ + ∇ ⋅ = ∇ ⋅ ∇ + ∇ ⋅ ⋅ +
∂ ∂
⋅ +
(5)
For the turbulence modeling, k-epsilon model which is generally used for such calculations due to stability and precision of numerical results in literature was chosen for the numerical calculation. It assumes conservation of turbulence kinetic energy, k and its corresponding dissipation rate ε through the following relations.
( )
( ) t
k k
μ ρk
ρvk μ k P ρε
t σ
⎡⎛ ⎞ ⎤
∂ + ∇ ⋅ = ∇ ⋅ + ∇ + −
⎢⎜ ⎟ ⎥
∂ ⎢⎣⎝ ⎠ ⎥⎦ (6)
1 2
( )
( ) t ( )
ε k ε
ε
μ
ρε ε
ρvε μ ε C P C ρε
t σ k
⎡⎛ ⎞ ⎤
∂ + ∇ ⋅ = ∇ ⋅ + ∇ + −
⎢⎜ ⎟ ⎥
∂ ⎢⎣⎝ ⎠ ⎥⎦
(7)
2.3 Numerical procedure
The model equation were solved using a finite volume computational fluid dynamics code ANSYS FLUENT. The CFD code has an add-on package for solar load model which has requirement for latitude and longitude of the location. The solar dryer model was createdusing design modeler (Autodesk Inventor 15) because of its flexibility and then exported to ANSYS design modeler interface. The mesh size was decided by checking the orthogonal quality and skewness after carrying out a
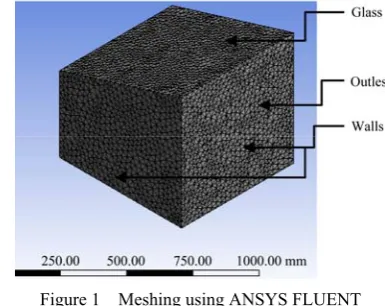
preliminary grid independency analysis with different mesh resolutions based on computational cost. Figure 1 showed the typical generated mesh. The Monte-Carlo ray tracing methodology in Li et al. (2011), with solar load model available in FLUENT were used and the position of the sun related to experimental conditions was determined with solar calculator available in FLUENT. The global solar position of the sun was computed based on the latitude (7.48o N) and longitude (4.57o E) of the research location.
Figure 1 Meshing using ANSYS FLUENT
2.4 Boundary condition and solution Set-up
Table 2 Materials properties
Materials/properties Air Glass Steel
Density (kg m-3) 1.225 2600 8030
Specific heat (J kg-1 K-1) 1005 840 502
Thermal conductivity (W m-1K-1) 0.024 1.1 16.27
Viscosity (kg m-1 s-1) 2.8e-05 -- -- 2.5 Description of experimental solar dryer and
experimental setup
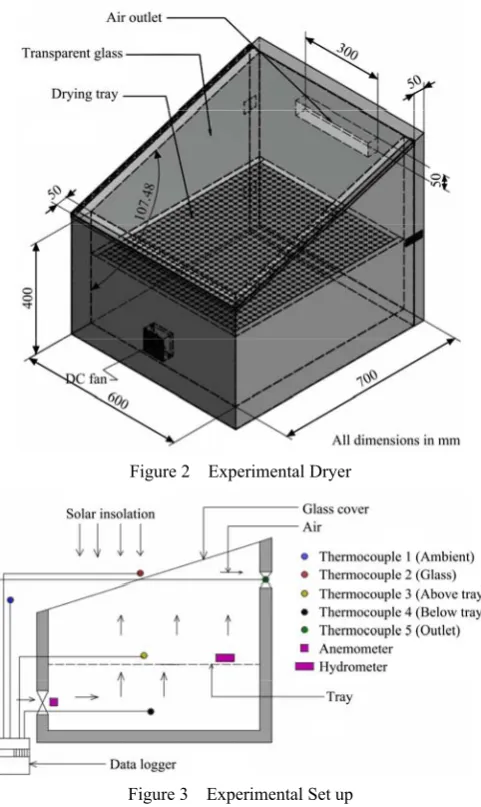
Numerically obtained parameters (from geometry optimization simulation) were used for the design of the solar dryer. Figure 2 showed the designed dryer after simulation. The experimental dryer was made from locally available materials (such as galvanized sheet, glass sheet, fiber glass and wood). The drying chamber was double walled insulated with fiber glass of 5 cm thick (from design calculation using Equation (8)) to prevent energy losses. 12V DC fan was attached to the dryer to induce force convection and was connected to air speed regulator which was connected to 12V DC battery. The inner wall was painted black for enhanced absorption and emission of solar energy. The experimental dryer was mounted on a wooden frame. No load was conducted on the dryer during the dry and wet season of the year. The test was carried out mainly to measure the collector efficiency, ambient temperature (T1), temperature above
the tray (T2a), temperature below the tray (T2b), outlet
temperature (T3), ambient relative humidity and relative
humidity in the dryer for both dry and wet season. The experimental set up arrangement was shown in Figure 3. On each day, air temperature and relative humidity were measured between 8:00 am and 5:00 pm, at two hours intervals.
1 2
( )
KA T T
Q
X −
= (8)
where, K (W m-1 K-1) is thermal conductivity of the fiber
glass; X (m) is the thickness of the lagging and A (m2) is
the cross sectional area.
2.6 Model validation
To validate the developed model, simulated and actual data were compared using graphical method. The model predictions were evaluated on the basis of root mean square error (RMSE) and mean bias error (MBE) using Equation (9) & (10). They are frequently used as a measure of the difference between values predicted by a model and the values actually observed.
2
1 1
RMSE (%) n i true
i
true
x x
n − x
⎛ − ⎞
= ⎜ ⎟
⎝ ⎠
∑
(9)1 1
MBE (%) n i true i
true
x x
n − x
−
=
∑
(10)Other tool used to test the existence of significant difference between actual and simulated data is statistical t-test analysis at 95% confidence:
2 2
( )
( 1) ( 1) 1 1
1
x x y y
x y x y
x y t
n s n s
n n n n
− =
− + −
+
+ −
(11)
If |t| < tα\2, No significant different.
where, x and y are the mean value of the actual and simulated data, respectively; n, nx, ny are number of
measurement; sx, sy are standard deviation and xi, xtrue are
the predicted and experimental values, respectively.
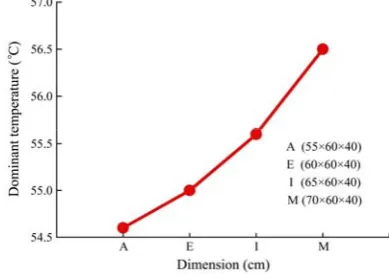
Figure 2 Experimental Dryer
Figure 3 Experimental Set up
2.7 Collector efficiency
absorber surface and was calculated using Equation (12).
p c
c c
v ρ c t
η
A I
× × × ∇ =
× (12)
where, Ac is the collector area (m2); Ic incident radiation
(W/m2); cp is the specific heat capacity (kJ kg-1 K-1); v is
the volumetric flow rate of air (m3 s-1); ρ is the density (kg m-3) and ∇t is the change in time (s).
3 Result and Discussion
3.1 General observation
The numerical simulation results that combines the effect of varied geometrical dimensions and fan speeds on the dominant temperature in the dryer were shown in Figure 4. The drying chamber with dimension (70×60× 40) cm3 had the highest dominant temperature of 56.5oC
at 0 m s-1 (natural convection), 53.5oC at 1.5 m s-1, 52.5oC
at 2.5 m s-1 and 51oC at 3.5 m s-1 while the drying
chamber with dimension (55×60×55) cm3 had the lowest
dominant temperature of 51.5oC at 0 m/s, 50.2oC at
1.5 m s-1, 47.4oC at 2.5 m s-1 and 46.4o C at 3.5 m s-1. This
result showed that the optimal length was 70 cm and the optimal height was 40 cm at breath 60 cm.
Figure 4 Effect of fan speed on dominant temperature of
considered dimensions
3.2 Effect of varied fan speed on dominant temperature
The dominant temperature in the dryer decreased with the increase in the fan speed for all the dimensions, and the dominant temperature at 0 m s-1 fan speed was the highest value compared to other fan speeds. This indicated that sucking in of air by the fan reduced the temperature in the chamber, and led to convective cooling inside the dryer. The result also showed that the temperature of the dryer could be regulated by controlling the fan speed. When the dominant temperature inside the
dryer was high and to avoid cooking, compensation could be achieved by increasing the speed of the fan and this would reduce the temperature. Tropical species of fish can generally withstand temperatures 35-50oC before protein were denatured and cooking starts (Bala and Mondols, 2001). To ensure only drying and to avoid cooking of the fish, the drying air temperature was needed to be mentained around this temperature range.
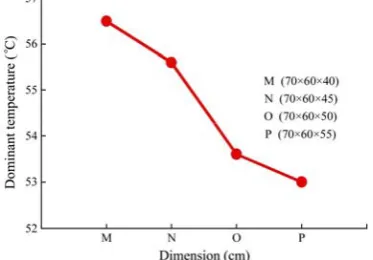
3.3 Effect of change in length on the dominant
temperature
In Figure 5, it was observed generally that the dominant temperature increased with the increase in length of the dryer due to the increase in exposed surface area to the sun ray. Drying chamber with dimension (55×60×40) cm3, (60×60×40) cm3, (65×60×40) cm3 and (70×60×40) cm3 had the highest dominant temperature in all fan speeds compared to other dimension of the same category in length. The figure also indicated 70 cm as optimal length.
Figure 5 Dominant air temperatures with length
3.4 Effect of change in height on the dominant
temperature
Based on this analysis, drying chamber with dimension (70×60×40) cm3 was selected as optimal drying chamber dimension since it had the highest dominant temperature.
Figure 6 Dominant air temperature with height
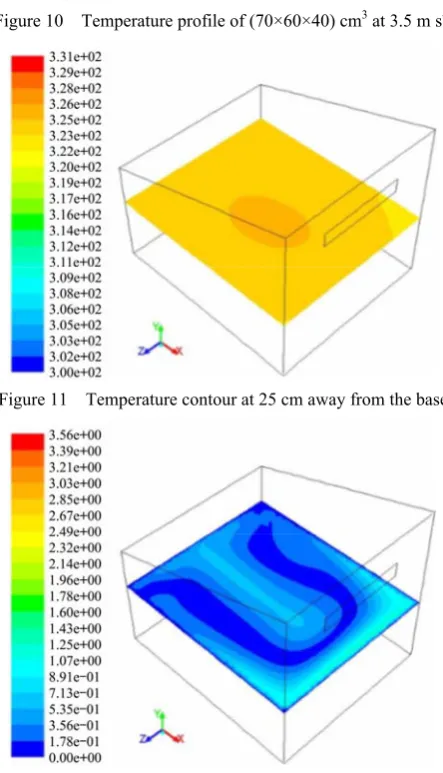
Figure 7-10 showed the obtained temperature contours for the dimension (70×60×40) cm3 at different fan speed. The temperature contours showed that air near the glass had the highest temperature as the result of the participation of the glass in solar ray tracing algorithm while other parts were adiabatic walls and the closeness of the upper part of the dryer to the glass exposed to solar radiation. The simulation results also indicated that the heat convection and conduction received by the glass and absorber walls, respectively maintains the drying chamber at high temperature. The low temperature at the air inlet revealed the convective cooling effect of the incoming ambient air to the drying chamber.
For the purpose of even drying, optimal position where the temperature was more uniform for the drying tray inside drying chamber was observed. For this to be achieved, temperature profile of drying chamber at 3.5 m s-1 was selected as the reference profile since 3.5 m s-1 was the maximum speed considered in this experiment and six horizontal planes at 20 cm, 22.5 cm, 25 cm, 27.5 cm, 30 cm and 32.5 cm away from the base was selected. Horizontal plane at 25 cm away from the base was selected as a better position for the tray owing to even drying, temperature uniformity and prevention of product considered from over heating. Figure 11 showed the temperature contour at the plane selected while Figure 12 showed the air velocity at the plane. It was observed that the air velocity was higher at wall opposite the air inlet and at the center of the plane and this could be due to the position of the wall, air recirculation and effect of
drying air density variation in the drying chamber. It was important to check the velocity profile in order to understand the air movement at that position which will have influence on the drying rate of the product. Hence, the drying chamber dimension of (70×60×40) cm3 with the drying tray located at 25 cm away from the base was selected as the optimal dimension for drying and the design parameters obtained from this CFD simulation form the basis of fabrication condition.
Figure 7 Temperature profile of (70×60×40) cm3 at 0 m s-1
Figure 8 Temperature profile of (70×60×40) cm3 at 1.5 m s-1
Figure 10 Temperature profile of (70×60×40) cm3 at 3.5 m s-1
Figure 11 Temperature contour at 25 cm away from the base
Figure 12 Velocity contour at 25 cm away from the base
3.5 No load test experimental results
Figure 13 and 14 showed the variation of solar radiation, air temperature and relative humidity, respectively with time under no load during the dry season at different fan speed, while Figure 15 and 16 showed the variation of solar radiation, air temperature and relative humidity with time, respectively under no load during the wet season. Generally for both season, the air temperature above the tray was observed to be higher than the air temperature below the tray which was in
agreement with the simulation result. The variation in ambient and drying chamber temperature was dependent on the change in solar radiation. The drying chamber and ambient relative humidity decreased with the increase in temperature with ambient relative humidity having the highest values for all readings. It was observed that the humidity varied throughout the day, generally high in the morning. However, the rate of convective heat loss to the surroundings increased as the air-flow rate increased.
During the dry season test, as the solar radiation decreased the ambient temperature was still high till late in the evening due to the cloudiness of the area which trapped the heat wave. In all the speeds considered, the blown out air temperature values still show drying capacity of the air. The pattern of temperature distribution was compared for three locations in the dryer (below tray, above tray and outlet). Temperatures at these three locations varied within narrow band. In addition, temperatures at each of the locations differed significantly from the ambient air temperature. The air temperatures inside the dryer were high at 0 m s-1 fan speed (natural convection) and this was in agreement with the simulation result. These values obtained showed that the designed solar dryer has the capacity of heating air to 6oC-35oC above ambient temperature depending on the
value of intensity of solar radiation and would be efficient for drying of fish at different fan speed during the dry season. The optimal drying air temperature achieved in this study was 60.6oC and those of Bala and Mondol (2001), Omitoyin et al. (2010) and Oparaku and Ojike (2013) were 52oC, 48oC and 48.5oC, respectively.
Figure 14 Variation of humidity with relative time during the dry season
Figure 15 Variation of air temperature and solar radiation with time during the wet season
Figure 16 Variation of humidity with relative time during the dry season
During the wet season at 0 m s-1, high solar radiation and air temperatures were recorded as like the dry season while at 1.5 m s-1 the values recorded were low but at 2.5 m s-1 and 3.5 m s-1 fan speed, the solar radiation and air temperatures were very low and their respective
relative humidity were high due to the rainfall on the days of investigation. The high humid air in the drying chamber could also be as the result of ambient humid air sucked in. These values obtained showed that the efficiency of the dryer would be lower for fish drying during wet season.
3.6 Collector efficiency
Figure 17 and 18 showed the variation of the efficiency of the collector and temperature elevation with time for dry and wet season, respectively. The collector efficiencies at 0 m/s fan speed were found to be higher when compared with other fan speeds as the result of high temperature elevation. This showed that, sucking in of ambient air by the fan reduces the temperature elevation in the dryer as the result of convective heat loss but during drying process, the air flow will enhance the drying rate by convective loss of moist air. Maximum collector efficiency of 77.2% and temperature elevation of 26.7oC was observed at 0 m s-1 fan speed compared to other fan speeds for both season. Average collector efficiency and average temperature elevation at fan speeds considered were higher in the dry season than the wet season.
3.7 Model validation
To validate the model, the simulated air temperatures were compared with the experimental values. Figure 19 and 20 showed a typical comparison between CFD and experimental drying air temperature on hourly basis. Predicted values showed plausible behavior and the agreement between the predicted and observed values were good. The model predictions were evaluated on the basis of RMSE and MBE. The values obtained indicate that the model at 0, 1.5, 2.5 and 3.5 m s-1 fan speed could predict small fluctuation RMSE 4.6%, 7.3%, 6.3% and 5.7%, respectively, and under predict the temperature with a very small mean bias –1.6 %, –1.4%, –1.63% and –2.23%, respectively during the dry season while during the wet season the model at 0, 1.5, 2.5 and 3.5 m s-1 fan speed could predict small fluctuation RMSE 5.81%, 6.5%, 7.11% and 5.98%, respectively and under predict at 0 and 1.5 m s-1 with a very small bias -0.88% and –1.1%, respectively while at 2.5 and 3.5 m s-1 over predict with a
statistical t-test (p≤0.05) at fan speeds considered. Thus, the model predictions were reasonably good. Furthermore, predictions are within acceptable limit, 10% (Janjai et. al., 2008).
Figure 17 Collector efficiency and temperature elevation during the dry season
Figure 18 Collector efficiency and temperature elevation during the wet season
Figure 19 Comparison between CFD and experimental air temperature the for dry season
Figure 20 Comparison between CFD and experimental air temperature for wet the season
Air temperature values obtained by CFD were used to calculate CFD collector efficiency using Equation (12). Figure 21 and 22 showed the comparison between the collector efficiency calculated from experimental values and CFD. There were no significant differences between the collector efficiency calculated from experimental values and CFD by statistical t-test (p≤0.05).
Figure 21 Comparison between CFD and experimental collector efficiency for dry season
4 Conclusions
Different dimensions of a direct solar dryer have been considered and simulated at different fan speeds. The CFD approach helped to predict the performance of the dryer and could be used for further work on solar dryer. The numerical results obtained gave information on the possible performance of the dryer and has proven the dryer to be a viable alternative to open sun drying method and useful technology for fish preservation to increase shelf life. The predicted temperature and collector efficiency were validated with measured data and found to agree well with the measured data and within acceptable limit. From the result obtained, not very long exposure to solar radiation will be required to achieve temperatures high enough for fish drying when using this dryer. This implies that the dryer will be applicable in regions of fewer hours of sun shine.
References
Adeniyi, A., A. Mohammed, and K. Aladeniyi. 2012. Analysis of a solar dryer box with ray tracing CFD techniques. International Journal of Scientific and Engineering Research, 3(10): 1–5. Alamu, O. J., C. N. Nwaokocha, O. Adunola. 2010. Design and
construction of a domestic passive solar food dryer. Leonardo Journal of Science, 16: 1583–0233.
Al-Juamily, K. E. J., A. J. N. Khalifa and T. A. Yassen. 2007. Testing the performance of a fruit and vegetable solar drying system in Iraq. Desalination, 209(1-3): 163–170.
Arinze, E.A. 1983. Design and performance evaluation of a commercial size of a natural convectional solar dryer. Nigerian Journal of Solar Energy, 4: 106–120.
Bala, B. K., and M. R. A. Mondols. 2001. Experimental investigation on solar drying of fish using solar tunnel dryer. Drying Technology, 19(2): 247–436.
Ekechukwu, O.V., and B. Norton. 1999. Review of solar energy drying II: An overview of drying technology. Energy Conversation and Managmente, 40(6): 615–55.
Fagbenle, R. L. 1991. On monthly average daily extraterrestrial solar radiation for Nigeria latitudes. Nigeria Journal of
Renewable Energy, 22: 1–8.
Hossain, M. A., K. and B. M. A. Gottschalk. 2009. Mathematical modeling for drying of tomato in hybrid dryer. Arabian Journal for Science and Engineering, 35(2): 239–262B. Ingle, P. W., A. A. Pawar, B. D. Deshmukh, and K.C. Bhosale.
2013. CFD analysis of solar plate collector. International Journal of Emerging Technology and Advanced Engineering, 3(4): 337–342.
Irtwange, S. V. 1991. Design and development of a passive solar air heated poultry egg incubator. Unpublished Project. Nsukka: Department of Agricultural Engineering.
Janjai, S., N. Srisittipokakun, and B. K. Bala. 2008. Experimental and modelling performances of a roof integrated solar drying system for herbs and spices. Energy, 33(1): 91–103.
Kituu, G. M., D. Shitanda, C. L. Kanali, J. T. Mailutha, C. K. Njoroje, J. K. Wainaina, and V. K. Silayo. 2010. Thin layer drying model for simulating the drying of tilapia fish in a solar tunnel dryer. Journal of Food Engineering, 98(3): 325–331. Li, Z., D. Tang, J. Du, and T. Li. 2011. Study on the radiation flux
and temperature distributions of the concentrator–receiver system in a solar dish/Stirling power facility. Applied Thermal Engineering, 31(10): 1780–1789.
Maia, C. B., A. G. Ferreira, L. Cabezas-Gómez, S. D. M. Hanriot, and T. D. O. Martins. 2012. Simulation of the airflow inside a hybrid dryer. International Journal of Research and Review in Applied Science, 10(3): 382–389.
Mustayen, A.G. M B., S. Mekhilef, and R. Saidur. 2014. Performance study of different solar dryers: A review. Renewable and Sustainable Energy Reviews, 34: 463–470. Omitoyin, S. A., A. O. Ajiboye, D. O. Adeyemi, and B. Awoseyi.
2010. Enhancing food security through the use of solar fish driers. Wilolud Journals. Available at: http://www. wiloludjournal.com.
Oparaku, N., and O. Ojike. 2013. Studies on drying rates of brined and spiced Clarias gariepinus (Catfish) using solar dryer. International Journal of Physical Science, 8(30): 1551–1557. Sadodin, S., and T.T Kashani. 2010. Numerical investigation of a
solar greenhouse tunnel drier for drying of copra. arXiv preprint arXiv: 1102.2522.