A New Recommendation Method for the User Clustering-Based
Recommendation System
Aurimas Rapečka, Gintautas Dzemyda
Vilnius University, Institute of Mathematics and Informatics Akademijos str. 4, Vilnius, Lithuania
e-mail:[email protected], [email protected]
http://dx.doi.org/10.5755/j01.itc.44.1.5931
Abstract. The aim of this paper is to create a new recommendation method that would evaluate the peculiarities of user groups, and to examine experimentally the efficiency of user clustering in order to improve the recommendations. To achieve this goal, we have analysed recommendation systems (RS), their components, operating principles and data, used for accuracy evaluation. The proposed method is based on user clustering; therefore, clustering-based RS are reviewed. Finally, the proposed method is presented and tested with the most appropriate data set of all that discussed in the overview. The research has disclosed dependencies of the efficiency of recommendations on the number of clusters. The experimental results have shown that the proposed method can be applied to high density databases and the results of recommendations are better than those of traditional methods.
Keywords: recommendation systems; user clustering; user filtering algorithms; clustering-based recommendations.
1. Introduction
With a rapid development of technologies and the increasing number of internet users, more and more products and services are transferred into the virtual space. Various offers to buy something by means of internet or to use a certain service without leaving the house should save the client’s time. However, new problems occur here.
First of all, how to choose a product when the majority of the offered products are very similar and the client lacks experience? Secondly, how to find the necessary product among others, often unnecessary products? Recommendation systems (RS) are widely used to solve this problem. For a great number of algorithms, used for creating user’s recommendations, the data sets of users, products, and product evaluation by users are required [15]. These sets are widely accumulated in the internet shops and social websites where people have an opportunity to converse, share their opinions and, in that way, directly or indirectly evaluate products and services. Social networks store usually huge amounts of information, and that may negatively influence user social actions and reduce possibility to find useful information quickly, so recommendation systems are necessary here [27]. Thus, it is thought that internet shops and social networks are supposed to be the most useful medium for using RS.
The key aim of recommendation systems is to create new product recommendations or predict the relevance of product to a purposive consumer. In both cases, the recommendation creation process is based on the known features of a user.
The data of the estimates of products by users are important for decision making. That is the reason why big social websites and internet shops do not disclose them. However, the material of this type is available for analysis. We provide the following examples of data sets:
1. MovieLens movie evaluation database [11].
MovieLens database was developed in Minnesota University by the GroupLens project. Three sets are presented: 943 ratings by users for 1682 movies; in total 100000 evaluations; 6040 ratings by users for 3900 movies; in total 1000000 evaluations; 71567 ratings by users for 10681 movies; in total 10000000 evaluations. In addition, there are a basic users’ demographic statistics, e.g. user’s education, sex, and age. This database was used, e.g., in the research [17].
2. Epinions product evaluation database [7].
users, 123705 untrusted users), 13668319 evaluations of 1560144 products.
3. Book Crossing book evaluation database [2]. In this set, evaluations by 278858 users of 271379 books are stored (1149780 evaluations in total). The results of the research of the database in detail are published in [31].
4. Jester jokes evaluation database [16]. In this set, 73421 users evaluated 100 anecdotes. The scale of evaluation is [-10; 10]. About 1000000 of evaluations are performed. This database was used, e.g., in the research [10]. The experimental part of this paper is based on this database.
The average percentage of items that have been rated per user is called a density of the set [3]. The usual density is 1-5%, rarely may it be larger, e.g. the density of the Jester data set amounts to 50%.
The target of this paper is to create a new recommendation method, such that would evaluate the peculiarities of user groups, and to experimentally examine the efficiency of user clustering in order to improve the recommendations. The peculiarity of the proposed method is that it is oriented at the data sets with a higher density.
2. Basic principles of recommendation systems
Each RS has two subjects: the user and the product [29]. The subject, who is using this system and gaining new product recommendations about various products, is called an RS target user.
Consider 𝑚 as the number of users and 𝑛 as the number of products. Let us denote the set of users as
𝐴 = {𝑎1, 𝑎2, … , 𝑎𝑚} and the set of products as 𝐵 = {𝑏1, 𝑏2, … , 𝑏𝑛}. Each user 𝑎𝑖, 𝑖 = 1,2, … , 𝑚 , has
evaluated some set of products 𝐵𝑎𝑖, where 𝐵𝑎𝑖⊂ 𝐵 .
Evaluations by the user are expressed by a certain number. It means that the evaluation 𝑉𝑖𝑗by the user 𝑎𝑖
of the product 𝑏𝑗, 𝑗 ∈ {1,2, … , 𝑛} can acquire some
numerical value or remain empty if the product has not been evaluated by the user. Denote as 𝑉 = {𝑉𝑖𝑗, 𝑖 = 1, 𝑚
̅̅̅̅̅̅, 𝑗 = 1, 𝑛̅̅̅̅̅} the so-called user-item matrix of estimates of products by users. The user-item matrix of size 𝑚 × 𝑛 is formed from these evaluations.
Each RS has three different stages: input, filtering (discovering of groups of products), and output [29].
The input of data into RS depends on the RS filtering mechanism and is closely connected with the data mining methods. At the information filtering stage, RS creates new offers for the user, or checks the relevance of products to the user. The major part of the filtering algorithm analyses the rows that trace user’s evaluations of various products, and searches for similarities between the users for the same products. Based on the filtering results, in the output stage, RS generates the result for the target user. RS can give 2 types of outputs: prediction or recommendation [29]. Prediction is expressed by some number 𝑉(𝑏𝑗, 𝑎𝑁) ,
which means a predictive evaluation of the product 𝑏𝑗
by the target user 𝑎𝑁 , and the recommendation is
expressed as a set 𝑁𝑖 of products that should be the
most relevant to target user 𝑎𝑁, where𝑁𝑖⊂ 𝐵.
At this stage, a question often arises: how to determine the trustfulness of the recommendation, which is very important during empirical researches, when there is no opportunity to get the exact user’s feedback. Frequently, having the evaluation database, a part of evaluations is separated and used by RS for checking the results. Often 10-20% of evaluations are used for checking. This number allows us to evaluate the RS accuracy.
Various algorithms are used for the creation of recommendations. They are divided into two major groups: content-based and collaborative filtering-based methods [5]. The collaborative filtering-based methods are divided into two other subcategories: memory-based and model-memory-based methods [9]. Collaborative filtering- and content-based methods are discussed below more in detail.
Most of RS are based on the collaborative filtering method [29], [9]. This method is based on the user-item matrix, when searching for similarities among the users in the users’ evaluation history. The similarities between the users are calculated using Pearson’s correlation coefficient [24]:
𝑝(𝑔, 𝑟) = ∑ (𝑔(𝑝)−𝑔)(𝑟(𝑝)−𝑟)𝑝 √∑ (𝑔(𝑝)−𝑔)𝑝 2∑ (𝑟(𝑝)−𝑟)𝑝 2
. (1)
Here 𝑔 represents the user who gets a prediction, 𝑟
represents a user, whose similarity is checked compa-ring with the user 𝑔. The similarity is calculated using
𝑝 products, evaluated by both users 𝑔 and 𝑟 . 𝑔(𝑝) and r(p) are evaluations of the users 𝑔 and 𝑟 for a particular product 𝑝,respectively. 𝑔̅ and 𝑟̅ are averages of evaluations of all the products by the users 𝑔 and 𝑟, respectively. 𝑝(𝑔, 𝑟) always belongs to the interval [–1;1]. The users 𝑔 and 𝑟 are not similar, if 𝑝(𝑔, 𝑟) is near to 0.
After the calculation of similarities between the user
𝑔 and all the other users 𝑟 , the system generates a prediction for the new products 𝑗 by using Resnik’s prediction formula (2) [23]:
𝑔(𝑗) = 𝑔 +∑𝑟∈𝑅(𝑗)(𝑟(𝑗)−𝑟)𝑝(𝑔,𝑟)
∑𝑟∈𝑅(𝑗)|𝑝(𝑔,𝑟)| . (2)
This formula is used to predict a possible evaluation by the user 𝑔 of the product 𝑗 , which is not yet evaluated by this user, however it is evaluated by similar users. The subset 𝑅(𝑗)of similar users that will be used for generating a prediction is determined, depending on the values of Pearson’s correlation coefficients and specifics of the data set. Some threshold that restricts the similarities among the users is used to form the subset 𝑅(𝑗).
other words, RS enters the predicted evaluations by the users, who have not evaluated the product yet.
It is important to mention that the general filtering method allows creating predictions as well as re-commendations: despite the fact that the system only predicts the evaluation of the product, RS generates the recommendations based on the highest evaluations of some products by a particular user.
The researches, performed by using this method, indicate several problems and shortcomings. They are related to the accuracy of the estimated prediction:
1. The density of users’ evaluations in the use-item matrix is of low percentage. There are two most common ways to solve this problem: empty meanings are ignored, or they are filled with some meanings obtained e.g. as a result of some statistical analysis.
2. Since the evaluation history of a new user is too short or does not exist at all, it is difficult to define similar users. That is why the recommendations are very inaccurate or it is even impossible to recommend something to these users. The user himself can be involved in solving of this problem: during the registration process, he is asked to evaluate some product which he has already tried.
3. The majority of users are skeptical about the recommendations made by RS because they cannot understand the way used to generate those recommendations, and which users were selected to make those recommendations. To solve this problem, the user has a possibility to choose other users which he trusts and from whom he would like to get suggestions [12].
4. RS uses the information about the behavior of similar users, but the similar users have evaluated not enough products. RS always offers only products similar to those, which are evaluated by the target user or other similar users, and that reduces the number of offered products. However, RS cannot offer some products acceptable for that user, just because they have never been rated by similar users. This problem is often solved by a hybrid RS that joins RS based on the general filtering method, and that, based on the content. RS creates predictions and recommendations not only using the analysis of ratings. For example, feature extraction techniques aim at finding the specific pieces of data in natural language documents [14], which are used for creating profiles of both users and products. These profiles of users and products are then employed by a classifier for recommending resources. Improved technologies allow the analysis of the text documents that required a lot of technological resources earlier. One of the most common content-based methods is the Bayes method. It is assumed that this method can be used in the hybrid RS.
The main idea of the content-based recommenda-tion methods is to classify products on the basis of their features and to offer products to the target user, taking into account their known classes.
The Naive Bayes classifier is based on the Bayes theorem with a strong independence assumption and is
suitable for the cases with high input dimensions. Based on the Bayes theorem, the probability that the product 𝑑 can belong to the class 𝐶𝑗 is calculated as
follows:
𝑃(𝐶𝑗|𝑑) =
𝑃(𝐶𝑗)𝑃(𝑑|𝐶𝑗)
𝑃(𝑑) . (3)
There are four probabilities: posterior – (𝐶𝑗|𝑑) ,
likelihood – 𝑃(𝑑|𝐶𝑗) ,
prior (class)
– 𝑃(𝐶𝑗) ,and
evidence
–𝑃(𝑑).
Due to the fact that the features ofthe product are considered as independent and the product has many features 𝐹1, … , 𝐹ℎ, formula (3) may
be transformed into formula (4):
𝑃(𝐶𝑗|𝑑) =
𝑃(𝐶𝑗) ∏ℎ 𝑃(𝐹𝑖|𝐶𝑗)
𝑖=1
𝑃(𝐹1,…,𝐹ℎ) . (4)
Here, the class probability 𝑃(𝐶𝑗) can be calculated
by formula (5):
𝑃̂(𝐶𝑗) = 𝐵𝑗
𝐵, (5)
where𝐵𝑗 is the number of products, belonging to the
class 𝐶𝑗 , and 𝐵 is the total number of classified
products.
Using formula (4), the posterior probabilities of each class are calculated, and a new product is assigned to the class, where the posterior probability is the highest one [9]. It is convenient to use the Bayes method when the product has a vast variety of features. It is expedient to classify them using the most important features. However, it is difficult to distinguish more and less important features out of all the product features.
3. A review of user clustering-based RS
Based on the collaborative filtering, RS predicts the evaluations by target users for products and generates recommendations for these users rather precisely. However, the decision is based on the comparison of evaluations made by the target user, with that of the product evaluation data base, where the known evaluations of other users are stored, i.e. it is necessary to compare the target user with all the other users. Such a comparison takes a lot of computing time, when the number of users and products in the data set is large. This disadvantage is essential in online RSs, e.g. in the e-shops, where the recommendations should be generated in seconds.
One way to speed-up the generation of recommend-ations by users is clustering of data, stored in the user-item matrix 𝑉 = {𝑉𝑖𝑗, 𝑖 = 1, 𝑚̅̅̅̅̅̅, 𝑗 = 1, 𝑛̅̅̅̅̅} of the
to find similarities of some papers. One way is to group the papers using clustering methods [26].
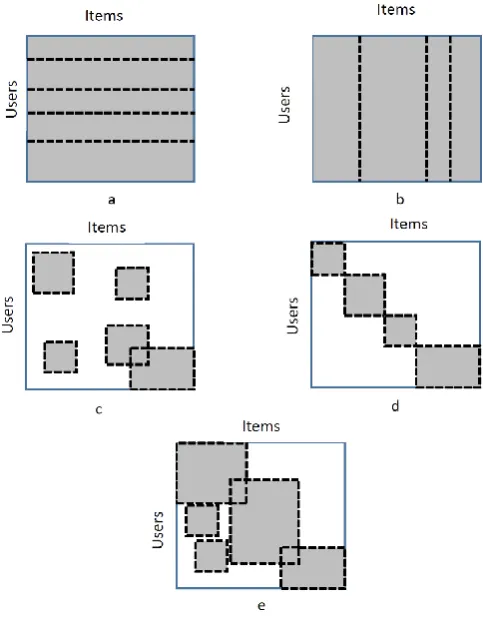
A cluster is a collection of data samples having similar features or close relationships. For the collaborative filtering task, clustering is often an intermediate process. The clustering methods for RS are classified into several different types in [30]. One way is to partition the users into distinct clusters [25]. O’Connor and Herlocker [22] use clustering algorithms to partition the set of items, based on the user rating data. Ungar and Foster [28] combine separate clustering of users and items. The three above algorithms are all one-sided clustering, either for users or items. Some other works consider the two-sided clustering method (see e.g. [6], [13]). These methods are called as co-clustering based collaborative filtering methods in [30], since their clustering strategies are traditional co-clustering, e.g., the key idea of [8] is to simultaneously obtain user and item neighborhoods via co-clustering and to generate predictions, based on the average ratings of the co-clusters, while taking the biases of users and items into account. In this case, each cluster covers some users and some items; all the users and items are covered by the clusters; the clusters are not intersecting.
One strict limitation of the co-clustering approaches as well as the above one-sided clustering approaches, as noted in [30], is that each user or item can be clustered into a single cluster only, whereas some recommendation systems may benefit from the ability of clustering users and items into several clusters at the
same time [1]. So, a multiclass co-clustering method is more reasonable. It allows each user and item to be in multiple subclusters at the same time, i.e., subclusters may have some overlaps.
In the biclustering method, which is well studied in the gene expression data analysis [4], [19], clusters always cannot cover all the rows and columns of the user-item matrix. Following [30], the clustering methods discussed above are presented graphically in Fig. 1, showing the coverage of the user-item matrix by clusters. A dotted line delineates the clusters; elements of the user-item matrix, covered by the clusters are presented in gray.
4. User clustering-based RS regarding the
inside-cluster distribution of product estimates
(CLUICE)
The idea of a new recommendation strategy (denote it by CLUICE) is a generation of recommendations by clustering users and taking into account the inside-cluster distribution of product estimates.
Suppose that we have a user-item matrix 𝑉 = {𝑉𝑖𝑗, 𝑖 = 1, 𝑚̅̅̅̅̅̅, 𝑗 = 1, 𝑛̅̅̅̅̅} of 𝑚 users 𝑎1, … , 𝑎𝑚 and 𝑛
products 𝑏1, … , 𝑏𝑛. Let the user evaluate products using
the integer number scale {𝑢𝑚𝑖𝑛, … , 𝑢𝑚𝑎𝑥}, consisting of 𝑛𝑢 elements 𝑛𝑢= 𝑢𝑚𝑎𝑥− 𝑢𝑚𝑖𝑛+ 1 . The meaning of 𝑉𝑖𝑗indicates the evaluation by the i-th user of the j-th
product. 𝑉𝑖𝑗 ∉ {𝑢𝑚𝑖𝑛, … , 𝑢𝑚𝑎𝑥}, if the i-thuser has not
evaluated the j-th product.
Let us consider the matrix 𝑉 = {𝑉𝑖𝑗, 𝑖 = 1, 𝑚̅̅̅̅̅̅, 𝑗 = 1, 𝑛
̅̅̅̅̅} as fully filled with the evaluations (it consists of the data about 𝑚 users, who have rated all the 𝑛
products). This matrix can be produced out of some available user-item matrix, where the number of users is larger than 𝑚, by picking the users, who rated 100% of products, and, in this way, to form a set of 𝑚 users who rated all the products. Thus, the CLUICE method is designed to generate recommendations, if the evaluation density of data is large enough. In this case,
𝑚 will remain large, too. Jester I, Jester II, and
Jester III [16] are the available data sets suitable to form the matrix 𝑉, that is fully filled with evaluations and whose 𝑚 is large.
Using the matrix 𝑉 , it is possible to classify the users into similar users’ clusters 𝐶1, 𝐶2, … , 𝐶𝑘 that
comprise a different number of users:
𝐶1= {𝑎11, 𝑎21, … , 𝑎𝑚1
1 } with 𝑚 1 users, 𝐶2= {𝑎12, 𝑎22, … , 𝑎𝑚22} with 𝑚2 users,
(...)
𝐶𝑘 = {𝑎1𝑘, 𝑎2𝑘, … , 𝑎𝑚𝑘𝑘} with 𝑚𝑘 users,
where 𝑚 = ∑𝑘𝑙=1𝑚𝑘 , 𝑎𝑖𝑙 is the 𝑖 -th user of the 𝑙 -th
cluster, 𝐴 = 𝐶1∪ 𝐶2∪ … ∪ 𝐶𝑘; 𝐶1∩ 𝐶2∩ … ∩ 𝐶𝑘= ∅.
Each cluster 𝐶𝑙, 𝑙 = 1, 𝑘, has a center:
𝑋𝑙= (𝑥1𝑙, … , 𝑥𝑛𝑙), 𝑥𝑗𝑙=
∑ 𝑉𝑖𝑗 𝑎𝑖∈𝐶𝑙
𝑚𝑙 , (6)
where 𝑚𝑙 is the number of users in the l-th cluster 𝐶𝑙.
The dimensionality of the cluster center is n because it is equal to the number of products.
When a new user (target user) 𝑎𝑁 joins the system, 𝑠 randomly selected products 𝑏𝑁1, 𝑏𝑁2, … , 𝑏𝑁𝑠 are
presented for his evaluation from the set of products
{𝑏1, … , 𝑏𝑛}. Here 𝑁𝑖 is the number of product order
between 1 to 𝑛; 𝑠 < 𝑛, and 𝑉𝑁= (𝑉𝑁𝑁1, … . , 𝑉𝑁𝑁𝑠) are
ratings of the products 𝑏𝑁1, 𝑏𝑁2, … , 𝑏𝑁𝑠 by the new user.
After obtaining the new evaluations 𝑉𝑁𝑁1, … . , 𝑉𝑁𝑁𝑠
of 𝑠 products 𝑏𝑁1, 𝑏𝑁2, … , 𝑏𝑁𝑠 , lower dimensional
cluster centers are selected in each cluster 𝐶𝑙, 𝑙 = 1, 𝑘̅̅̅̅̅,
based on the products 𝑏𝑁1, … , 𝑏𝑁𝑠 only:
𝑋𝑙𝑁= (𝑥𝑁1
𝑙 , … , 𝑥 𝑁𝑠
𝑙 ). (7)
The dimensionality 𝑁𝑠 of the cluster center here is
lower than n, because it is equal to the number of products 𝑁𝑠 evaluated by the user 𝑎𝑁.
Then the Euclidean distances
𝜌(𝑉𝑁, 𝑋𝑙𝑁) = √∑ (𝑉𝑁𝑁𝑖− 𝑥𝑁𝑖
𝑙 )2 𝑠
𝑖=1
, 𝑙 = 1, 𝑘̅̅̅̅̅ (8)
between the ratings 𝑉𝑁 and lower dimensional cluster
centers are calculated. The user 𝑎𝑁 is allocated to the
cluster, where the distance (8) is lower, i.e. 𝑎𝑁∈ 𝐶𝑙∗,
where 𝑙∗= 𝑎𝑟𝑔 min
𝑙=1,𝑘̅̅̅̅𝜌( 𝑉𝑁, 𝑋𝑙 𝑁).
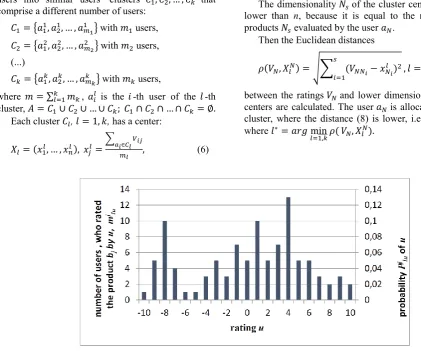
Figure 2. Example of the distribution of product rating in the cluster 𝐶𝑙
Afterwards, it is possible to offer the best rated pro-ducts to the user 𝑎𝑁 of the users from the cluster 𝐶𝑙∗.
Each product 𝑏𝑗. in the cluster 𝐶𝑙has the distribution
of rating, which shows how many users of the cluster
𝐶𝑙 provided the rating 𝑢 , 𝑢 ∈ {𝑢𝑚𝑖𝑛, … , 𝑢𝑚𝑎𝑥}, for
this product (see Fig. 2). The height of the column
𝑚𝑙𝑢𝑗 illustrates how many users of the cluster 𝐶𝑙defined
the rating u for the product 𝑏𝑗 . Note that
∑ 𝑚𝑙𝑢𝑗 = 𝑚𝑙 𝑢𝑚𝑎𝑥
𝑢=𝑢𝑚𝑖𝑛
.
Fig. 2 defines the function of the distribution den-sity of the particular rating 𝑢. The scale on the right side of Fig. 2 shows the probability that the users of the cluster 𝐶𝑙 will provide the evaluation 𝑢of the product
𝑏𝑗:
𝑃𝑙𝑢𝑗 = 𝑃(𝑉𝑖𝑗 = 𝑢, if 𝑎𝑖∈ 𝐶𝑙) = 𝑚𝑙𝑢𝑗
𝑚𝑙. (9)
Note that ∑ 𝑃𝑙𝑢𝑗 = 1 𝑢𝑚𝑎𝑥
Using formula (10), it is possible to calculate the average rating given by the users of the cluster 𝐶𝑙for
the product 𝑏𝑗:
𝑉̅𝑙𝑗= 1
𝑢𝑚𝑎𝑥−𝑢𝑚𝑖𝑛+1∑ 𝑃𝑙𝑢 𝑗 𝑢𝑚𝑎𝑥
𝑢=𝑢𝑚𝑖𝑛
𝑢. (10)
The product with the highest average rating in the cluster 𝐶𝑙 is recommended for the new user 𝑎𝑁. If this
product has already been offered for this user, then the system recommends the product with the second in size rating, and so on.
After the new user has evaluated the recommended product, the total number of his evaluated products increases, it means: 𝑠 = 𝑠 + 1.
The calculations above are repeated starting from formula (7), in which the evaluations of 𝑠 products by the new user are used to calculate the lower dimensional cluster centers in each cluster 𝐶𝑙, 𝑙 = 1, 𝑘̅̅̅̅̅,
based on the products 𝑏𝑁1, … , 𝑏𝑁𝑠.
After the new user has finished the work (after using and rating the offered or chosen products), the matrix 𝑉
is extended to a new row with the ratings of this user,
𝑚 = 𝑚 + 1.
5. Experiments
The method proposed to create recommendations is based on clustering of users. In order to get the optimal recommendations, it is necessary to determine the proper number of clusters 𝑘. The experimental research should disclose dependences of the recommendation efficiency on the number of clusters. In addition, this research should reveal whether the user classification is an acceptable way in the creation of recommendations to the new users.
The proposed method is based on the principle that the users from the same cluster are similar in their behaviour. So, the comparison of experiments without clustering (i. e. 𝑘 = 1) may be used for evaluating the advantages of clustering.
The flowchart of the experimental research contains four main items:
1. First Jester data set1 is used. The data of 24983
users, who have rated at least 36 products, are stored in this database. The database is presented in the form of a matrix, the rows of which correspond to different users. The first column shows how many products have been evaluated by a particular user, and other columns store the user’s evaluation of products in the interval [-10; 10]. The entries of the table are filled with meaning 99, if there is no evaluation of the product by the user. This database is exceptional due to a high density of evaluations (each user has evaluated a relatively high number of products). The density of evaluations amounts up to 50%, so each user has approximately evaluated 50 products out of 100. Moreover, 7200 users have rated all the 100
1http://goldberg.berkeley.edu/jester-data/jester-data-1.zip
products. Therefore, this database is very good for our experiments, because the clustering by the proposed method is based on the users, who have rated all the products.
2. The experiments, in this paper, are carried out on the basis of data of these 7200 users. These users are divided into two subsets:
a) the basic subset, consisting of 𝑚 users (in our case, 𝑚 = 6200);
b) the validation subset, consisting of 𝑚𝑣 users (in
our case, 𝑚𝑣= 1000).
3. The users from the validation subset are con-sidered as the new users, for which recommendations are generated. The known evaluations by these users allow us to estimate the efficiency of the proposed method. The decision on belonging of the new user to a particular cluster is based on 𝑠 new ratings by the new user. Then a recommendation of the new product is generated. The response of the users from the validation set to the recommended products is known.
4. In order to draw objective conclusions, calcu-lations that disclose the new user’s behaviour after rating the product 𝑠 , are done a lot of times and the average results obtained. Let us fix the value of 𝑠. Then, for each user from the validation set, 100 experiments were done with randomly selected product sets
{𝑏𝑁1, … , 𝑏𝑁𝑠}. The average of the results over all
ran-domly selected product sets and all users from the validation set is found out for different 𝑠 . Let us denote the average rating of the offered product
𝑠 + 1 over all the users by 𝑢̅𝑠+1 , when the ratings of
the previous 𝑠 products are known. The results, gained during the experiments, are presented in Fig. 3 and Table 1.
From the diagrams of Fig. 3, we see that in some starting interval 𝑠 ∈ [1, 𝑠𝑜𝑝𝑡] the meaning of 𝑢̅𝑠+1
is growing. Here 𝑠𝑜𝑝𝑡 = arg max
𝑠=1,𝑛−1̅̅̅̅̅̅̅̅𝑢̅𝑠+1 is such a
value of 𝑠 where 𝑢̅𝑠+1 is maximal. Denote the maximal
value of 𝑢̅𝑠+1 for all 𝑠 = 1, 𝑛 − 1̅̅̅̅̅̅̅̅̅̅ by 𝑢̅𝑚𝑎𝑥 . Here 𝑛
is the number of products, equal to 100 in this case. The maximal growth of 𝑢̅𝑠+1 is defined by 𝑢̅𝑚𝑎𝑥− 𝑢̅2.
The maximal growth increases with an increase in the number 𝑘 of the user clusters, however, the best result (the highest value of 𝑢̅𝑠+1 ) is obtained not
with the highest or lowest number of the clusters. Therefore, it is some optimal number of clusters. In the interval 𝑠 ∈ [ 𝑠𝑜𝑝𝑡, 𝑛 − 1] , we observe a decrease
of 𝑢̅𝑠+1 . In the case 𝑠 = 𝑛 − 1 , the value of 𝑢̅𝑠+1= 𝑢̅𝑛 becomes the average of ratings of all
the products of all the users. 𝑢̅𝑛 is the minimal value
for all 𝑠 = 1, 𝑛 − 1̅̅̅̅̅̅̅̅̅̅ . The exact value of 𝑢̅𝑛 in
this experiment is 1.066.
Table 1. Experimental results of the dependence on the number of clusters
𝒌 𝒖̅𝟐 𝒔∗ 𝒖̅𝒎𝒂𝒙 𝒔𝒐𝒑𝒕 𝒖̅𝒎𝒂𝒙− 𝒖̅𝟐 𝒖̅𝒏 𝒖̅𝒎𝒊𝒅
1 3,877 - 3,877 1 0,000 1,081 -
2 3,949 36 4,048 11 0,099 1,068 4,034
3 3,936 38 4,045 13 0,109 1,051 4,020
5 3,929 44 4,032 16 0,102 1,062 4,012
7 3,939 60 4,198 20 0,259 1,067 4,148
10 3,948 68 4,235 24 0,287 1,081 4,196
15 3,851 75 4,232 22 0,387 1,080 4,165
20 3,801 79 4,204 28 0,403 1,073 4,164
30 3,677 86 4,210 26 0,534 1,062 4,160
50 3,355 92 4,131 39 0,796 1,081 4,120
70 3,169 94 4,054 46 0,884 1,081 4,035
100 3,116 94 3,940 50 0,825 1,074 3,936
150 2,495 97 3,976 44 1,481 1,067 3,968
200 2,190 98 3,916 56 1,726 1,062 3,904
where 𝑢̅2= 𝑢̅𝑠∗ , i.e. where the decreasing value of
𝑢̅𝑠+1 becomes equal to the starting value 𝑢̅2 . Denote
the value of 𝑢̅𝑠+1 at the middle point of the interval 𝑠 ∈ [1, 𝑠∗ ] by 𝑢̅𝑚𝑖𝑑. This characteristic is presented in
Table 1 and may disclose some properties of 𝑢̅𝑠+1.
The results of Table 1 are summarized in Fig. 4. The dependence of 𝑢̅2, 𝑢̅𝑚𝑎𝑥 and 𝑢̅𝑛 on the number 𝑘
of clusters is presented in Fig. 4. The number of clusters is fixed in the logarithmic scale because of the necessity to observe the specifics of dependences on the large and small number 𝑘 of clusters.
It is easy to notice from Table 1 and Fig. 4 that the lowest 𝑢̅2 meaning (𝑢̅𝑠+1 meaning as 𝑠 = 1 ) is
ob-tained when the number of clusters is the largest one (in this case, 𝑘 = 200). It is possible that this meaning can be constantly decreasing with the growth of the number of clusters. The highest 𝑢̅2 values are obtained, when
the number 𝑘 of clusters belongs to the interval [2; 10]. However, the maximal values of 𝑢̅𝑠+1 are achieved, as 𝑘 ∈ [7; 30]. In all the cases, there is no need to choose a large number of clusters.
When we have a small amount s of the rated pro-ducts by the new user 𝑎𝑁, we cannot be quite sure that
the decision on a proper cluster is really good because of the instability of decision. However, when 𝑠 reaches a particular size, the cluster, which the user is assigned to, does not change. Such a cluster may be assumed to be optimal for a particular new user. It does not mean that low values of 𝑠 are not acceptable: there may appear suitable products with good ratings in other clusters, as well.
It follows from Fig. 3, that 𝑢̅𝑠+1 is growing until it
reaches the highest value and then it monotonously de-creases up to 𝑢̅𝑛, i.e. the average of all the users and all
the products. As mentioned above, 𝑠∗ indicates where
the decrement of the product rating becomes equal to the first one (𝑢̅2). It is the end point of 𝑠 interval, where
the clustering helps to get good results. This interval is
[1, 𝑠∗]. Table 1 indicates that this interval becomes
wider with an increase in the number of clusters. When the number of clusters is equal to 150 and more, 𝑠∗
be-comes close to the maximum possible 𝑠 value (𝑛 − 1). In the analysed example, 𝑠∗= 98, as 𝑘 = 200.
The maximal value 𝑢̅𝑚𝑎𝑥 of 𝑢̅𝑠+1 for all 𝑠 = 1, 𝑛 − 1
̅̅̅̅̅̅̅̅̅̅ varies depending on the number of clusters 𝑘.
In the analysed case (see Table 1), 𝑢̅𝑚𝑎𝑥 = 𝑢̅2= 3.877
as 𝑘 = 1, and 𝑢̅𝑚𝑎𝑥 = 𝑢̅12= 4,048 as 𝑘 = 2. It means
that the clustering allows us to get 4,5% of 𝑢̅𝑚𝑎𝑥
increase, when the number of clusters is 𝑘 = 2 . The highest 𝑢̅𝑚𝑎𝑥 value is achieved as 𝑘 ∈ [7; 30] . The
highest value (𝑢̅𝑚𝑎𝑥= 4,235) is achieved as 𝑘 = 10.
As compared with the case 𝑘 = 1 , we get here 9,2% increase of 𝑢̅𝑚𝑎𝑥.
The value 𝑠𝑜𝑝𝑡 of 𝑠, where 𝑢̅𝑠+1 is maximal (𝑢̅𝑚𝑎𝑥),
has a tendency to increase when the number of clusters
𝑘 is growing. As 𝑘 = 10 , 𝑢̅𝑚𝑎𝑥 is maximal. In this
case, the optimal 𝑠 is 𝑠𝑜𝑝𝑡= 24. Table 1 allows us to
conclude that 𝑠𝑜𝑝𝑡 ∈ [20; 28] , if we want to get the
largest 𝑢̅𝑚𝑎𝑥. It means that the best results are obtained
when the ratings of products of the new user include about 25% of all the existing products.
The maximal growth of 𝑢̅𝑠+1 , defined by 𝑢̅𝑚𝑎𝑥− 𝑢̅2, increases with an increase in the number 𝑘 of
clus-ters. If 𝑘 = 1, 𝑢̅𝑚𝑎𝑥 = 𝑢̅2, that is why 𝑢̅𝑚𝑎𝑥− 𝑢̅2= 0,
but if 𝑘 = 200, 𝑢̅𝑚𝑎𝑥− 𝑢̅2= 1,726. It means that, if 𝑘
is higher, it is required to have more ratings 𝑠 of pro-ducts from the new user in order to reach 𝑢̅𝑚𝑎𝑥. In our
case, 𝑢̅𝑚𝑎𝑥 33.916, 𝑠𝑜𝑝𝑡 356, 𝑢̅2= 1.726 , as 𝑘 = 200 .
Since 𝑢̅𝑚𝑎𝑥as 𝑘 = 200 is higher than 𝑢̅𝑚𝑎𝑥, as 𝑘 = 1,
about 1% only, we can see that a large number of clus-ters is not effective.
The experimentally obtained values of 𝑢̅𝑛 are
The value of 𝑢̅𝑠+1 at the middle point of the interval 𝑠 ∈ [1, 𝑠∗] is not coincident with 𝑢̅
𝑚𝑎𝑥, however, it is
similar. Therefore, such a property of the middle point
may be useful in constructing faster algorithms for seeking approximate 𝑠𝑜𝑝𝑡.
Figure 3. Dependence of the average rating 𝑢̅𝑠+1 of the offered (𝑠 + 1)-st product on the number 𝑘 of clusters
Figure 4. The dependance of 𝑢̅2, 𝑢̅𝑚𝑎𝑥 and 𝑢̅𝑛 on the number of clusters 𝑘
6. Conclusions
In this paper, the new method of recommendations is created to evaluate specific user groups. The efficiency of the application of the user clustering is examined and evaluated with a view to improve the recommendations.
In order to get the best recommendations, it is necessary to set the optimum number 𝑘 of users’ clusters. In the case of one cluster ( 𝑘 = 1 , no clustering), we assume that all the users are similar. Therefore, such case may be considered as a datum-level to evaluate the experimental results, where similar users are clustered.
The experimental research with first Jester database has shown that the optimum number 𝑘 of clusters here belongs to the interval [7;30]. The best result is gained as 𝑘 = 10, where the maximal average rating 𝑢̅𝑚𝑎𝑥 of
the offered product over all the users increases up to 9,2%, as compared with the case 𝑘 = 1, i.e. when there is no clustering.
The best recommendations are obtained when the history of the new user’s evaluations of products contains 25% of all the products in the database.
The essential increase in the number of clusters is not reasonable. If 𝑘 = 200 clusters are used, the maximal average rating 𝑢̅𝑚𝑎𝑥 of the offered product
over all the users is only by 1% higher than that in the case where there is no clustering.
The evaluation of peculiarities of user groups, using the user clustering, improves the recommendations. The research has disclosed dependencies of the efficiency of recommendations on the number of clusters. The optimal number of clusters is different for various databases. However, the character of dependencies remains similar.
Acknowledgements
This work has been supported by the project ‘Theoretical and engineering aspects of e-service
technology development and application in high-performance computing platforms’ (No. VP1-3.1-ŠMM-08-K-01-010), funded by the European Social Fund.
The authors would like to thank the Referee for his valuable comments and suggestions to improve the quality of the paper.
References
[1] G. Adomavicius, A. Tuzhilin. Toward the next gene-ration of recommender systems: A survey of the state-of-the-art and possible extensions. IEEE Transactions on Knowledge and Data Engineering, 2005, Vol. 17, No. 6, 734-749.
[2] Book Crossing Dataset, http://www.informatik.uni-freiburg.de/~cziegler/BX.
[3] J. Canny. Collaborative filtering with privacy via factor analysis. In: SIGIR '02 Proceedings of the 25th Annual International ACM SIGIR Conference on Research and Development in Information Retrieval, Tampere, Finland, 11-15 August, 2002, pp. 238-245.
[4] Y. Cheng, G. Church. Biclustering of expression data.
In: Proceedings of International Conference on
Intelligent Systems for Molecular Biology, La Jolla, USA, 16-23 August, 2000, pp. 93-103.
[5] M. K. Condliff, D. Lewis, D. Madigan. Bayesian mixed-effects models for recommender systems. In: ACM SIGIR’99 Workshop on Recommender Systems: Algorithms and Evaluation, Berkley, USA, 19 August, 1999, http://www.csee.umbc.edu/~ian/sigir99-rec/pa-pers/condliff_m.ps.gz.
[6] I. Dhillon. Co-clustering documents and words using bipartite spectral graph partitioning. In: Proceedings of the Seventh ACM SIGKDD International Conference on Knowledge Discovery and Data Mining, New York, USA, 2001, 269-274.
[7] Epinions Product Evaluation Database, http://www. trustlet.org/wiki/Epinions_dataset.
[9] M. Ghanzafar, A. Prugel-Bennett. An improved switching hybrid recommender system using Naive Bayes classifier and collaborative filtering. In: The 2010 IAENG International Conference on Data Mining and Applications, Hong Kong, 17-19 March, 2010, pp. 493-502.
[10] K. Goldberg, T. Roeder, D. Gupta, C. Perkins.
Eigentaste: A constant time collaborative filtering Algorithm. Information Retrieval, 2001, Vol. 4, No. 2, 133-151.
[11] MovieLens Database, http://www.grouplens.org/data-sets/movielens.
[12] R. Guha. Propagation of trust and distrust. In: Proceedings of WWW'04 Conference, New York, USA, 17-22 May, 2004, pp. 403-412.
[13] T. Hofmann, J. Puzicha. Latent class models for collaborative filtering. In: Proceedings of Sixteenth International Joint Conference on Artificial Intelligen-ce, Stockholm, Sweden, 31 July – 6 August, 1999, pp. 688-693.
[14] D. Isa, L. H. Lee, V. Kallimani, R. Rajkumar. Text Document pre-processing using the Bayes formula for classification based on the vector space model. Computer and Information Science, 2008, Vol. 1, No. 4, 79-90.
[15] M. E. M. Jamali. Using a trust network to improve Tom-N recommendation. In: RecSys '09 Proceedings of the Third ACM Conference on Recommender Systems, New York, USA, 25-28 October, 2009, 181-188. [16] Jester Dataset, http://goldberg.berkeley.edu/jester-data. [17] J. J. Jung. Attribute selection-based recommendation framework for short-head user group: An empirical study by MovieLens and IMDB. Expert Systems with Applications, 2012, Vol. 39, No. 4, 4049-4054. [18] H. Liu, E.-P. Lim, H. W. Lauw, M.-T. Le, A. Sun,
J. Srivastava, Y. A. Kim. Predicting trusts among users of online communities – an Epinions case study.
In: Proceedings of the 9th ACM Conference on
Electronic Commerce, Chicago, USA, 8-12 July, 2008, pp. 310-319.
[19] S. Madeira, A. Oliveira. Biclustering algorithms for biological data analysis: a survey. IEEE/ACM Transac-tions on Computational Biology and Bioinformatics, 2004, Vol. 1, No. 1, 24-45.
[20] P. A. P. Massa. Trust-aware bootstrapping of recom-mender systems. In: Proceedings of ECAI 2006 Work-shop on Recommender Systems, Riva del Garda, Italy, 28 August – 1 September, 2006, pp. 492-508.
[21] S. Meyffret, E. Guillot, L. Medini, F. Laforest. RED:
a Rich Epinions Dataset for Recommender Systems, http://liris.cnrs.fr/Documents/Liris-5787.pdf.
[22] M. O’Connor, J. Herlocker. Clustering items for collaborative filtering. In: Proceedings of the ACM SIGIR Workshop on Recommender Systems, Berkley, USA, 25-26 August, 1999, http://www.csee.umbc. edu/~ian/sigir99-rec/papers/oconner_m.pdf.
[23] J. O'Donovan, B. Smyth. Trust in recommender sys-tems. In: IUI '05 Proceedings of the 10th International Conference on Intelligent User Interfaces, San Diego, USA, 9-12 January, 2005, pp. 167-174.
[24] A. M. Rashid. ClustKNN: A highly scalable hybrid model and memory based algorithm. In: Proceedings of Workshop on Web Mining and Web Usage Analysis, Philadelphia, USA, 20-23 August, 2006, http://glaros. dtc.umn.edu/gkhome/fetch/papers/clustKNN.pdf. [25] B. Sarwar, G. Karypis, J. Konstan, J. Riedl.
Recom-mender systems for large-scale e-commerce: Scalable neighborhood formation using clustering. In: Procee-dings of the Fifth International Conference on Compu-ter and Information Technology, Dzhaka, Bangladesh, 21-23 September, 2002, http://files.grouplens.org/pa-pers/sarwar_cluster.pdf.
[26] P. Stefanovič, O. Kurasova. Creation of text document matrices and visualization by self-organizing map. Information Technology and Control, 2014, Vol. 43, No. 1, 37-46.
[27] L. Tutkute, R. Butleris, T. Skersys. An approach for the formation of leverage coefficients-based recom-mendations in social network. Information Technology and Control, 2008, Vol. 37, No. 3, 245-254.
[28] L. Ungar, D. Foster. Clustering methods for collabora-tive filtering. In: Proceedings of The Fifteenth National Conference on Artificial Intelligence (AAAI-98), Madison, USA, 26-28 July, 1998, http://www.ece.nwu. edu/~harsha/Clustering/collaborative_clus.ps.
[29] E. Vozalis, K. G. Margaritis. Analysis of recomme-nder systems algorithms. In: Proceedings of the 6th Hellenic European Conference on Computer Mathema-tics & Its Applications, Athens, Greece, 25-27 Septem-ber, 2003, pp. 5-19.
[30] B. Xu, J. Bu, C. Chen, D. Cai. An exploration of im-proving collaborative recommender systems via user-item subgroups. In: Proceedings of WWW 2012 Confe-rence, Lyon, France, 16-20 April, 2012, pp. 21-30. [31] C. N. Ziegler, S. M. McNee, J. A. Konstan,
G. Lausen. Improving recommendation lists through topic diversification. In: Proceedings of the 14th International Conference on World Wide Web, Chiba, Japan, 10-15 May, 2005, pp. 22-32.