© Strojniški vestnik (44) št. 1-2, str. 29-34, 1998 Tiskano v Sloveniji. Vse pravice pridržane. UDK 658.562:311.42
Strokovni članek
© Journal o f Mechanical Engineering (44) No. 1 -2, pp. 29-34, 1998 Printed in Slovenia. All rights reserved.
SV:0039-2480(98)1-R3 UDC 658.562:311.42
Speciality paper
Postopek MPC za nadzor proizvodnih procesov
MPC Process Control Procedure
MARJAN DRUŽOVEC - ADOLF SOSTAR - ANDREJ GODINA
Proizvodi in proizvodni procesi so pogosto pod vplivom različnih sprememb, za katere moramo poiskati vzroke in jih odpraviti. Statistične nadzorne karte (SPC) lahko zaznavajo vplive, ki motijo proizvodni proces. V nasprotju z dobrimi rezultati nadzora proizvodnih procesov s statističnimi nadzornimi kartami te z gospodarskega vidika niso zmeraj najustreznejša izbira, posebej pri maloserijskih proizvodnjah. Kot alternativa se ponuja postopek Precontrol, ki pa ima v primerjavi z metodo SPC tudi nekaj pomanjkljivosti. V našem prispevkuje podana modifikacija Precontrol, imenovana MPC, ki ohranja pozitivne lastnosti Precontrol in se po učinkovitosti približa SPC.
Ključne besede: procesi proizvodni, nadzor procesov, SPC, Precontrol, karte kontrolne statistične
Product and production processes are always subject to a certain number o f variations for which we must discover a reason and correct it. Statistical process control (SPC) charts have the ability to indicate the presence ofspecial causes that upset our processes. In spite o f the generally good results in supervising the production processes the statistical control charts are economically not always a very good decision especially in a low series production. Precontrol as a much simpler alternative method has, however some weaknesses in comparison with the SPC. In our paper we present a modification o f Precontrol, called the MPC method, which keeps all the benefits o f Precontrol with an efficiency which is nearly as that good as o f SPC.
Keywords: production processes, process control, SPC, Precontrol, statistical control chart
0 UVOD 0 INTRODUCTION
P roizvodi in pro izv o d n i procesi so izpostavljeni različnim vplivom, ki so rezultat naključij. Spremembe znotraj stabilnih mej naključ nih vzrokov so neizbežne. Če začne proces delovati zunaj določenih stabilnih mej, želimo čimprej poda tek o pomiku ali spremembi. Ko imamo indikacijo o pomiku procesa zunaj stabilnih mej ali o spremembi, imamo možnost odkriti vzrok in ga odpraviti.
Statistični nadzor procesov (SPC) spada med temeljna orodja za nadzor proizvodnih procesov, s katerimi zaznavamo motnje v procesih. SPC karte omogočajo vizualno ocenitev procesa glede na njegov položaj p in raztros cr, kar om ogoča zaznavanje, diagnozo in odpravljanje proizvodnih problemov v čim krajšem času. Rezultat je neprestano izboljševanje kakovosti proizvodnje. N adzor proizvodnih procesov s statističnimi nadzornimi kartami daje v splošnem dobre rezultate, glavne pomanjkljivosti pa so:
- veliki stroški uvajanja zaradi urjenja osebja in vodenja dokumentacije,
- niso primerne v maloserijski proizvodnji, ker majhni vzorci niso ustrezni za statistično oceno raztrosa procesa in njegove pozicije.
Precontrol je alternativni postopek za k rm iljen je procesov, ki je v prim erjavi z regulacijskimi nadzornimi kartami preprostejša za učenje in zahteva bistveno manj napora za uporabo. Osnova za določitev mej pri krmiljenju procesa sta zgornja in spodnja tolerančna meja, ki ju je določil konstrukter. Za krmiljenje procesa je treba tolerančno območje razdeliti na štiri enaka območja. Srednji dve
Products and production processes are always subject to a certain umber of variations as a result of chance alone. Variation within a stable pattern o f chance causes is inevitable. If our process begins to operate outside this stable pattern, we want to know about this shift or upset as soon as possible. Once we have an indication of a shift outside a stable pattern o f variation, we must discover the reason for the shift and correct it.
Statistical process control (SPC) charts were introduced as one o f the fundamental tools for supervising the production processes. These charts have the ability to indicate the presence of special causes that upset the processes. The SPC chart enables visual assessment of a process with regard to its location p and dispersion er and so helps to detect, diagnose, and correct production problems in a tim ely fashion. The result is a substantial improvement in product quality. A supervision of the production processes with statistical control charts yields generally good results. Their main weaknesses are:
- high expenses, especially for training and education of staff and for documentation,
- they are not convenient for low series production because low lot sizes are not an appropriate base for statistical assessment of process dispersion and its location.
označimo kot “zeleni coni” in obe zunanji kot “rumeni coni” . Coni zunaj tolerančnih mej se im enujeta “rdeči coni” . Pred začetkom serije potrebujemo vzorec petih izdelkov, med proizvodnjo pa vzorec dveh izdelkov, zajetih v izbranih intervalih. Očitno je, da so za nadzor procesov potrebni manjši vzorci kakor pri SPC. Prednosti v primeijavi s SPC lahko strnemo v naslednje točke:
- preprostejše uvajanje, - primerna je za manjše serije, - zahteva manj šolanja izvajalcev, - manjši investicijski stroški.
V prim erjavi s statističnimi nadzornimi kartami pa ima Precontrol naslednje pomanjkljivosti: - velika verjetnost za uspešen predtek pri procesu,
ki za proizvodnjo ni primeren,
- majhna občutljivost na spremembo procesa. Glede na n aštete la stn o sti postopka P recontrol bi bilo zaželeno izvesti določene spremembe, ki bi ohranile prednosti in zmanjšale njegove pomanjkljivosti. Obstajajo številne možnosti modificiranja postopka Precontrol, npr. spreminjanje širine pasov in povečanj e števila pasov v tolerančnem območju. S tem p a je seveda povezana tudi sprememba postopka izvajanja nadzora. Zato je pri modifikacijah potrebna previdnost, da dobljeni potopek ne bi postal preveč zapleten in bi bila osnovna ideja karte Precontrol, torej preprosta uporaba, izničena. N aša modifikacija postopka Precontrol v postopek MPC je bila izvedena za: - povečanje občutljivosti na spremembe procesa, - ohranitev primerljivosti krmiljenja procesa s SPC, - ohranitev preprostosti osnovne zamisli kakor pri
postopku Precontrol.
Precontrol MPC
“green” and the two others the “yellow” zones. The area outside the specification width is called the “red” zone. Before starting the series, five units have to be taken out of the process. During running production two units were taken out in intervals with flexible rhythm. Evidently the Precontrol needs low lot sizes for the process control, as does SPC. The benefits of the Precontrol in comparison with the SPC are: - less effort required for implementation, - convenient for low series production, - less training needed for workers, - lower investment costs.
Precontrol has also some disadvantages compared to SPC:
- the probability of acceptance of the process before starting the series is relatively high if the process is not capable,
- low sensitivity for process variations.
According to the listed characteristics of Precontrol it is clear, that a modification is needed which would keep the benefits and eliminate the disadvantages. There are many possibilities for modifying the Precontrol, from changing the width of the zones to increasing the number of the zones. In the latter case the control procedure must be changed. All modifications must be done very carefully so that the new method doesn’t become too complicated to fulfil the rudimentary ideas about the simplicity of the Precontrol. Our modification called MPC follows the next goals:
- to increase sensitivity to process variations, - to sustain the efficiency of the MPC comparable
to that of the SPC,
- to sustain the simplicity of the MPC comparable to the Precontrol.
YU
GU
GL
YL
USL
CL
LSL
YU GU
GL
YL
R - rdeča/ red Y - rumena / yellow
G - zelena / green
USL - zgornja tolerančna meja : upper specification LSL - spodnja tolerančna meja
tower specification CL - srednja vrednost
central value YU - zgornja ''rumena'1 meja
upper "yellow1' limit YL - spodnja "rumena" meja
lower "yellow" Umit GU - zgornja "zelena" meja
upper "green" limit GL - spodnja "zelena'' meja
tower "green" limit
Sl. 1. Razdelitev con postopkov Precontrol in MPC
Fig. 1. Zones for Precontrol and MPC methods
1 MPC - MODIFICIRAN POSTOPEK PRECONTROL
Pri snovanju postopka MPC je bilo razis kanih precej različnih variant, tudi takšne z večjim številom “barvnih con” znotraj tolerančnega območja. Glede na občutljivost in učinkovitost so bili rezultati zelo dobri. Pomanjkljivost teh variant
1 MPC - MODIFIED PRECONTROL METHOD
je povečanje števila pravil za posege v proces. S tem tretji cilj po preprostosti metode ni bil najbolje izpolnjen. Zato smo se pri snovanju MPC odločili, da kljub nekoliko slabšim rezultatom ohranimo enako število con kakor pri potopku Precontrol. Spremenili smo samo meje con, medtem koje krmiljenje procesa podobno kakor pri postopku Precontrol.
occupy the zones also increased on account of the higher number of the zones. Because o f this the aim of improving simplicity of the MPC method was only partially fulfilled. Finally, in spite of the slightly worse result, we decided to keep the three zones to account for simplicity. We changed the zone limits, while the procedure remained much the same as for the Precontrol.
1.1 Postopek MPC
Za izvajanje MPC je treba tolerančno območje med LSL in USL razdeliti na 6 enakih območij, kakor prikazuje slika 1. Enako kakor pri prej opisanem Precontrolu razglasimo notranja pasova kot “zeleni”, sosednja kot “rumeni”, celotna pasova na zunanji strani rumenih con pa sta “rdeči coni”. Krmiljenje procesa s karto MPC poteka v dveh korakih.
- P redtek. Za predtek je treb a prev eriti 6 zaporednih izdelkov. Če sta veličini največ dveh izdelkov v “rumeni coni” in druge v “zeleni coni”, je proces primeren (proces je centriran in raztros je v dovoljenih mejah) in lahko preidemo na proizvodni tek. V nasprotnem primeru proces ni pod nadzorom in je treba izvesti ukrepe za izboljšanje procesa in ponoviti predtek.
- Proizvodni tek. Za krmiljenje procesa izberemo dva zaporedna izdelka v izbranih intervalih in izmerjene veličine vnesemo v karto MPC. Proces ustavimo, če je en izdelek v “rdeči coni” ali pa oba v “rumeni” . Odpraviti je treba vzrok za nepravilnost in ponoviti predtek. V vseh drugih primerih (nobena v rdeči coni ali vsaj ena v zeleni coni) nadaljujemo s proizvodnim tekom.
1.2 Funkcija operacijske karakteristike
Primernost karte MPC za odkritje premikov v kakovosti procesa prikazuje krivulja operacijske karakteristike (OC) karte. Za ocenitev učinkovitosti kart bomo prikazali krivulje OC za MPC, Precontrol in karte SPC, uporabljene za nadzor procesov.
Predpostavimo, daje indeks primernosti procesa c :
znan in konstanten. Če se srednja vrednost procesa premakne z nadzorne vrednosti, npr. s srednje vrednosti CL na novo vrednost:
1.1 MPC procedure
The elementary division of the specification width between upper specification USL and lower specification LSL for MPC is into six equal intervals (Fig. 1). The “green” zone occupies the middle two intervals and the “yellow” zone occupies the adjacent two intervals, as presented in figure 1. The two outside intervals and the whole area outside the specification limits present the “red” zone. MPC control procedure is described by the following steps. - T rial run. B efore startin g the series, six successive units have to be taken out o f the process. In case that at the most two units are inside the “yellow” zone, while all other units are inside the t<rgreen” zones, the process is accepted as quality capable (distribution is narrow and centred). So, it is possible to change over to
f
»reduction run procedure. If more than two units ie in the yellow or even the red zone, the machine should be checked and adjusted, and the trial run repeated.- Production run. During running production two units have to be taken out at intervals with a flexible rhythm. The process is stopped if two units are red, red and yellow, or both yellow. The cause for this deviation has to be removed and the trial run must be repeated. In all other cases (none unit in red zone, and at least one unit in green zone) the production run procedure is continued.
1.2 The Operating-Characteristic Function
The ability of the MPC chart to detect shifts in process quality is described by their operating characteristic (OĆ) curves. To estimate efficiency we present these OČ curves for MPC, Precontrol and SPĆ charts used for on-line control of the process.
Consider the process-capability index c :
: - LSL
I T - m
known and constant. If the mean shifts from the in control value, say CL (centre line) to another value:
ju = CL + d ■ (USL - LSL)/2 (2)
je verjetnost, da bo vzorec x v “zeleni” coni Pg in v the probability of the sample x inside the “green” “rumeni” Py za MPC in Precontrol: zone Pg and “yellow ” zone Py for MPC and
Precontrol is:
Pg = P{GL < x < G U}
Py = P{YL < x < Y U ) - Pg
meja. Enačbo (3) lahko zapišemo kot:
Pg = o\
We may write eq. (3) as:
G U - f ì \ j G L - M
Py = <J>
<J
( Y U - j u
cr - 0
Y L - /u
~Pg
Funkcija 0 (.) je standardna normalna kumulativna F unction 0 ( .) denotes the standard norm al distribucijska funkcija: cumulative distribution function:
l (x-M)'
P{ x < a j = Oj
a - j u
\
1Ker je iz (1):
cr J - o o cr • -J~27T
Considering (1):
■dx
( U S L - L S L ) / 2 = 3 - c ■ cr
lahko zapišemo sredjo vrednost n iz (2) kot: the mean /j. in (2) is:
p = CL + 3 - d - c p cr
‘barvne” meje za MPC so potem: the “colour” limits for MPC are:
G Um =C L + 1/3 ■ (USL - LSL)/2 = CL + cp - a GLm = C L - 1/3 • ( USL - LSL )/2 = C L - c p - a Y U M = C L + 2 / 3 - ( U S L - L S L ) / 2 = CL + 2 - c p - a
YLm = C L - 2/3 ■(USL - LSL)/2 = C L - 2 - c p - a
(5).
(6),
(7),
(8),
za postopek Precontrol pa: and the colour limits for Precontrol are:
G U P — CL + 1/2 ■ (USL - LSL)/2 = CL +1.5 ■ cp ■ cr
GLP = C L - 1/2 • (USL - LSL)/2 = C L - 1 . 5 - c p o
YU p = CL + (USL - LSL)/2 - CL + 3 ■ c p cr
YLP = C L - (USL - LSL)/2 = C L - 3 - c
-a
(9).
Glede na (7) do (9) zapišemo (4) za MPC: According to (7) to (9) we write (4) for MPC as:
PgM = ® ( c p - 3 - d - c p ) - ® ( - c p - 3 - d - c p )
P y M = ® ( 2 - c p - 3 - d - c p ) - 0 ( - 2 - c p - 3 - d - c p ) ~ P g M
in za postopek Precontrol: and for Precontrol as:
Pgp = 0 ( 1 . 5 -cp - 3 - d - c p ) - 0 ( - 1 . 5 - c p - 3 - d - C p )
P y p = 0 ( 5 • cp - 3 - d - c p ) - 0 ( - 3 - c p - 3 - d - c p ) ~ P g p
Tako lahko izračunam o verjetn o st uspešnega Now, we can compute the probability of a successful predteka PtM za MPC in Ptp za Precontrol:
(10)
(
11).
trial run Pt.,M for MPC and PtDP for Precontrol:
P tp = ( P g p )
Pt M =( Pg M) 6 +6 - ( Pg M)5 -PyM +15- ( PgM)4 - ( PyMy
(12)
in nadaljevanje procesa PM za MPC in Pp za and also the probability of a successful process run
Precontrol: PM for MPC and Pp for Precontrol:
PM =( PgM) + 2 ' PgM- PyM
P p = ( P g p ) 2 + 2 - P g p - P y P (13).
Verjetnost uspešnega procesa pri SPC je:
PSPC = P{LCL < x < UCL) = 0
The probability of a successful run for SPC is:
\ ( \
UCL - n
V
cr,
■/■sTn-0 L C L - n
Ker sta pri SPC zgornja in spodnja kontrolna meja: Since the upper and low er control lim its are:
UCL = CL + 3 ■ <j/4n
LCL = C L - 3 ■ ( j / J n
lahko (1 4 ) zapišem o kot: w e m ay w rite (14) as:
Pspc =
0^5
- 3 - 4 n - c p ‘d^~
®(-5 -
3 - 4 n - c p -d
j
(15) ,
(16) ,
kjer je n število enot v vzorcu.
Oglejmo si uporabo enačb (10) do (13) in ( 16) na primeru izračuna verjetnosti odkritja premika na novo vrednost /u = CL + d - (USL - LSL)/ 2 pri prvem vzorcu. P t^ Ptp, P ^ Pp in P so verjetnosti, da premika ne odkrijemo (napaka (3). Krivulja OC prikazuje napako ß glede na velikost premika d za različne karte.
where n is the number o f units in the sample. To illustrate the use of Equations (10) to ( 13) and (16) suppose we w ish to determ ine the p ro b ab ility o f d e tectin g a sh ift to
u = CL + a ■ (USL - LSL)/ 2 on the first sample following the shift. The Pthp Ptp, P ^ Pp and P are the probabilities of not detecting such a shift, also called ß-risk. The OC curve for the different charts plots the ß-risk against the magnitude of shift d.
1.3 Analiza MPC 1.3 Analysis of MPC
Za ocenitev učinkovitosti predteka in proizvodnega teka so na slikah 2 in 3 podane krivulje operacijskih karakteristik. Diagram i na slikah podajajo verjetnosti, da bo proces označen kot ustrezen za posamezne premike vrednosti p med srednjo vrednostjo CL in zgornjo toleranco USL. Velikost premika je določena z vrednostjo veličine
d, ki se giblje med 0 in 1.
N a sliki 2 so podani grafi verjetnosti uspešnega predteka MPC in Precontrol za procese s faktorjem primernosti c = 1, c = 1,33, c =1,66 in
c = 2. Iz diagramov je razvidno, daje zaPcentrirane procese pri karti MPC verjetnost, da bodo sprejeti, nekoliko večja kakor pri uporabi Precontrol. Pri necentriranih procesih je verjetnost sprejetja pri obeh kartah približno enaka.
Krivulje operacijskih karakteristik za SPC, MPC in Precontrol za proizvodni tek za procese s faktorjem primernosti c = 1, c = 1,33, c =1,66 in
c = 2 so prikazane na sliki 3. Krivulja za StlPC podaja primer, ko je za statistični nadzor procesa v vzorcu
E
et kosov. S slike je razvidno, da je karta MPC istveno bolj primerljiva s SPC kakor postopek Precontrol.Some operating characteristic curves to estim ate the efficiency o f the trial run and of production runs are presented in Figures 2 and 3. The graphs in the figures present the probabilities that the process will be accepted as quality capable for different process shifts of mean p between central line CL and upper specification USL, while d has a value of between 0 and 1.
The graphs in F igure 2 p resen t the probability of acceptance for MPC and Precontrol in a trial run for processes with process capability index c = \ , c = 1.33,c = 1.66 and c =2. According to the graphs die probability of acceptance for centred processes using MPC is a little greater than when using Precontrol. M eanwhile the probability of acceptance for shifted processes is nearly equal for both methods.
The operating characteristic curves for SPC, MPC and Precontrol in production run are presented in Figure 3 for processes with capability index
c = 1, cp = 1.33, cp = 1.66 and c = 2. The example for SPC is based on five units per sample. The graphs clearly show that the MPC method is much more comparable to SPC than is the Precontrol.
SI. 2. Krivulje operacijske karakteristike za pr ed tek
Cp-1.33
—♦— SPC — Pre contro I
S-4;
' • sMPC
\
V
\V V
V
0 0,1 0,2 0,3 0,4 0,5 0,6 0,7 0,8 0,9 1 0 0,1 0,2 0,3 0,4 0,5 0,6 0,7 0,8 0,9 1
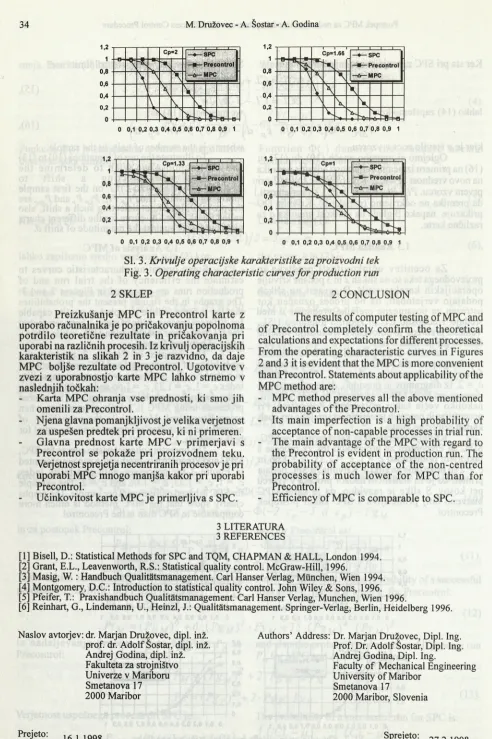
Sl. 3. Krivulje operacijske karakteristike za proizvodni tek
Fig. 3. Operating characteristic curves for production run
2 SKLEP
Preizkušanje MPC in Precontrol karte z uporabo računalnika je po pričakovanju popolnoma potrdilo teoretične rezultate in pričakovanja pri uporabi na različnih procesih. Iz krivulj operacijskih karakteristik na slikah 2 in 3 je razvidno, da daje MPC boljše rezultate od Precontrol. Ugotovitve v zvezi z uporabnostjo karte MPC lahko strnemo v naslednjih točkah:
Karta MPC ohranja vse prednosti, ki smo jih omenili za Precontrol.
Njena glavna pomanjkljivost je velika verjetnost za uspešen predtek pri procesu, ki ni primeren. Glavna prednost karte MPC v primerjavi s Precontrol se pokaže pri proizvodnem teku. Verjetnost sprejetja necentriranih procesov je pri uporabi MPC mnogo manjša kakor pri uporabi Precontrol.
Učinkovitost karte MPC je primerljiva s SPC.
2 CONCLUSION
The results o f computer testing of MPC and of Precontrol completely confirm the theoretical calculations and expectations for different processes. From the operating characteristic curves in Figures 2 and 3 it is evident that the MPC is more convenient than Precontrol. Statements about applicability of the MPC method are:
- MPC method preserves all the above mentioned advantages of the Precontrol.
- Its main imperfection is a high probability of acceptance o f non-capable processes in trial run. - The main advantage of the MPC with regard to
the Precontrol is evident in production run. The probability of acceptance of the non-centred processes is much lower for MPC than for Precontrol.
- Efficiency of MPC is comparable to SPC.
3 LITERATURA 3 REFERENCES
[1] Bisell, D.: Statistical Methods for SPC and TQM, CHAPMAN & HALL, London 1994. [2] Grant, E.L., Leavenworth, R.S.: Statistical quality control. McGraw-Hill, 1996.
[3] Masig, W. : Handbuch Qualitätsmanagement. Carl Hanser Verlag, München, Wien 1994. [4] Montgomery, D.C.: Introduction to statistical quality control. John Wiley & Sons, 1996. [5] Pfeifer, T.: Praxishandbuch Qualitätsmanagement. Carl Hanser Verlag, München, Wien 1996.
[6] Reinhart, G., Lindemann, U., Heinzl, J.: Qualitätsmanagement. Springer-Verlag, Berlin, Heidelberg 1996.
Naslov avtorjev: dr. Marjan Družovec, dipl. inž. prof. dr. A dolf Šoštar, dipl. inž. Andrej Godina, dipl. inž. Fakulteta za strojništvo Univerze v Mariboru Smetanova 17 2000 Maribor
Authors’ Address: Dr. Marjan Družovec, Dipl. Ing. Prof. Dr. A dolf Šoštar, Dipl. Ing. Andrej Godina, Dipl. Ing.
Faculty o f Mechanical Engineering University o f Maribor
Smetanova 17
2000 Maribor, Slovenia
Prejeto:
Received: 16.1.1998
Sprejeto: