R E S E A R C H
Open Access
Altered modulation of gamma oscillation
frequency by speed of visual motion in
children with autism spectrum disorders
Tatiana A. Stroganova
*, Anna V. Butorina, Olga V. Sysoeva, Andrey O. Prokofyev, Anastasia Yu. Nikolaeva,
Marina M. Tsetlin and Elena V. Orekhova
Abstract
Background:Recent studies link autism spectrum disorders (ASD) with an altered balance between excitation and inhibition (E/I balance) in cortical networks. The brain oscillations in high gamma-band (50–120 Hz) are sensitive to the E/I balance and may appear useful biomarkers of certain ASD subtypes. The frequency of gamma oscillations is mediated by level of excitation of the fast-spiking inhibitory basket cells recruited by increasing strength of excitatory input. Therefore, the experimental manipulations affecting gamma frequency may throw light on inhibitory networks dysfunction in ASD.
Methods:Here, we used magnetoencephalography (MEG) to investigate modulation of visual gamma oscillation frequency by speed of drifting annular gratings (1.2, 3.6, 6.0 °/s) in 21 boys with ASD and 26
typically developing boys aged 7–15 years. Multitaper method was used for analysis of spectra of gamma
power change upon stimulus presentation and permutation test was applied for statistical comparisons. We also assessed in our participants visual orientation discrimination thresholds, which are thought to depend on excitability of inhibitory networks in the visual cortex.
Results: Although frequency of the oscillatory gamma response increased with increasing velocity of visual motion in both groups of participants, the velocity effect was reduced in a substantial proportion of children with ASD. The range of velocity-related gamma frequency modulation correlated inversely with the ability to discriminate oblique line orientation in the ASD group, while no such correlation has been observed in the group of typically developing participants.
Conclusions: Our findings suggest that abnormal velocity-related gamma frequency modulation in ASD may constitute a potential biomarker for reduced excitability of fast-spiking inhibitory neurons in a subset of children with ASD.
Keywords:ASD, Visual gamma oscillation frequency, Stimulus velocity, Oblique line orientation threshold
Background
Autism spectrum disorders (ASD) are a group of neuro-developmental disorders characterized by impaired so-cial interaction and communication, repetitive behaviors, and restricted interests. ASD is now viewed as a hetero-geneous set of pathological conditions, which can be caused by various genetic, epigenetic, and environmental factors [1]. Given a large diversity of molecular, cellular, and network mechanisms converging on the same ASD
behavioral phenotype, many researchers currently agree that further progress in ASD research depends on the ef-forts undertaken to reduce heterogeneity by subsetting individuals with ASD according to traits that may be re-lated to underlying pathophysiology [2]. In addition, neural abnormalities associated with ASD might be more adequate targets for diagnostic and therapeutic advance-ment than behavioral phenotypes [3].
Emerging evidence suggests that imbalance between exci-tatory glutamate and inhibitory gamma-amino-butyric-acid (GABA) neurotransmission may form one of the several * Correspondence:[email protected]
Autism Research Lab, MEG-Center, Moscow State University of Psychology and Education, Sretenka 29, Moscow 107045, Russian Federation
common pathways for multiple molecular-genetic abnor-malities in ASD [4, 5]. In particular, animal research as well as the studies of postmortem brain tissue of people with ASD highlighted the role of GABAergic inhibitory inter-neurons for appearance of ASD phenotype [6, 7].
A plausible neurophysiological model explaining changes in brain functioning caused by abnormal activity of specific
type of GABAergic interneurons—fast-spiking (FS)
parvalbumin-expressing (PV+) cells—is an aberration in gamma oscillations (30–120 Hz) in cortical networks [8]. Gamma oscillations act to temporally coordinate firing of excitatory cortical pyramidal neurons both within local and distant neural networks, and such coordination is thought to be the key component of information processing in dis-tributed cortical assemblies [9]. In humans, gamma oscilla-tions induced by certain functional loads have been implicated in a wide range of brain functions, such as atten-tion [10], visual percepatten-tion [11], and motor control [12, 13]. Pathological modifications of oscillatory gamma response properties may therefore account for cognitive, perceptual, and motor dysfunctions that have been frequently observed in individuals with ASD since infancy [14].
How the disturbances of cortical gamma activity in neurodevelopmental disorder can give rise to deviations from typical developmental trajectory of a particular brain function is not yet clear. It would be therefore im-portant to investigate whether impaired modulation of gamma oscillations by specific functional load signifies deficient ability of cortical networks to be effectively mo-bilized by sensory input or attentional demands.
Vision is one of the particularly interesting functional do-mains in this respect. Indeed, center–surround antagonism mediated by inhibition in the visual cortex is critically im-portant for basic visual functions including orientation dis-crimination [15], contour detection [16], figure–ground segmentation, and perception of motion [17, 18]. On the other hand, there is a growing body of evidence showing that atypical basic perceptual skills are at least a concomi-tant and possibly the cause of some core behavioral signs and symptoms in a subset of ASD individuals (for review, see [14]). However, only a few studies investigated EEG gamma oscillations triggered by perception of visual stim-uli in children with autism [19–22], and none of them studied the relationship between gamma response and psychophysical measures of basic visual functions.
Until now, the key obstacle toward the use of this po-tential biomarker of inhibitory dysfunction in cortical networks and relating it to behavior and visual functions in ASD the lack of the experimental paradigms that con-sistently provoked measurable visual gamma response in EEG and/or magnetoencephalography (MEG) record-ings. Non-invasive detection of these low amplitude brain oscillations is complicated due to the presence of strong muscular and ocular artifacts, which overlap the same
frequency range as the gamma oscillation [23, 24]. There-fore, artifact-free measurement of gamma-band oscilla-tions requires a combination of highly optimized experimental paradigms coupled with reliable method-ology of gamma response detection.
The recently developed“moving annular grating” para-digm [25] was proved to very effectively induce visual gamma oscillations in EEG and MEG recordings. Several studies have demonstrated that in adults, contracting and/or expanding annular gratings induced reliable MEG-recorded high-frequency (60–90 Hz) gamma oscil-lations (HGO) in the visual cortex [25–27]. Moreover, results of Edden and colleagues [28] suggest a causal link between HGO response frequency and GABAergic path-ways (but see [29]). Animal studies suggest that abnor-malities of both inhibitory GABAergic transmission and excitatory NMDA-mediated transmission on the inhibi-tory FS PV+ interneurons may affect gamma frequency [30, 31]. Hence, studies of visually induced high-frequency oscillations in individuals with ASD may appear useful to reveal the subtype of the disorder most strongly associated with abnormalities in inhibitory network of the visual cortex. This paradigm, however, has not been yet applied to investigate adults or children with ASD.
We hypothesized that the altered excitation/inhibition balance (E/I balance) within the visual cortical network in a subset of ASD subjects could affect both the in-duced gamma oscillation in the visual cortex and sub-jects’ability to perceive visual information.
To check this hypothesis, we applied the moving
an-nular grating paradigm and used MEG—the
non-invasive methodology that is more sensitive than EEG to the cortical electromagnetic sources oscillating at fre-quencies in the higher gamma-band range [32].
To ensure functionality of the HGO response to mov-ing annular gratmov-ings, we introduced an important modi-fication into the paradigm by changing stimulus velocity from 1.2 up to 6.0 °/s. The animal studies demonstrated a systematic increase of HGO frequency in the primary visual cortex with increasing stimulus velocity [33, 34]. Our recent study has shown that changing speed of vis-ual motion effectively modulates gamma frequency also in children [35].
be a more direct and accurate functional measure than the gamma power, as the latter is affected by individual variations in non-physiological variables, such as convolu-tion of cortical tissue generating electromagnetic signal [37] or degree of EEG/MEG signal contamination by muscle activity [23].
To investigate perceptual consequences of putative visual gamma response abnormalities in ASD, we have tested in our subjects the line orientation discrimination thresholds in a complementary psychophysical session. The ability to discriminate line orientation depends on GABA-mediated lateral inhibition in the primary visual cortex [38]. It has been recently shown that in healthy adults, the orientation discrimination thresholds for ob-liquely oriented lines correlated negatively with concentra-tion of inhibitory mediator GABA in the visual cortex [28]. We for the first time examined the relationship be-tween oblique line discrimination and visual gamma re-sponse in typical children and those with ASD.
Methods Subjects
Twenty one boys with ASD aged 7–15 years (mean age 10.4 years; SD = 2.2) were recruited at rehabilitation cen-ters affiliated with the Moscow University of Psychology and Education. All participants with ASD were assessed by the same experienced licensed psychiatrist. The diag-nosis of ASD was based on the Diagnostic and Statistical Manual of Mental Disorder-V criteria as well as an inter-view with the parents/caregivers [39]. The inclusion
cri-teria were the absence of known chromosomal
syndrome (e.g., Down syndrome, fragile X syndrome) or comorbid neuropsychiatric disorder (e.g., epilepsy).
Twenty six age-matched (mean age 11.1 years; SD = 1.7) typically developing (TD) control boys were recruited from local schools by advertisements. The TD boys comprising the control group in this study were also included in our re-cent normative study of visual gamma oscillations [35].
To confirm validity of the diagnosis, parents of all the children were asked to fill in the Russian version of the autism spectrum quotient (AQ) for children [40] or ado-lescents [41]. The AQ results were available in 19 of 21 ASD and in 22 of 26 TD participants. The majority of parents were also asked to fill in the “lifetime” version of the Social and Communication Questionnaire (SCQ; [42]). The sensitivity and specificity of the SCQ-lifetime and AQ questionnaires in our sample are reported in Additional file 1: Table S1. The results from both questionnaires were in good agreement with the clinical diagnosis.
The intellectual abilities of children have been assessed with the Kaufman Assessment Battery for ChildrenК-АВС II [39]. The IQ scores were available in 19 of 21 ASD and 25 of 26 TD participants. Information on partici-pant’s age, IQ, and AQ scores and the number of the
participants tested are summarized in Table 1. All children had normal or corrected to normal vision ac-cording to available medical records.
The previous studies suggest significant sex differences in etiological factors and the biological time course of ASD [43]. The gender ratio in ASD is highly biased to-ward boys [44]. Since the small number of participants who could be recruited for this study did not allow us to test for the effect of gender, we included only male par-ticipants. This limits the generalizability of our results.
The study was approved by the local ethics committee of the Moscow University of Psychology and Education and was conducted following the ethical principles re-garding human experimentation (Helsinki Declaration). A written informed consent was obtained from a parent/ guardian of each child.
Experimental procedure
During the MEG recording, subjects sat in a magnetic-ally shielded room (“AK3b”, Vacuumschmelze GmbH, Hanau, Germany) with the head resting securely against the helmet-shaped surface of the helium Dewar.
The stimulus used in this study was a black and white contracting annular grating having spatial frequency of 1.66 cycles/° and a diameter of 18 ° of visual angle. The stimuli were shown to the participants using Presentation software (Neurobehavioral Systems Inc., USA) via a com-puter with 60 Hz refresh rate and were back-projected on a translucent white projection screen located 1.1 m in front of the participants. The stimuli were presented in the center of the screen at three contraction velocities (1.2, 3.6, 6 °/s), referred below as low, medium, and fast. In order to minimize visual and mental fatigue, the test stim-uli were interspersed with 67 short (3–6 s) animated movies. A small white fixation cross on the black back-ground was presented in the center of the screen between the stimuli.
Each trial began with presentation of a fixation cross. The participants were instructed to constantly maintain their gaze on the cross when it was present. In 1200 ms, the annular grating contracting with one of the three vel-ocities was presented for a period that varied randomly
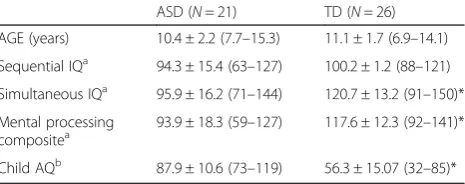
Table 1Demographic information: mean ± sd (range)
ASD (N= 21) TD (N= 26)
AGE (years) 10.4 ± 2.2 (7.7–15.3) 11.1 ± 1.7 (6.9–14.1)
Sequential IQa 94.3 ± 15.4 (63–127) 100.2 ± 1.2 (88–121)
Simultaneous IQa 95.9 ± 16.2 (71–144) 120.7 ± 13.2 (91–150)*
Mental processing
compositea 93.9 ± 18.3 (59–127) 117.6 ± 12.3 (92–141)*
Child AQb 87.9 ± 10.6 (73–119) 56.3 ± 15.07 (32–85)*
Asterisks denote significant difference between ASD and TD group, *p< 0.05
a
IQ was available in 19 of 21 ASD and in 25 of 26 TD participants
b
between 1200 and 3000 ms and was followed by a static stimulus picture. The participants were instructed to press a button as quickly as possible after termination of the stimulus motion. The subjects’response was followed by appearance of the fixation cross and presentation of the new stimulus. The response hand was counterbalanced across experimental blocks. If the response latency exceeded individually calculated maximum (median re-sponse time + 3SD determined in the training session), the stimulus was substituted by discouraging message “too late!”remaining on the screen for 2000 ms, and then the new trial began.
The training session preceded the main experiment and served to familiarize participants with the task and to measure the median response time in order to adjust the maximal response interval in the main experiment. The training session was fully identical to the experi-mental one, but contained only 20 trials and imposed no time limit on response.
The experimental session included three blocks of trials. Each stimulus velocity was presented 30 times within each block in a random order resulting in 90 trials per stimulus velocity.
Response time (RT) as well as commission and omis-sion errors were measured for all but one TD subject (due to technical failure) and all but two ASD subjects, who did not follow the instruction to press a button, but still were looking at the screen.
MEG recording
Neuromagnetic activities were recorded with the helmet-shaped 306-channel detector array (“Vectorview”, Neuro-mag Elekta Oy, Helsinki, Finland), which comprised 102 identical triple sensor elements. Each sensor element con-sisted of two orthogonal planar gradiometers and one mag-netometer coupled to a multi-SQUID (superconducting quantum interference device). In this study, the data from 204 planar gradiometers were used for analyses because they provide an optimal signal-to-noise ratio for spatially restricted current sources such as occipi-tal gamma generators.
Prior to the MEG session, the positions of HPI coils were digitized together with fiducial points using the 3D
digitizer “FASTRAK” (Polhemus, Colchester, VT) and were further used to assess a subject’s head position in-side the MEG helmet every 4 ms. The spatiotemporal signal space separation method (tSSS) method [45]
implemented by “MaxFilter” (Elekta Neuromag Oy
software) was used to suppress interference signals generated outside the brain. Head movement compen-sation was used to convert the data to the standard head position (x = 0 mm; y = 0 mm; z = 45 mm) across all time points and experimental blocks.
Four electrodes were placed at the outer canti of the eyes and above and below the left eye and used to record electrooculogram (EOG). The high-pass filter of 0.1 Hz was used for the EOG recording. The electrocardiogram (ECG) was recorded using standard V6–V2 leads. The MEG signals were recorded with a band-pass filter of 0.03– 330 Hz, digitized at 1000 Hz, and stored for offline analysis.
MEG data preprocessing
The correction of vertical eye movements and ECG arti-facts was performed for continuous data in Brainstorm (http://neuroimage.usc.edu/brainstorm [46], using the SSP algorithm [47, 48].
The subsequent analyses were done using the SPM12 toolbox (http://www.fil.ion.ucl.ac.uk/spm [49]). The pipe-line was optimized for analysis of velocity-driven HGO time–frequency modulations through defining velocity-specific spectral power changes over the occipital cortex.
The averaging epoch started 500 ms prior to stimulus onset and lasted until 1200 ms post-stimulus. The MEG epochs containing strong muscle artifacts were excluded by thresholding the mean absolute values of high-frequency signal. The threshold was set at 5 standard de-viations from the absolute amplitude of the 70 Hz high-passed signal averaged across channels. The remaining epochs were further visually inspected for the presence of artifacts, and the artifact-containing epochs were ex-cluded manually. The average number of artifact-free epochs per condition was 79.6 (54–89) in the ASD group and 83.0 (56–90) in the control group and did not signifi-cantly differ between the groups or conditions (Table 2).
For efficient spectral estimation, we used multitaper spec-tral analysis [50]. This method is based on pre-multiplying
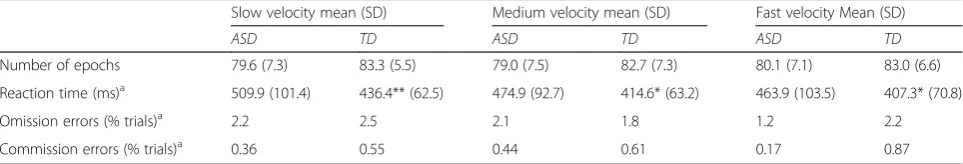
Table 2Moving annular gratings paradigm: behavioral results and a number of epochs sampled for MEG analysis
Slow velocity mean (SD) Medium velocity mean (SD) Fast velocity Mean (SD)
ASD TD ASD TD ASD TD
Number of epochs 79.6 (7.3) 83.3 (5.5) 79.0 (7.5) 82.7 (7.3) 80.1 (7.1) 83.0 (6.6)
Reaction time (ms)a 509.9 (101.4) 436.4** (62.5) 474.9 (92.7) 414.6* (63.2) 463.9 (103.5) 407.3* (70.8)
Omission errors (% trials)a 2.2 2.5 2.1 1.8 1.2 2.2
Commission errors (% trials)a 0.36 0.55 0.44 0.61 0.17 0.87
Asterisks denote significant difference between ASD and TD group, *p< 0.05; **p< 0.01
a
the data with a series of tapers optimized for producing un-correlated estimates of the spectrum in a given frequency band. This sacrifices some of the frequency resolution, in a controlled manner, to increase signal-to-noise ratio. It does this by effectively multiplying the number of trials by the number of tapers used. We estimated the spectra in over-lapping windows of 400 ms (shifted by 50 ms). The fre-quency resolution was set to the inverse of the time window (2.5 Hz) for up to 25 Hz, then 0.1 times the fre-quency for 25–50 Hz, and then to a constant 5-Hz reso-lution. These settings resulted in a single taper being used for 2.5–30 Hz, two tapers for 32.5–42.5 Hz, and three ta-pers for 45 Hz and above. The resulting time–frequency images had no discontinuities, thanks to the continuous frequency resolution function.
The epoched time–frequency data were averaged using a robust averaging procedure [51, 52]. To reduce inter-subject variability and to normalize power changes across different frequency bands, the –500 to 1200 ms power was log transformed and baseline corrected using the period from–500 to–100 ms before stimulus onset as the baseline (LogR option in SPM). Planar channels were then combined by adding time–frequency data for pairs of channels corresponding to orthogonal sensors at the same location. Based on the previous neuroimaging studies of visual HGO response to moving annular grat-ings in human subjects [25, 26], we expected the re-sponse to be restricted by MEG sensors overlaying the occipital lobe. Therefore, we used the posterior planar gradiometers for subsequent analysis.
Group analysis of MEG data
Our prior study in the TD children [35] has shown that the faster velocities of visual motion induce gamma os-cillatory response at higher frequencies in the same way as it has been shown in the animal studies [34]. We hypothesized that these velocity-related frequency mod-ulations may be compromised in children with ASD. For identification of velocity-specific power changes at each of the three stimulus velocities, we performed stat-istical analysis of the stimulus-related spectral changes to detect significant differences between velocities. The group-level analysis, therefore, proceeded in the follow-ing steps.
First, we calculated average log-transformed baseline-normalized power (in dB) in 400 to 1000 ms post-stimulus window for each frequency bin within 50–120 Hz range. This time window displays strong sustained gamma re-sponse to visual motion and is not contaminated by stimulus onset response [25, 26]. In both groups of sub-jects and for all three velocities, the topographical max-imum of the stimulus-related spectral power changes was found at planar gradiometers pair 2112/2113 overlaying midline of the occipital lobe.
Second, at the 2112/2113 gradiometer pair, we searched for velocity-specific frequencies where the baseline-normalized HGO spectral power for a given stimulus velocity exceeded that for the two other veloci-ties, while properly corrected for the family-wise error using permutation approach. To correct for multiple comparisons, the baseline-normalized spectral power values at each frequency bin within 50–120 Hz range were randomly permuted 1000 times between the two datasets (e.g., low and medium velocity conditions) and the para-metric one-sidedttest was performed. Across all frequency bins, the maximaltvalue from each permuted dataset was taken when forming the empirical null distribution and comparing it with the original statistics [53]. The probabil-ity level was set atp< 0.05 for this comparison.
Velocity-specific frequencies were computed as an over-lap between results of the two unidirectional pairwise comparisons. In the TD group, the distinct velocity-specific HGO frequencies were found for all three stimuli velocities. In the ASD group, the velocity-specific increase in gamma power was found only for the slow velocity.
For each stimulus velocity, we also compared HGO re-sponse strength between ASD and TD subjects across the whole spectrum of gamma power changes. The same permutation approach was used for the group compari-son (Fig. 2, right panels).
Assessment of individual velocity-specific peak frequency of HGO response
There is a substantial inter-individual variability in the fre-quency boundaries and sensor sites where MEG-recorded HGO response could be observed during moving annular grating perception even in healthy adults [26]. Depending on the subject or even on the electrode/sensor site, power augmentation at the higher-frequency part of the EEG/ MEG spectrum (50–120 Hz) was reported across a wide range of frequencies. It is likely that the frequency and spatial variability of the visual HGO response in children is further inflated by age and—in the ASD participants—by variations in their pathological condition. The direct between-group statistical comparisons, therefore, may lead to false negative results due to individual variability of HGO response both in space and frequency. Considering that the main focus of our study was on the frequency modulations of HGO by velocity, we applied a more flexible approach to the definition of individual velocity-specific fre-quency of HGO response.
morphology, the individual VSPF was always defined at the gradiometer pair where the maximal HGO response in 50–120 Hz range was observed in a particular subject for a particular velocity. To ensure that the individual values comply with the group HGO response, the search for the individual gamma VSPF was limited to a certain frequency window. This window was centered at the TD group velocity-specific gamma peak which overlapped or was closest to velocity-specific frequencies at the group level (62.5 Hz for the slow, 80 Hz for the medium, and 92.5 Hz for the fast velocity). The width of each velocity-specific window was set at the full width at half maximum (FWHM). This resulted in velocity-specific frequency win-dows of 52.5–77.5 Hz for the slow velocity, 55.0–87.5 Hz for the medium velocity, and 55.0–97.5 Hz for the high velocity. Inspection of the group response spectra (Fig. 2) shows that the resulting frequency windows were broad enough to include visual gamma re-sponses in both the TD and ASD groups. The indi-vidual spectra were smoothed by a three points moving average filter. After the smoothing, the
algo-rithm searched for the peaks of the
baseline-normalized power within the velocity-specific win-dows. Given that a specified frequency window may cover several local maxima, the peak of the highest frequency was always taken from all the peaks that exceeded baseline value by two standard deviations. This approach makes explicit the assumption that there may be several spectral peaks in gamma response (see e.g., [34]) and is less susceptive to arbitrary detection of a local maximum. The VSPFs that complied with the above speci-fied criteria for all three velocities were found in 16 ASD and 19 TD participants. Additional file 2: Table S2 summa-rizes demographic information on the subjects included in statistical analysis of VSPF.
Statistical analysis of VSPF
To assess contribution of subjects’ age and IQ score into the inter-individual variation of gamma VSPF at each stimulus velocity, we calculated Spearman non-parametric correlations separately in the TD and ASD groups. For between-group comparison of the VSPF values, we performed general linear modeling (GLM) analysis with the within-subject factor velocity (1.2, 3.6, 6.0 °/s) and between-subject factors group (TD and ASD) and age. We tested for the main effects as well as for interactions of velocity with the between-subject factors. The Greenhouse–Geisser correction for violation of sphericity assumption was applied. Significant interaction was followed up by planned comparisons.
Psychophysical task
The oblique and vertical orientation discrimination thresh-olds were measured in two successive experimental sessions
within 2 months after the MEG experiment. To measure the thresholds, we applied a two-alternative forced choice procedure similar to that used by Edden and colleagues [28]. The stimuli were presented on 19”W-LED“Nec Mul-tisync EA192M-BK”monitor (resolution 1280 × 1024) con-trolled by a “Mobile Intel® 945GM Express” graphics chipset. Participants were asked to sit comfortably at 60 cm distance from the monitor. The distance from the monitor, vertical head position, and adequate task performance was controlled by an assistant who sat next to the subject. The room was completely dark, and a circular aperture (with diameter of 61 cm and inner empty circle of 13 cm) was placed over the monitor to remove all external orientation clues, such as those from the edges of the screen. Attention to the center of the screen has been facilitated by flashing a dot in the center of the screen, which appeared in the be-ginning of each trial. Each trial contained two circular grat-ings (diameter 7 °; spatial frequency 3 cycles/degree; contrast 100 %; mean luminance 3.3 lux) presented sequen-tially for 350 ms, with the time interval varying randomly from 400 to 600 ms. The orientation difference between the gratings was adjusted using two interleaved one-up two-down staircases that converged on 71 % correct per-formance. The orientation of the first grating was held fixed at 90 ° in the“vertical”condition and 45 ° in the“oblique” condition, and the second grating was rotated either clock-wise or counterclockclock-wise. The initial difference between the first and the second grating was 15 °. The initial step was 1 °, which was reduced to 0.4 ° after the second reversal and to 0.2 ° after the fourth reversals. Participants were asked to judge whether the second grating was rotated clockwise or counterclockwise compared to the first one. Responses were made using the keyboard. There were sep-arate blocks, consisted of either vertical or oblique trials, with the block order counterbalanced across participants. The majority of the participants performed each block twice, and the final threshold was based on the average. Each block continued until both staircases completed seven reversals, typically lasting about 7 min. The threshold was computed by taking average over the reversals, ex-cluding the first two of each staircase, and then over the two staircases.
Results
Behavioral results
Behavioral data from the drifting annular grating task (Table 2) indicated no significant group or velocity effects or their interaction in terms of omission or commission er-rors (F(2,84) = 1.94; p= 0.15; F(2,84) = 1.60; p= 0.21). The reaction time was slower in the ASD than in TD group (F(1,42) = 7.2; p< 0.02), but no group × velocity interaction effect was detected (F(2,84) = 2.4;p= 0.10). Individuals with ASD are often referred to in the literature as being rela-tively slow and inaccurate in their perceptual–motor skills [54]—the finding that may reflect problems with attention focusing. Nevertheless, the lack of the interaction between group and velocity suggests that the paradigm equally en-gaged attention of TD and ASD subjects in each velocity condition, and that any interactions between group and vel-ocity found for the neurophysiological variables cannot be explained by differences in attention.
Velocity-specific MEG gamma responses
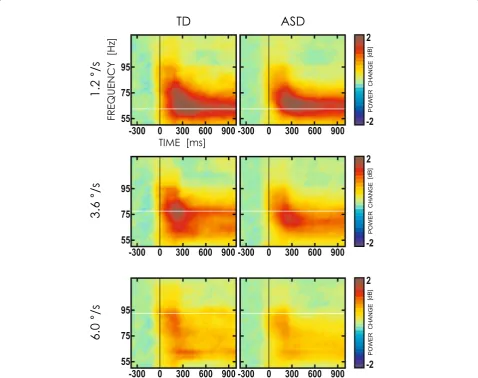
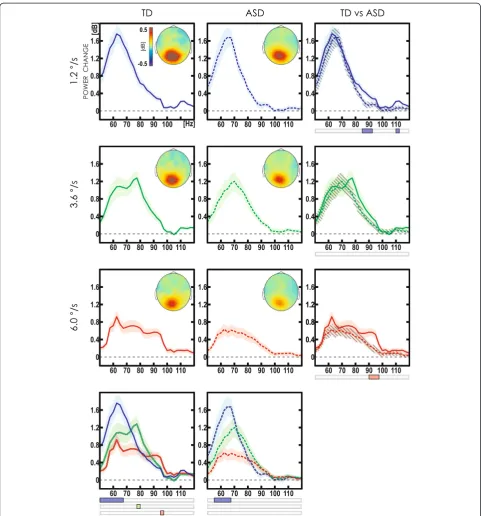
Inspection of grand average time–frequency plots for power changes shows a robust increase of HGO power within 50–120 Hz frequency range at each stimulus vel-ocity, in both the TD and ASD groups. This increase in high gamma power was sustained for the whole duration of the stimulus presentation (Fig. 1). The inserts in Fig. 2 show topographical distribution of the average HGO response power. As expected, the maximal HGO response clustered over the medial parieto-occipital cortex with a topograph-ical maximum at the gradiometers pair 2112 + 2113 over-laying the occipital midline.
Importantly, the frequency characteristics of visual HGO response showed a clear divergence between the three stimulus velocities in the TD group where the vel-ocity increase resulted in significant velvel-ocity-specific HGO response at higher frequencies (Fig. 2). In the ASD group, the peak frequency of the HGO response elicited by slow stimulus velocity almost precisely corresponded to that in the TD group, while for the medium and fast velocities, the velocity-specific HGO responses in the ASD group were not detected (Fig. 2, bottom panels).
Group differences in gamma VSPF
The individual data revealed substantial variability in gamma VSPF, which varied between 57.5 and 92.3 Hz. The examples of individual visual HGO spectra in the TD and ASD participants are shown in Fig. 3. Previous studies re-ported inter-individual variations in gamma peak frequen-cies over a narrower range [25, 26, 36, 55]; however, these experiments used grating drifting at a fixed velocity close to the slowest velocity used in our experiment.
Overall, the individual VSPFs for all three velocities were detected in 19 out of 26 TD participants and in 16 out of 21 participants with ASD. In every individual
subject, the gamma VSPF tended to be highest when he was presented with the gratings drifting at fastest vel-ocity. In the TD group, the VSPF in response to the slow and fast velocities differed by 23 Hz on average, with a maximal difference of 37.5 Hz (Fig. 3). The mean standard error of the estimated oscillation frequency shift between low and fast velocity was 1.97 Hz. As evident from the indi-vidual HGO response spectra, the progressive shift in oscil-lation frequency was present also in participants with ASD, although the inter-individual differences in velocity-related frequency gain were greater in ASD than in TD subjects (e.g., compare subjects (e) and (h) in Fig. 3).
Furthermore, for each subject, we defined the
“modulation range” of gamma VSPF as the difference of the VSPF values driven by the fast and slow veloci-ties of the drifting grating.
The GLM analysis revealed a substantial between-group difference in velocity-related modulation of gamma VSPFs. The significant velocity by group inter-action (F(2,64) = 4.40; ε= 0.88; p< 0.02) was mainly ex-plained by significant between-group differences in gamma VSPF in case of the medium and fast velocities and absence of such differences in case of the slow vel-ocity condition (Fig. 4a). The latter finding suggested that gamma VSPF modulation range was reduced in par-ticipants with ASD compared to control parpar-ticipants. Of note, the velocity by group interaction remained significant when we included IQ as a nuisance variable in the GLM analysis (F(2,60) = 4.3, ε= 0.88,p< 0.02) and further when we excluded the participant with ASD who failed to follow the instruction to press the button but still watched the vis-ual presentation (F(2, 58) = 4.6,ε= 0.88,p< 0.02).
The histogram plot depicting individual variations in gamma VSPF modulation range corrected for age visual-izes clear-cut between-group difference on the individual basis (Fig. 4b). While VSPF modulation range in ap-proximately half of the individuals from the TD sample (11 from 19 subjects) exceeded 30 Hz, it was below 30 Hz in all participants from the ASD sample. Vice versa, the VSPF modulation range less than 20 Hz was disproportionally increased in the ASD comparing to the TD group (10 from 16 ASD and 2 from 19 TD subjects). Thus, despite a partial overlap in the VSPF modulation range values between the two samples, the velocity-related growth of HGO frequency was obviously abnor-mally reduced in participants with ASD.
Age dependence of gamma frequency parameters in the ASD and TD groups
and medium velocity conditions and the absence of such slowing under the fast velocity conditions. We further computed Spearman correlations between gamma fre-quency parameters and subject’s age separately in the TD and ASD groups. For the both groups, the gamma VSPF measured under conditions of slow and medium velocities correlated negatively with age (slow velocity: both Rho<–0.6; both p< 0.01; medium velocity: both Rho<–0.5; both p< 0.03), whereas no significant correl-ation with age was found for fast velocity in either TD or ASD children. The gamma modulation range signi-ficantly increased with age in the TD group (Rho= 0.45; p< 0.05), but not in the ASD group (Rho= 0.16; ns). Homogeneity of slope analysis confirmed that the slopes of the regression lines (VSPF modulation range vs. age) significantly differed between the TD and ASD groups (age × group: F(1,31) = 7.4;p< 0.02.
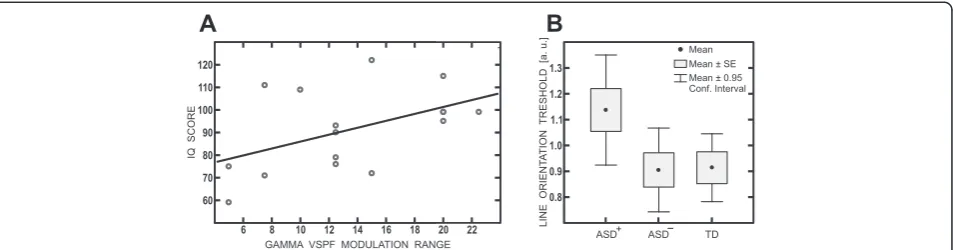
Gamma VSPF modulation range, IQ, and severity of autism The reduced range and the abnormal age dynamics of gamma frequency modulations in ASD raise a question of possible relation between gamma VSPF modulation range and severity of autism symptoms and/or the de-gree of developmental delay in ASD. The marginally sig-nificant correlation between VSPF modulation range and IQ (Spearman’sRho= 0.49;p= 0.05) suggests that the re-duced VSPF modulation range in children with ASD is related to developmental delay (Fig. 5a). No correlation between VSPF modulation range and AQ was found in the ASD group (Rho=–0.21;p= 0.41).
Gamma VSPF modulation range and visual orientation discrimination threshold
At the next step, we investigated the relation between velocity-induced gamma frequency modulation and
Fig. 2Grand average spectra of HGO response induced by drifting gratings in the TD and ASD groups. Spectra are shown for combined pair of MEG gradiometers that displayed maximal gamma response (MEG2112 and MEG2113). Horizontal axis—frequency (Hz), vertical axis—log-normalized power changes relative to baseline (dB).Blue line—1.2 °/s,green line—3.6 °/s,red line—6.0 °/s.Solidanddashed linesdesignate the TD and ASD group, respectively.Shadedandstriped shadedareas represent standard error of the mean for the TD and ASD, respectively. Sensor level topographic maps of the high gamma-band (55–120 Hz, 0.4 to 1.2 s) activity in dB are shown in the upper left corner of the respective panel. Bottom panels show between-condition comparisons;stripsbelow the plots indicate frequencies where power increase for the respective velocity exceeded that for the two other velocities (p< 0.05, FWE-corrected). Between-group comparisons for each velocity condition are shown in the rightmost panels. Thestrips
performance of the visual orientation discrimination task. All the measures (oblique line orientation thresh-old and VSPF at three stimulus velocities) were avail-able for 13 and 16 subjects from the ASD and TD groups, respectively. We repeated the previous GLM analysis for this smaller sample. The group × velocity interaction remained significant (F(2,50) = 5.08;ε= 0.94;p < 0.02) ensuring that the selected sample demonstrated characteristic between-group difference in VSPF modula-tion range.
The oblique line orientation threshold did not differ be-tween ASD and TD participants (F(1,27) = 1.27;p= 0.22). We further performed the regression analyses to test whether gamma VSPF or its modulation range predicted subjects’orientation discrimination threshold. Age and IQ were also included as regressors into the analyses. In the TD group, oblique line orientation threshold was pre-dicted neither by VSPFs nor by VSPF modulation range (for all partial correlationp’s > 0.5). In the ASD group, the regression model, which included VSPF modulation range, accounted for 59 % of the threshold variance (F(3,9) = 5,93; p< 0.017; ageβ=–0.38;p= 0.08; gamma modulation range
β=–0.59; p<0.03; IQβ=–0.12; ns). Non-parametric cor-relation between oblique line orientation threshold and VSPF modulation range was also significant (Rho=–0.72;
p< 0.006). The regression model, which included
VSPF, was significant only in case of the fast velocity (F(3,9) = 7,76; p< 0.01; age β=–0.65; p< 0.01; VSPF
β=–0.63; p< 0.01; IQ β=–0.12; ns). However, the non-parametric correlation did not reach significance level (Rho=–0.55; p= 0.06). Thus, in ASD participants, a higher oblique line orientation threshold was predicted by a narrower gamma modulation range, and this relation was not explained by age or IQ.
To further investigate the relation between presence of considerable deficit in VSPF modulation range and ob-lique line orientation threshold in children with ASD, we split them into two sub-groups. The first sub-group included six ASD subjects who scored equal to or less than the median age-corrected VSPF modulation range (18.05 Hz). The second sub-group included seven ASD subjects whose values exceeded the group median. The third group comprised all 16 TD participants. Taking into account small and unequal sample sizes, we applied non-parametric Kruskal–Wallis one-way analysis of vari-ance to test for the main effect of group on oblique line orientation threshold. The main effect was significant (Kruskal–Wallis test: H = 7.68; p< 0.022), and we further applied the Mann–Whitney test to compare the “ defi-cient VSPF modulation range group”with the rest of the ASD sample as well as with the TD children. The results of this comparison are plotted in Fig. 5b. ASD children with marked gamma frequency modulation abnormalities had higher oblique line discrimination threshold than
either control children (Z = 2.43, p <0.03) or ASD chil-dren without such abnormalities (Z = 2.42; p< 0.02). We should note that considering the small sample size, the re-sult of the Kruskal–Wallis analysis should be interpreted with caution and have to be verified in an independent sample.
Altogether, the results strongly suggest that atypically narrow gamma VSPF modulation range and abnormally poor ability to discriminate orientation of oblique lines are interrelated and characterize a substantial proportion of children with ASD.
Discussion
The role the induced gamma oscillations play in sen-sory processing, as well as their neurochemical basis and putative functional consequences of their atypical dynamics in neuropsychiatric disorders, are the hot topics in the literature [56]. In this regard, our find-ing of the reduced modulation of HGO frequency by velocity of visual motion in children and adolescents with ASD is of considerable interest.
Our results show that while the velocity-specific peak frequency of gamma response within 50–120 Hz range in TD children increases with increasing velocity of vis-ual motion, the substantial proportion of children with ASD demonstrate sharply reduced gamma frequency gain. The atypical reduction was observed in the form of abnormally decreased high-frequency gamma power at fast stimulus velocity in grand average spectra of gamma response (Fig. 2, right panel). It was also evident as the reduced gain of gamma VSPF following increase in stimulus velocity from 1.2 up to 6 °/s at both individual (Fig. 3e, f ) and group (Fig. 4) levels. The range of velocity-related gamma frequency modulation correlated inversely with the ability to discriminate oblique line orien-tation in children with ASD, while no such correlation has been observed in the typically developing control children.
Velocity-related modulations of HGO frequency
The reliable increase in power of visual gamma oscilla-tions elicited by moving annular grating in children and adolescents (Fig. 1) is generally consistent with the pre-vious findings in adults [25–27, 55] and children [35]. On the other hand, this is the first study that ma-nipulated stimulus velocity in order to capture velocity-related changes in gamma frequency and to scrutinize a putatively deficient functional modula-tion of gamma frequency in ASD.
This strong velocity dependence of gamma response fre-quency is in stark contrast to the data from the human studies that demonstrated the lack of substantial changes in gamma frequency in response to experimental manipula-tions with stimulus size ([57], but see also [27]), contrast [58], or spatial frequency [59, 60]. This tempted the authors to conclude that MEG does not possess sufficient sensitivity to capture stimulus-driven gamma frequency changes ex-ceeding the limit of 70 Hz, possibly because of small ampli-tude of such oscillations [55]. Our results challenge this view by showing that the visual gamma response within
70–95 Hz frequency range is readily picked up by occipital MEG sensors (Figs. 2 and 3).
In the recently published study, we discussed in details the normal developmental course of visual gamma oscilla-tions as well as the mechanisms underlying stimulus-related changes in gamma frequency [35]. In particular, we speculated that the high frequency of gamma re-sponse in children in our study might result from the high velocity of visual motion used in our ex-perimental paradigm as well as from developmental changes in excitability of the FS PV+ interneurons.
Fig. 3Examples of spectra of HGO power changes caused by drifting gratings moving at three velocities in individual subjects from the TD and ASD groups.aIndividual spectra of HGO response.Upper row—TD subjects;bottom row—ASD subjects. See Fig. 2 for color designations. Although faster-moving gratings produce shift toward higher response frequency in individual subjects from both groups, the frequency shift is greater in TD individuals. Noticeable exception is the subject(h)from the ASD group.bVelocity-specific peak frequencies (VSPF) of the HGO response plotted as a function of stimulus velocity for individual participants (thin lines). Thethick linesshow group means for the TD and ASD subjects
Fig. 4Velocity-related changes of HGO frequency in ASD and TD subjects.aGLM results for gamma VSPF.Solid line—TD;dashed line—ASD.
Typical and atypical features of visual gamma frequency modulation in ASD children
Prior EEG studies of gamma oscillations in ASD have characterized the general trend toward abnormally in-creased or dein-creased power of visually triggered induced and evoked gamma-band oscillations [19–21, 61, 62]. In addition, atypically diminished modulations of high
gamma (60–120 Hz) power in ASD were found when
the researchers manipulated spatial frequency of visual gratings [63], amount of homogeneously oriented ele-ments in the stimuli [64], or orientation of a face [62].
Contrary to our expectation, in case of the slow vel-ocity (1.2 °/s), neither frequency nor power of velvel-ocity- velocity-specific (i.e., within 52.5–77.5 Hz range for this vel-ocity) gamma response was affected in participants with ASD. In sharp contrast to a roughly normal velocity-specific gamma response at low stimulus vel-ocity, gamma frequency shift at faster velocities was remarkably reduced in a substantial proportion of par-ticipants with ASD (Fig. 4a). Thus, for at least some chil-dren with ASD, the visually perceived environmental motion at fast speed seems to present an important barrier for effective communication between neuronal populations through synchronous high-frequency gamma oscillations.
This finding suggests existence of a pathological mech-anism limiting velocity-induced gamma frequency growth in autism. Generation and maintenance of gamma os-cillations are known to critically depend on networks of FS PV-sensitive GABAergic interneurons [65]. Neurophysiological studies suggest that frequency and power of gamma oscillations are controlled by rela-tively independent network mechanisms [66]. In con-trast to gamma power, gamma frequency, which underpins timing of spike trains during gamma oscillations, is less related to the excitatory state of principle cells [31, 67] and seems to be determined mainly by a balance be-tweenN-methyl-D-aspartate (NMDA) glutamate receptor-related excitatory and GABA-A receptor-receptor-related tonic in-hibitory processes on membrane of inin-hibitory neurons
[31]. Increase in gamma oscillation frequency is shown to reflect increased excitatory influence on inhibitory FS PV+ cells through NMDA receptors (NMDAR), causing faster kinetics of these cells and reducing time window of their synchronous discharge [31, 68]. Hence, faster velocities of drifting gratings in our study might lead to stronger excita-tion of critical FS PV+ inhibitory cells, thus accelerating frequency of gamma oscillations in the visual cortex. Given that NMDA-related excitability of inhibitory cells plays a crucial role in gamma-band frequency control, a plausible explanation of difficulties with velocity-related gamma fquency growth in children with ASD is the abnormal re-duction of NMDAR-dependent excitatory modulation of FS PV+inhibitory neurons.
Our hypothesis about NMDAR hypofunction on the FS PV+ interneurons as a putative cause of gamma fre-quency modulation difficulties in ASD is compatible with several lines of evidence.
Firstly, Billingslea et al. [6] have demonstrated that re-duced FS PV-selective NMDAR signaling in the trans-genic mice model closely mimics core autism features of reduced sociability and vocalizations as well as repetitive behavior [6]. In Shank2-mutant mice exhibiting ASD-like behaviors and carrying a mutation similar to the ASD-associated microdeletion in the human SHANK2 gene, NMDA agonists normalize NMDAR function and improve social interaction [69]. Neurophysiological study of Gandal et al. [70] revealed that constitutive NMDAR hypofunction of FS PV+interneurons in transgenic mice induced multiple selective GABA-A receptors deficit on principle cells, increased intrinsic excitability of pyramidal cells, and selectively disrupted parvalbumin-expressing interneurons [70]. These changes resemble global alterations in the GABA-A receptor system and the reduction in parvalbumin containing interneurons in cingulum cortex that have been reported in postmortem studies of brain tissue in ASD [71].
Secondly, and most importantly for the proposed in-terpretation, recent work has shown that downregulation
of NMDA transmission with NMDA receptor antago-nists caused significant reduction in dominant frequency of high-frequency gamma oscillations induced by appli-cation of muscarinic acetylcholine receptor agonist to the slices of a rat’s primary visual cortex [68, 72]. The au-thors provide convincing arguments that NMDA receptor hypofunction decelerates peak frequency of induced high gamma oscillations by reducing activation of FS PV+ inter-neurons in superficial cortical layers II and III. Moreover, selective non-competitive NMDA receptor antagonist de-celerated high-frequency gamma oscillations and left the dominant frequency of low frequency gamma unchanged.
The above experimental finding provides a parsimoni-ous explanation for selective difficulties with visual gamma frequency modulation observed in a subset of children with ASD in our study. We speculate that dampened frequency increase of visual HGO response at higher velocities (3.6 and 6 °/s) in ASD is caused by
hypofunction of NMDA receptors on FS PV+ cells in
supragranular layers II and III in the visual cortex. Inter-estingly, the neurophysiological evidence on multiplicity of gamma-generating mechanisms in different layers of the visual cortex may partially explain presence of sev-eral spectral peaks with the similar peak frequencies at each stimulus velocity in the grand average spectra of power change in our study (Fig. 2). Experimental data from several studies suggest that higher-frequency gamma oscillations coexist with lower-frequency gamma oscillations, which are generated independently in the deeper infragranular layers V–VI of the visual cortex and do not react that much to the increasing strength of excitatory input [72]. Therefore, a spectrum of power change at each stimulus velocity in our study may, at least partially, reflect the relative contribution of differ-ent gamma generators. It is possible, that faster-drifting gratings produce greater involvement of HGO-driving circuitry in superficial layers II and III with concomitant increase in frequency and magnitude of respective gamma peak. Presence of abnormalities in layers II and III could explain the fact that abnormally decreased power change within the high-frequency part of the gamma spectrum (>80 Hz) was evident even at the low-est motion velocity in children with ASD (Fig. 2, 1.2 °/s: upper right panel).
The lack of the ASD/TD difference in power of velocity-specific gamma response at low stimulus velocity (Fig. 2) is, at the first glance, at odds with the proposed
“NMDAR hypofunction” explanation. Indeed, genetic and optogenetic studies reported elevated background gamma power (“noise”) and reduced stimulus-induced gamma-band activity (“signal”) in mice with dysregulation of NMDA receptor signaling [70, 73]. This discrepancy be-tween the proposed interpretation of our finding and ani-mal data may be explained by a diversity of molecular
pathways that can lead to disruptions in NMDAR signal-ing, with quite different effects on gamma oscillations and brain functions. It also seems unlikely that NMDAR activ-ity in individuals with ASD is reduced to the same extent as in genetically modified mice. A more subtle disruption and/or selective, region or layer-specific abnormality of NMDA receptors may characterize brain pathology in children with ASD.
The above interpretation does not exclude the possi-bility that the local and large-scale network changes that can decelerate HGO may also contribute to the observed deficit in gamma frequency modulation in subjects with ASD. Specifically, fast speed of visual motion may in-crease gamma frequencies due to feedback to the pri-mary visual cortex (V1) from higher-order areas, e.g., area MT of the dorsal visual steam, which exhibits higher sensitivity to faster moving stimuli than V1 [74]. In this case, difficulties with gamma frequency modula-tion in ASD could be caused by abnormal connectivity between V1 and higher-order visual areas [74]. However, Giselman and Tiel [75] pointed out that the feedback projections are not very likely sources of gamma fre-quency modulation in the primary visual cortex, since they target mainly pyramidal cells while the terminals on inhibitory interneurons are rare. Therefore, impairment of NMDA receptor-mediated transmission on GABAergic FS PV+interneurons in V1 seems to be a more probable contributor to the observed abnormality in visual gamma frequency modulation in ASD.
Psychophysical correlates of the altered gamma VSPF modulation range in ASD children
In the TD children, the oblique line orientation thresh-old correlated neither with individual gamma peak fre-quencies nor with velocity-related gamma frequency modulation. This finding is at odds with the results of Edden and colleagues, who demonstrated highly reliable inverse relationships between individual visual gamma peak frequency and oblique line orientation thresholds in typical adults [28]. This discrepancy might be ex-plained by the young age of our subjects. Indeed, the de-velopmental changes in myelination of cortical fibers,
number of synapses, NMDA, α
-amino-3-hydroxy-5-methyl-4-isoxazolepropionic acid (AMPA), and GABA neurotransmission all may influence gamma oscilla-tions [56], affect individual gamma frequency, and explain age-dependant changes in its functional correlates. Indeed, in both the TD and ASD groups, we found reliable devel-opmental decrease of VSPF at lower stimulus velocities. Obviously, the studies including multiple age groups may be necessary to narrow down the range of potential expla-nations for the discrepancy.
magnitude of gamma VSPF modulation and oblique line orientation threshold. We should stress that taken as a group, the participants with ASD did not differ signifi-cantly from the control participants in their performance on orientation discrimination task. However, the propor-tion of ASD children who were characterized by marked gamma frequency modulation difficulties did differ from controls and the rest of the ASD subjects by poor visual sensitivity to changes in oblique line orientation (Fig. 5b). Since both gamma frequency and the psychophysical index are thought to depend on functioning of inhibitory networks in the visual cortex, our findings show that al-tered visual functioning and neural oscillatory abnormal-ities in a subset of ASD children are related to impairment in this common circuit mechanism.
Edden and colleagues suggested that individual diver-sity in the frequency of visual gamma-band response and variation in orientation discrimination threshold may be both related to differences in the strength of GABAergic inhibition in V1 [28]. However, it is unlikely that the narrow gamma frequency modulation range in the affected ASD subjects could be explained by putative impairments in GABA receptors and/or GABA concen-tration in the visual cortex. Firstly, the recent studies in humans have shown that pharmacological manipulations with GABAergic transmission did not affect frequency of visual gamma oscillations measured with MEG [26, 76]. Secondly, in vitro studies imply that any GABA-A recep-tor abnormality on interneurons should be accompanied by anincreasein peak frequency of visual gamma oscilla-tion induced by excitatory input to the visual cortex [30, 31], i.e., the gamma frequency changes exactly opposite to those we observed in children with ASD in the present study. Given that (1) acceleration of visual gamma oscilla-tions is critically linked to NMDA receptor-mediated transmission on GABAergic interneurons, (2) selective ac-tivation of GABAergic interneurons in the mouse V1 en-hances orientation selectivity [77], and (3) cortical NMDA receptors are essential for the maturation of orientation selectivity of V1 neurons [78], we speculate that both nar-rowing of gamma frequency modulation range and rela-tively elevated line orientation thresholds might represent some of the observable consequences of abnormally re-duced excitability of FS PV+inhibitory neurons in the vis-ual cortex. We also propose that constitutive NMDA receptor hypofunction is a likely cause of such deficit.
The visual gamma frequency abnormalities we de-scribed may be related to the degree of NMDAR dys-function on FS PV+interneurons in the visual cortex but not in other cortical areas more directly related to social and/or cognitive function. Indeed, we have not found a correlation between visual gamma frequency modulation and AQ—a measure of social reciprocity—in participants with ASD. However, we observed a direct relationship
between gamma frequency modulation difficulties and a degree of mental developmental delay in the ASD group (Fig. 5a). Evidence from animal models implies that the selective disruption of NMDAR signaling in FS PV+ in-terneurons throughout the brain produces impairments in learning and memory [73]. Therefore, we assume that a severe shortage of gamma frequency modula-tion in visual circuitry may, at least indirectly, reflect more widespread NMDA-related deficit in those ASD children who display both autism and mental delay.
parallel with accelerating changes in visual
environ-ment should lead to poor adaptation to the “moving
too fast” environment in people with ASD. Future
studies might compare ASD children with and with-out abnormal postural reactivity to optic flow to
as-sess whether those who express velocity-related
gamma modulation difficulties also exhibit atypical visual-motor coupling.
Conclusions
Whereas previous research have linked ASD to the re-duced or enhanced power of gamma oscillations inre-duced by visual or auditory sensory input, no studies have inves-tigated the relationship between this behavioral phenotype and gamma frequency modulation under increasing func-tional load. Manipulating the speed of visual motion, we uncovered a severe deficiency in induced gamma fre-quency modulation in a proportion of children and ado-lescence with ASD. We also demonstrated a link between shortage of gamma frequency modulation and atypical visual functioning in ASD. Our findings suggest that defi-ciency in speeded visual processing at the cortical level in individuals with ASD may serve as an indicator of reduced functionality of inhibitory mechanisms involved in such basic visual function as discrimination of line orientation. We speculate that in view of the animal data, the reduced modulation of gamma frequency by stimulus velocity is likely associated with constitutive dysfunction of NMDA receptor-mediated transmission on GABAergic inter-neurons in ASD. Our approach complements the recent attempts of neurochemical, genetic and optogenetic re-search to identify divergent molecular pathways and cellular mechanisms underlying common behavioral phe-notype of ASD. Frequency modulations of the MEG visual gamma oscillations may provide important in-sights into neural deficits that follow dysregulation of
NMDA receptor signaling on FS PV+ inhibitory
cir-cuitry in ASD and possibly other neuropsychiatric disorders (e.g., schizophrenia, certain forms of mental retardation).
Additional files
Additional file 1: Table S1.Sensitivity and specificity of the AS and SCQ-lifetime scores.
Additional file 2: Table S2.Demographic and behavioral information on children included in statistical analysis of velocity-specific peak frequency (VSPF), mean ± sd (range).
Abbreviations
AMPA:α-amino-3-hydroxy-5-methyl-4-isoxazolepropionic acid; AQ: autism spectrum quotient; ASD: autism spectrum disorders; E/I balance: balance between excitation and inhibition; ECG: electrocardiogram;
EOG: electrooculogram; FS: fast spiking; FWHM: full width at half maximum; GABA: gamma-amino-butyric-acid; GLM: general linear modeling; HGO: high-frequency gamma oscillations; LFP: local field potential;
MEG: magnetoencephalography; NMDA:N-methyl-D-aspartate;
NMDAR: NMDA receptor; PV+: parvalbumin-expressing; RT: response time; TD: typically developing; tSSS: spatiotemporal signal space separation method; V1: primary visual cortex; VSPF: velocity-specific peak frequency.
Competing interests
The authors declare that they have no competing interests.
Authors’contributions
TS, EO, OS, and AB designed and conceived the experiment. OS, AN, AP, and MT collected the data. TS, AB, AP, EO, and AN cleaned and analyzed the MEG data. TS, EO, OS, and AB contributed to the interpretation and writing. MT performed the cohort characterization in terms of IQ, AQ, and SCQ. All authors read and approved the final manuscript.
Acknowledgements
We heartily thank the children and their families for their participation in this study. We are grateful to Dr. Vitaliy V. Gratchev, MD, PhD who performed the clinical assessment of the ASD cohort.
Grants
The study has been supported by Russian Science Foundation (grant №14-35-00060) and the charity foundation for autism“way out”. The MEG Centre is supported by core funding from the Russian Ministry of Education and Science RFMEFI61914X0006.
Received: 18 March 2015 Accepted: 29 June 2015
References
1. Persico AM, Bourgeron T. Searching for ways out of the autism maze: genetic, epigenetic and environmental clues. Trends Neurosci. 2006;29(7):349–58.
2. Geschwind DH. Genetics of autism spectrum disorders. Trends Cogn Sci. 2011;15(9):409–16.
3. Gandal MJ, Edgar JC, Ehrlichman RS, Mehta M, Roberts TP, Siegel SJ. Validating gamma oscillations and delayed auditory responses as translational biomarkers of autism. Biol Psychiatry. 2010;68(12):1100–6. 4. Pizzarelli R, Cherubini E. Alterations of GABAergic signaling in autism
spectrum disorders. Neural Plast. 2011;2011:297153.
5. Rubenstein JL, Merzenich MM. Model of autism: increased ratio of excitation/inhibition in key neural systems. Genes Brain Behav. 2003;2(5):255–67.
6. Billingslea EN, Tatard-Leitman VM, Anguiano J, Jutzeler CR, Suh J, Saunders JA, et al. Parvalbumin cell ablation of NMDA-R1 causes increased resting network excitability with associated social and self-care deficits.
Neuropsychopharmacology. 2014;39(7):1603–13.
7. Oblak A, Gibbs TT, Blatt GJ. Decreased GABAA receptors and benzodiazepine binding sites in the anterior cingulate cortex in autism. Autism Res. 2009;2(4):205–19.
8. Siegel M, Donner TH, Engel AK. Spectral fingerprints of large-scale neuronal interactions. Nat Rev Neurosci. 2012;13(2):121–34.
9. Vinck M, Womelsdorf T, Fries P. Gamma-band synchronization and information transmission. In: Quiroga R-Q, Panzeri S, editors. Principles of Neural Coding. CRC Press; Boca Raton, FL, USA; 2013. p. 449-69.
10. Bauer M, Oostenveld R, Peeters M, Fries P. Tactile spatial attention enhances gamma-band activity in somatosensory cortex and reduces low-frequency activity in parieto-occipital areas. J Neurosci. 2006;26(2):490–501. 11. Tallon-Baudry C, Bertrand O. Oscillatory gamma activity in humans and its
role in object representation. Trends Cogn Sci. 1999;3(4):151–62.
12. Cheyne D, Bells S, Ferrari P, Gaetz W, Bostan AC. Self-paced movements induce high-frequency gamma oscillations in primary motor cortex. Neuroimage. 2008;42(1):332–42.
13. Muthukumaraswamy SD. Functional properties of human primary motor cortex gamma oscillations. J Neurophysiol. 2010;104(5):2873–85. 14. Simmons DR, Robertson AE, McKay LS, Toal E, McAleer P, Pollick FE. Vision
in autism spectrum disorders. Vision Res. 2009;49(22):2705–39.
16. Zeng C, Li Y, Li C. Center-surround interaction with adaptive inhibition: a computational model for contour detection. Neuroimage. 2011;55(1):49–66. 17. Liu L, Pack C. Bidirectional manipulation of GABAergic inhibition in MT: a
comparison of neuronal and psychophysical performance. J Vis. 2014;14(10):13.
18. Self MW, van Kerkoerle T, Super H, Roelfsema PR. Distinct roles of the cortical layers of area V1 in figure-ground segregation. Curr Biol. 2013;23(21):2121–9.
19. Brown C, Gruber T, Boucher J, Rippon G, Brock J. Gamma abnormalities during perception of illusory figures in autism. Cortex. 2005;41(3):364–76. 20. Grice SJ, Spratling MW, Karmiloff-Smith A, Halit H, Csibra G, de Haan M,
et al. Disordered visual processing and oscillatory brain activity in autism and Williams syndrome. Neuroreport. 2001;12(12):2697–700.
21. Stroganova TA, Orekhova EV, Prokofyev AO, Tsetlin MM, Gratchev VV, Morozov AA, et al. High-frequency oscillatory response to illusory contour in typically developing boys and boys with autism spectrum disorders. Cortex. 2012;48(6):701–17.
22. Wright B, Alderson-Day B, Prendergast G, Bennett S, Jordan J, Whitton C, et al. Gamma activation in young people with autism spectrum disorders and typically-developing controls when viewing emotions on faces. PLoS One. 2012;7(7):e41326.
23. Whitham EM, Pope KJ, Fitzgibbon SP, Lewis T, Clark CR, Loveless S, et al. Scalp electrical recording during paralysis: quantitative evidence that EEG frequencies above 20 Hz are contaminated by EMG. Clin Neurophysiol. 2007;118(8):1877–88.
24. Yuval-Greenberg S, Tomer O, Keren AS, Nelken I, Deouell LY. Transient induced gamma-band response in EEG as a manifestation of miniature saccades. Neuron. 2008;58(3):429–41.
25. Hoogenboom N, Schoffelen JM, Oostenveld R, Parkes LM, Fries P. Localizing human visual gamma-band activity in frequency, time and space. Neuroimage. 2006;29(3):764–73.
26. Muthukumaraswamy SD, Singh KD. Visual gamma oscillations: the effects of stimulus type, visual field coverage and stimulus motion on MEG and EEG recordings. Neuroimage. 2013;69:223–30.
27. van Pelt S, Boomsma DI, Fries P. Magnetoencephalography in twins reveals a strong genetic determination of the peak frequency of visually induced gamma-band synchronization. J Neurosci. 2012;32(10):3388–92. 28. Edden RA, Muthukumaraswamy SD, Freeman TC, Singh KD. Orientation
discrimination performance is predicted by GABA concentration and gamma oscillation frequency in human primary visual cortex. J Neurosci. 2009;29(50):15721–6.
29. Cousijn H, Haegens S, Wallis G, Near J, Stokes MG, Harrison PJ, et al. Resting GABA and glutamate concentrations do not predict visual gamma frequency or amplitude. Proc Natl Acad Sci U S A. 2014;111(25):9301–6. 30. Ferando I, Mody I. In vitro gamma oscillations following partial and
complete ablation of delta subunit-containing GABAA receptors from parvalbumin interneurons. Neuropharmacology. 2015;88:91–8. doi:10.1016/j.neuropharm.2014.09.010.
31. Mann EO, Mody I. Control of hippocampal gamma oscillation frequency by tonic inhibition and excitation of interneurons. Nat Neurosci.
2010;13(2):205–12.
32. Kaiser J, Lutzenberger W. Human gamma-band activity: a window to cognitive processing. Neuroreport. 2005;16(3):207–11.
33. Eckhorn R, Frien A, Bauer R, Woelbern T, Kehr H. High frequency (60-90 Hz) oscillations in primary visual cortex of awake monkey. Neuroreport. 1993;4(3):243–6.
34. Gray CM, Viana Di Prisco G. Stimulus-dependent neuronal oscillations and local synchronization in striate cortex of the alert cat. J Neurosci. 1997;17(9):3239–53.
35. Orekhova EV, Butorina A, Sysoeva OV, Prokofyev A, Nikolaeva A, Stroganova TA. Frequency of gamma oscillations in humans is modulated by velocity of visual motion. J Neurophysiol. 2015:jn 00232 2015. doi:10.1152/
jn.00232.2015.
36. Muthukumaraswamy SD, Singh KD, Swettenham JB, Jones DK. Visual gamma oscillations and evoked responses: variability, repeatability and structural MRI correlates. Neuroimage. 2010;49(4):3349–57.
37. Shaw ME, Hamalainen MS, Gutschalk A. How anatomical asymmetry of human auditory cortex can lead to a rightward bias in auditory evoked fields. Neuroimage. 2013;74:22–9.
38. Hata Y, Tsumoto T, Sato H, Hagihara K, Tamura H. Inhibition contributes to orientation selectivity in visual cortex of cat. Nature. 1988;335(6193):815–7.
39. Kaufman AS, Kaufman NL. Kaufman assessment battery for children second edition. MN: American Guidance Service; 2004.
40. Auyeung B, Baron-Cohen S, Wheelwright S, Allison C. The autism spectrum quotient: children’s version (AQ-child). J Autism Dev Disord.
2008;38(7):1230–40.
41. Baron-Cohen S, Hoekstra RA, Knickmeyer R, Wheelwright S. The autism-spectrum quotient (AQ)—adolescent version. J Autism Dev Disord. 2006;36(3):343–50. 42. Rutter M, Bailey A, Lord C. The social communication questionnaire
(SCQ). Los Angeles: Western Psychological Services; 2003.
43. Bloss CS, Courchesne E. MRI neuroanatomy in young girls with autism: a preliminary study. J Am Acad Child Adolesc Psychiatry. 2007;46(4):515–23. doi:10.1097/chi.0b013e318030e28b.
44. Giarelli E, Wiggins LD, Rice CE, Levy SE, Kirby RS, Pinto-Martin J, et al. Sex differences in the evaluation and diagnosis of autism spectrum disorders among children. Disabil health J. 2010;3(2):107–16. doi:10.1016/j.dhjo.2009.07.001.
45. Taulu S, Kajola M, Simola J. Suppression of interference and artifacts by the signal space separation method. Brain Topogr. 2004;16(4):269–75. 46. Tadel F, Baillet S, Mosher JC, Pantazis D, Leahy RM. Brainstorm: a user-friendly
application for MEG/EEG analysis. Comput Intell Neurosci. 2011;2011:879716. 47. Tesche CD, Uusitalo MA, Ilmoniemi RJ, Huotilainen M, Kajola M,
Salonen O. Signal-space projections of MEG data characterize both distributed and well-localized neuronal sources. Electroencephalogr Clin Neurophysiol. 1995;95(3):189–200.
48. Uusitalo MA, Ilmoniemi RJ. Signal-space projection method for separating MEG or EEG into components. Med Biol Eng Comput. 1997;35(2):135–40. 49. Litvak V, Mattout J, Kiebel S, Phillips C, Henson R, Kilner J, et al. EEG and
MEG data analysis in SPM8. Comput Intell Neurosci. 2011;2011:852961. 50. Thomson DJ. Spectrum estimation and harmonic analysis. Proc IEEE.
1982;70(9):1055–96.
51. Holland PW, Welsch RE. Robust regression using iteratively re-weighted least-squares. Commun Stat - Theor M. 1977;6(9):813–27.
52. Litvak V, Eusebio A, Jha A, Oostenveld R, Barnes G, Foltynie T, et al. Movement-related changes in local and long-range synchronization in Parkinson's disease revealed by simultaneous magnetoencephalography and intracranial recordings. J Neurosci. 2012;32(31):10541–53.
53. Nichols TE, Holmes AP. Nonparametric permutation tests for functional neuroimaging: a primer with examples. Hum Brain Mapp. 2002;15(1):1–25. 54. Rinehart NJ, Bradshaw JL, Brereton AV, Tonge BJ. Movement
preparation in high-functioning autism and Asperger disorder: a serial choice reaction time task involving motor reprogramming. J Autism Dev Disord. 2001;31(1):79–88.
55. Swettenham JB, Muthukumaraswamy SD, Singh KD. Spectral properties of induced and evoked gamma oscillations in human early visual cortex to moving and stationary stimuli. J Neurophysiol. 2009;102(2):1241–53. 56. Uhlhaas PJ, Pipa G, Neuenschwander S, Wibral M, Singer W. A new look at
gamma? High- (>60 Hz) gamma-band activity in cortical networks: function, mechanisms and impairment. Prog Biophys Mol Biol. 2011;105(1-2):14–28. 57. Perry G, Hamandi K, Brindley LM, Muthukumaraswamy SD, Singh KD.
The properties of induced gamma oscillations in human visual cortex show individual variability in their dependence on stimulus size. Neuroimage. 2012;68:83–92.
58. Hall SD, Holliday IE, Hillebrand A, Singh KD, Furlong PL, Hadjipapas A, et al. The missing link: analogous human and primate cortical gamma oscillations. Neuroimage. 2005;26(1):13–7.
59. Hadjipapas A, Adjamian P, Swettenham JB, Holliday IE, Barnes GR. Stimuli of varying spatial scale induce gamma activity with distinct temporal characteristics in human visual cortex. Neuroimage. 2007;35(2):518–30. 60. Muthukumaraswamy SD, Singh KD. Spatiotemporal frequency tuning of
BOLD and gamma band MEG responses compared in primary visual cortex. Neuroimage. 2008;40(4):1552–60.
61. Gross E, El-Baz AS, Sokhadze GE, Sears L, Casanova MF, Sokhadze EM. Induced EEG gamma oscillation alignment improves differentiation between autism and ADHD group responses in a facial categorization task. J Neurother. 2012;16(2):78–91. 62. Sun L, Grutzner C, Bolte S, Wibral M, Tozman T, Schlitt S, et al.
Impaired gamma-band activity during perceptual organization in adults with autism spectrum disorders: evidence for dysfunctional network activity in frontal-posterior cortices. J Neurosci. 2012;32(28):9563–73. 63. Milne E, Scope A, Pascalis O, Buckley D, Makeig S. Independent component