Image Contrast Enhancement using Tri-histogram
Equalization based on Minimum and Maximum Intensity
Occurrence
Al Mehdi Saadat Chowdhury
Lecturer, Department of Computer Science and Engineering, North East University Bangladesh, Bangladesh, [email protected]
M. Shahidur Rahman
Professor, Department of Computer Science and Engineering, Shahjalal University of Science and Technology, Bangladesh, [email protected]
Abstract — This paper proposes an image enhancement technique using Tri-histogram equalization defined in terms of minimum and maximum intensity. Traditionally for image contrast enhancement, histogram equalization technique is used extensively. However, histogram equalization tends to change the mean brightness of any image to the middle gray level of the dynamic range, which often results in over or under enhancement and introduce some annoying artifacts. To overcome such problems, several bi-histogram based techniques and one tri-histogram based technique has been proposed. While bi-histogram based techniques divides the histogram of any image into two sub-histograms and equalize them independently, tri-histogram based technique divides the histogram into three sub histograms. This paper presents a novel tri-histogram based enhancement approach where two intensity values which are used to divide the histogram into three parts can be found by computing the minimum and maximum pixels per intensity count. After dividing the histogram into three parts, each of the parts are equalized individually and then combined together to produce the final enhanced image. The simulation results show that the proposed method outperforms other conventional bi-histogram and tri-histogram based techniques in terms of brightness preservation, structural similarity and PSNR.
Keyword — Brightness Preservation, Digital Image Processing, Image Enhancement, Intensity, Tri-histogram Equalization
1. INTRODUCTION
Most of the consumer graded image sensing device capture images that are significantly flat. Thereby, contrast enhancement plays a major role in the improvement of visual quality in computer vision, pattern recognition and in the processing of digital images. Among many other techniques for contrast enhancement, Global Histogram Equalization (GHE) was the most extensively utilized one. The target of global histogram equalization is to achieve uniform distribution of
intensities for any image, which is done by flattening the probability distribution of that image and stretching the dynamic range of gray levels. In theory, the mean brightness of the histogram equalized image is always the middle gray level regardless of the input mean, which in practice, makes this method less ideal for consumer electronic appliances where brightness preservation is a necessary aim [2].
Several algorithms have been proposed by many researchers over the recent years to solve the aforementioned problem of GHE. One of the earliest attempts was Brightness Preserving Bi-histogram equalization (BBHE) which divides the input image histogram into two parts based on the input mean brightness and equalize both parts individually to obtain the final image [4]. Later, [8] proposes a new method namely equal area Dualistic Sub-Image Histogram Equalization (DSIHE) in which the authors claimed to outperform BBHE in terms of brightness preservation and image content (entropy) preservation. In DSIHE, instead of using mean brightness to divide the histogram as in BBHE, median value was chosen.
Copyright © 2016 CTTS.IN, All right reserved Among some of the recent techniques, Exposure based
Sub Image Histogram Equalization (ESIHE) [7] tries to separate the input histogram into two by finding an exposure threshold value and then clipping the histogram using clipping threshold, finally equalizing both of the clipped histogram separated by the exposure threshold individually. Another technique known as Statistic Separate Tri-Histogram Equalization (SSTHE) [5] was the first instance of the tri-histogram based separation technique which couldn’t outperform any of the aforementioned bi-histogram based equalization methods.
Although various techniques are available to solve a broad range of enhancement problems, very little effort has been made on tri-histogram based contrast enhancement. In this paper, we present a new tri-histogram equalization algorithm refers to Minimum and Maximum Intensity based Tri-Histogram Equalization (MMITHE). Study shows that, the proposed method performs better in brightness preservation and contrast enhancement for low contrast and under-exposed images. The rest of the paper is organized as follows: Section 2 presents the new tri-histogram based separation technique using minimum and maximum intensity as division points. Section 3 describes about absolute mean brightness error measurement feature used to measure enhanced images brightness preservation and quality. Section 4 gives experimental results with section 5 concluding the paper.
2. MINIMUM AND
MAXIMUM
INTENSITY
BASED TRI-HISTOGRAM EQUALIZATION
In contrast to all of the bi-histogram equalization methods described in the previous section, tri-histogram based equalization methods chooses two intensity values to divide the histogram of the input image into three parts and then equalize each part individually.Suppose X = {X(i,j)} denotes an input image composed of L discrete gray levels, denoted by {X0,X1,...,XL1}
and Xmin and Xmaxdenotes intensity values with minimum and maximum pixel per intensity count respectively, such that, Xmin {X0,X1,...,XL 1}
andXmax {X0,X1,...,XL 1}. These two intensity values
can be used to divide the input image into three sub-images Xl, Xm and Xu such that,
u m
l X X
X X (1) where X j i X X j i X j i X
Xl (, )| (, ) min, (, )
(2) X j i X X j i X X j i X
Xm (, )| min (, ) max, (, ) (3)
and X j i X X j i X j i X
Xu (, )| (, ) max, (, ) (4)
This means, sub-image Xl consist of all pixels with intensity values in the range{X0,X1,...,Xmin}, Xm consist
of all pixels with intensity values in the
range{Xmin 1,Xmin 2,...,Xmax}and Xu consist of all pixels
with intensity values in the
range{Xmax 1,Xmax 2,...,XL 1}.
Now, the probability density function (PDF) of the sub-images Xl, Xm, Xu can be defined as
l k k l n n X
PDF( ) (5)
where k = 0, 1, …, min, and
m k k m n n X
PDF ( ) (6)
where k = min+1, min+2, …, max, and
u k k u n n X
PDF ( ) (7)
where k = max+1, max+2, …, L-1. Here, min
0 k k l n n , max 1 min k k m n
n and 1
1 max
L
k k
u n
n represents the
total number of pixels in the sub-image Xl, Xm and Xu respectively. Note that, the total number of pixels in the image isN nl nm nu, by definition. From the above
definition of the probability density function, cumulative density function (CDF) can be defined as
min 0 ) ( ) ( j j l k
l X PDF X
CDF (8)
where k = 0, 1, …, min, and
max 1 min ) ( ) ( j j m k
m X PDF X
CDF (9)
where k = min+1, min+2, …, max, and
1 1 max ) ( ) ( L j j u k
u X PDF X
CDF (10)
where k = max+1, max+2, …, L-1. Note that, by definition, CDFl(Xk) = CDFm(Xk) = CDFu(Xk) = 1. We can define the transformation function fl(Xk), fm(Xk) and fu(Xk) exploiting the cumulative density functions obtained from Eqs. (8), (9) and (10) as
) ( ) (
)
( k 0 min 0 l k
l X X X X CDF X
f (11) ) ( ) ( )
( k min1 max min 1 m k
m X X X X CDF X
f (12) and ) ( ) ( )
( k max 1 L 1 max 1 u k
u X X X X CDF X
f (13)
Based on these transform functions, the decomposed sub-images are equalized independently and the union of these equalized sub-images form the final output image. Mathematically we can state this as, Y is the output image found by
) ( ) ( ) ( ) ,
(i j fl Xk fm Xk fu Xk
Y
Y (14)
which is expected to result in better brightness preservation than the global histogram equalization. 2.1 Analysis on the Brightness Change by MMITHE It is well known that, the enhancement result of GHE produces an image with uniform gray level, i.e.
0 1 1 ) ( X X X PDF L (15)
for X0 ≤ X ≤ XL-1. This PDF can be used to derive statistically expected output mean, E(.) of the GHE method, which is
2 ) ( ) ( 0 1 0 1 1 0 1 0 X X dx X X x dx x xPDF Y E L X X L X X L L (16)
The derivation above is evident on one principle drawback of the GHE method which is, GHE produces the enhanced image where mean of that image always resides in the middle gray region, regardless of the property of the input image. This means, whether we provide a dark or light image, low contrast or high contrast image, GHEs output mean will always be the middle gray level.
This property is not desired in consumer graded applications. On the other hand, if we analyze our proposed MMITHE method, we find that, the mean brightness of the output image can be expressed as
) ( ) 2 ( ) ( ) 2 ( ) ( ) 2 ( ) ( ) | ( ) ( ) | ( ) ( ) | ( ) ( max 1 1 max max min max 1 min min min 0 max max max min max min min min X X PDF X X X X X PDF X X X X PDF X X X X PDF X X Y E X X X PDF X X X Y E X X PDF X X Y E Y E L (17)
For ease of calculation, let the input image is equally distributed over the two dividing points Xmin and Xmax, which, in turn makes
3 1 ) ( ) ( ) ( max max min min X X PDF X X X PDF X X PDF (18)
From equation (17), we now have
) 1 ( 3 1 ) 2 2 2 2 ( 3 1 ) 2 1 ( 3 1 ) 2 1 ( 3 1 ) 2 ( 3 1 ) ( max min max min 1 0 1 max max min min 0 X X X X X X X X X X X X X Y E G L L (19)
Where XG=(X0+XL-1)/2. Above equation is evident that, the expected output mean brightness of the equalized image can be found by averaging the middle gray level of the dynamic range with the chosen two division points which are the minimum and maximum intensity occurrences in the proposed method.
2.2 Algorithm of MMITHE
Step 1: Compute the histogram, h(k) of the input image. Step 2: From the histogram, find intensities with
minimum and maximum pixel per intensity count.
Step 3: Divide the input image into three sub-images using minimum and maximum intensity values obtained in step 2.
Step 4: Apply histogram equalization on the sub-images obtained in step 3.
Step 5: Combine the equalized images obtained in step 4 into one output enhanced image
3. MEASUREMENT
FEATURE TO
ASSES
IMAGE
QUALITY
In this section, we provide definition to the most extensively used image quality assessment feature to analyze the brightness preservation of an enhancement method, known as absolute mean brightness error (AMBE), which we used to analyze our test images. 3.1 Absolute Mean Brightness Error (AMBE)
Absolute mean brightness error is a measurement feature used to measure how close the mean brightness of the enhanced image is to the input image. Hence, it’s a measure to prove the enhanced image’s brightness preservation. AMBE is defined as
m m Y
X Y X
AMBE( , ) (20)
where Xm is the mean of the input image X={X(i,j)} and
Ym is the mean of the output enhanced image Y={Y(i,j)}. Both of the mean brightness can be obtained by
1 1 1 1 ) ( ) ( . L K L K m K PDF K PDF K X (21)
For a particular image, the smaller the value of AMBE, the better its brightness preservation is obtained.
4. RESULTS AND DISCUSSIONS
Copyright © 2016 CTTS.IN, All right reserved Table 1 shows a matrix of AMBE measurements between
test images where rows correspond to the test images and columns correspond to enhancement methods. As can be seen from table 1, compared to other methods, MMITHE provides significantly better brightness preservation for a broad range of images as evident from the minimum
value of AMBE. MMBEBHE is also very good in terms of brightness preservation, while other bi-histogram based methods such as BBHE, DSIHE, ESIHE, along with the existing tri-histogram based method SSTHE performs poorly in the tested cases.
Table 1. AMBE measurement between test images
File GHE Bi-HE Methods Tri-HE Methods
BBHE DSIHE MMBEBHE ESIHE SSTHE MMITHE
Mount Teide 81.0916 27.8927 22.622 12.7794 56.5199 27.1936 11.8317
Fish 42.5636 26.1404 25.0187 10.6076 18.8043 23.6254 4.2324
Wheel 41.3501 10.3941 15.4912 1.3053 5.9665 16.9197 1.036
House 52.658 16.4289 17.9424 14.7611 24.3205 15.1204 12.7702
Snow Hill 3.3994 2.2087 2.2087 1.4095 10.8823 9.0521 1.119
Cameraman 10.4783 24.2581 17.9147 1.1832 17.3724 21.091 0.68476 Restaurant 20.561 10.0057 10.2009 1.2093 3.3959 11.1965 0.12589 Stanwick 5.1929 5.3568 0.16319 9.8087 8.9367 14.0288 0.053192 Qualitative measures are equally important along with
quantitative measures, since contrast enhancement can only be appreciated if the resultant image gives a pleasing appearance. To test the robustness of the proposed method, a range of low to high contrast images are used. All these images are analyzed using the existing bi-histogram and tri-histogram based methods.
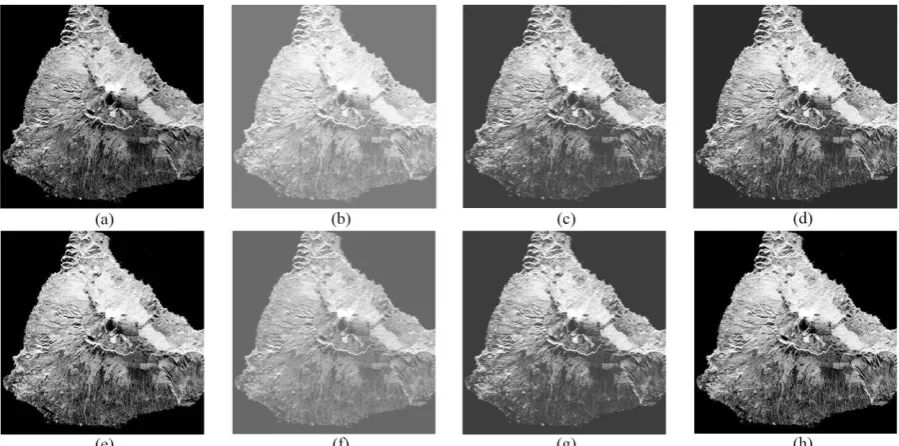
The concrete result of contrast enhancement is clearly observed in Figure 1 to 3. If we closely observe the background of the Mount Teide image in Figure 1, we find that, GHE, BBHE, ESIHE, SSTHE significantly degrade the quality of that region by over-enhancement, while DSIHE, MMBEBHE and the proposed method provides better control for over-enhancement.
Fig. 1. Enhancement results of Mount Teide image: (a) Original, (b) GHE, (c) BBHE, (d) DSIHE, (e) MMBEBHE, (f) ESIHE, (g) SSTHE, (h) MMITHE
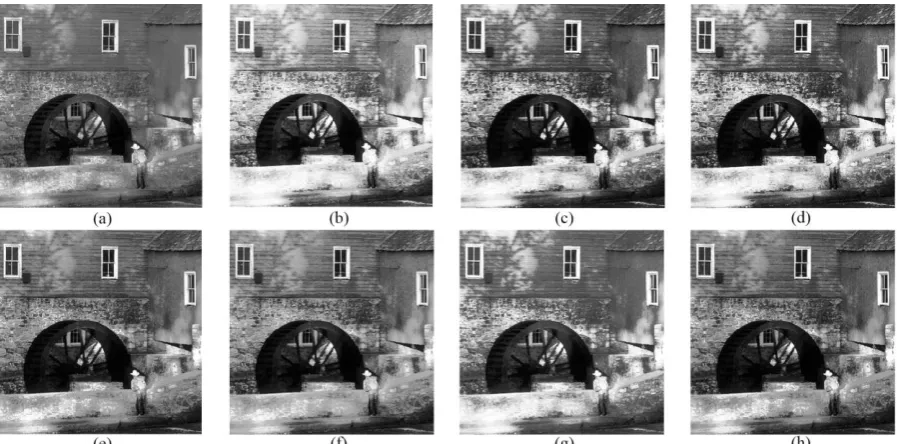
The background of Figure 2 of the fish image is similarly over enhanced by GHE, BBHE, DSIHE, ESIHE and SSTHE methods. Only MMBEBHE and the proposed method provide better overall enhancement. Again, Figure 3 shows that the jacket of the observer is blown out by GHE, BBHE, DSIHE and SSTHE, while rest of
Fig. 2. Enhancement results of Fish image: (a) Original, (b) GHE, (c) BBHE, (d) DSIHE, (e) MMBEBHE, (f) ESIHE, (g) SSTHE, (h) MMITHE
Fig 3. Enhancement results of Wheel image: (a) Original, (b) GHE, (c) BBHE, (d) DSIHE, (e) MMBEBHE, (f) ESIHE, (g) SSTHE, (h) MMITHE
5. CONCLUSION
In this paper, we proposed a novel contrast enhancement technique based on tri-histogram equalization. The proposed tri-histogram based enhancement technique is very much effective in terms of brightness preservation. The algorithm is also easy to implement in real-time processing. Also the enhanced images has a promising visual quality for display purpose in consumer graded electronic devices. Thus the proposed technique can be a good selection for image contrast enhancement.
REFERENCE
[1] Chen, S.D., Ramli, A.R., “Contrast enhancement using recursive mean-separate histogram equalization for scalable brightness preservation”, IEEE Trans. on Consumer Electronics, vol. 49, no. 4, 2003, pp. 1301–1309.
[2] Chen, S.D., Ramli, A.R., “Minimum mean brightness error bi-histogram equalization in contrast enhancement”, IEEE Trans. Consumer Electron, vol. 49, no. 4, 2003, pp. 1310–1319. [3] Kim, M., Chung, M.G., “Recursively separated and
Copyright © 2016 CTTS.IN, All right reserved Trans. Consumer Electron, vol. 54, no. 3, 2008, pp.
1389–1397.
[4] Kim, Y.T., “Contrast enhancement using brightness preserving bi-histogram equalization”, IEEE Trans. on Consumer Electronics, vol. 43, no. 1, 1997, pp. 1–8.
[5] Lin, P.H., Lin, C.C., Yen, H.C., “Tri-Histogram Equalization Based on First Order Statistics”, IEEE 13th International Symposium on Consumer Electronics, Kyoto, 2009, pp. 387-391.
[6] Sim, K.S., Tso, C.P., Tan, Y.Y., “Recursive sub-image histogram equalization applied to gray scale images”, Pattern Recogn. Lett, vol. 28, no. 10, 2007, pp. 1209–1221.
[7] Singh, K., Kapoor, R., “Image enhancement using Exposure based Sub Image Histogram Equalization”, Pattern Recogn. Lett, vol. 36, 2014, pp. 10-14.