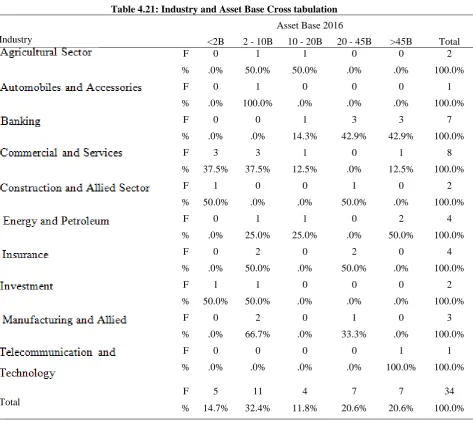
Relationship between Capital Structure and Performance of
Listed Firms in Nairobi Securities Exchange in Kenya
Erastus G Ngure
1, Fredrick Mutea
1, Wilson Muema
11. Department of Business Administration, School of Business and Economics, Kenya Methodist University(KEMU)
Introduction
This chapter provides a detailed introduction to the research topic. It defines what capital structure and performance is, and delimits the contextual and conceptual scope within which the two variables are assessed in the study. The study's objective and hypothesis are presented at this stage with the assumptions and limitations likely to be encountered in the research process also documented.
1.1 Background of the Study
In general, the assets of a firm are financed by a combination of equity shares, preference shares, retained earnings, short-term debt, reserves, and long-term debt (Patra& Panda, 2006). The financing mix of a firm together comprise the capital structure of the firm. The financing mix may take the form of the unlevered firm, where it is financed wholly through equity. A firm can also be levered, by financing it through debt capital only, which is impractical since rarely will any provider of funds invest in a firm without owners. In most cases, the capital structure of the firm comprises a combination of both equity and debt, which depends on the consideration of certain proportions (Ishaya&Abduljeleel, 2014). Often, disputes arise when the strength of shareholders' equity is reduced due to debt providers. This makes the capital structure very essential in maximizing shareholders' wealth and ensuring the steady performance of a firm (Ishaya&Abduljeleel, 2014). The most appropriate capital structure lessens the cost of capital and returns are maximized. This further enhances the performance of a firm (Salazar, Soto, &Mosqueda, 2012). Therefore, the collapse of a firm might be due to the lack of an appropriate capital structure to steers growth and promote its performance (Memba&Nyanumba, 2013).
The above discussion implies the existence of a connection between capital structure and firm performance. A study by Nenu, Vintila&Gherghina (2018) emphasized the correlation between capital structure on one hand and the performance of the firm and the share price on the other hand. Various researchers have
given divergent views concerning the relationship between components of capital structure and firm performance. Muigai (2016) stated that firms need to utilize shareholders' equity and less debt in their financing mix since debt is seen as a major contributor to financial distress. This study recommends the adoption of debt in the long term before debt in the short term after equity is exhausted. Conversly, Uwalomwa, and Uadiale (2012) posited that having long term debt in the financing mix leads to low performance in the firm. Besides, Njagi (2013) stated that the use of debt improves the shareholders' control by the creditor and payment of tax to the government for use of debt. On the other hand, debt capital increases agency costs between shareholders and creditors.
Memba and Job (2013) concluded that the capital structure of financing has a relationship with performance. Vătavu (2015) links the choice of financing to impacts on the share market price and the value of the company. Therefore, suitable considerations need to be carried out while making capital structure decisions to avoid firm financial distress (Memba&Nyanumba, 2013). There are various alternatives for choosing the appropriate capital structure, which requires a deeper understanding of the relationship between capital structure and firm performance, especially in public traded companies. Divergent views such as these have led to the need for researchers to further investigate the relationship between the capital structure of a firm and its performance in different contexts.
Nevertheless, a debate exists on the best way to finance firm operations to promote optimal results. This has led to divergent views on whether capital structure impacts firm performance. In this context, increased and sustained profitably is the primary financial performance indicator that is relied upon to measure and compare the financial wellbeing of firms operating in a given industry as well as to compare the overall performance of different industries (Ongore&Kusa, 2013). Financial performance can be indicated using several tools, which are employed depending on the target stakeholders. In tracking the financial performance of a firm, each stakeholder's interests tend to be different; for example, whereas creditors are interested in the firm's liquidity, investors are keen on profitability. Considering the variant stakeholder expectations, financial performance measurement tools are divergent and examine such key areas as profitability, liquidity, gearing (financial risk), and efficiency (asset utilization) of the firm (Ongore&Kusa, 2013).
Specifically, the performance of Kenyan publicly traded firms has attracted a lot of interest in the recent past. Most of these companies, especially those classified under the NSE 20 share Index, which is a measure of the 20 best-performing companies, have posted poor financial performance results. The financial problems in these firms, which are drawn from various industrial sectors led to the decline of market turnover, from Ksh.15.11 billion in 2015 to Ksh.7.11 billion in December 2016, and market capitalization, from Ksh. 2.05 trillion in 2015 to Ksh.1.96 trillion in 2016 (Anyanzwa, 2017). While the decline experienced in 2016 has provided an opportunity for investors to venture into the Nairobi bourse, a need exists for the individual firms to assess their capital structures to assure entrant and existing shareholders of sustainable and economically viable financial returns.
In relation to capital structure and performance, divergent views such as these have led to the need for researchers to further investigate the relationship between the capital structure of a firm and its performance in different contexts. Nevertheless, this analysis aims to investigate the relationship between the capital structure and performance of the companies listed in the NSE.
1.2 Problem Statement
Capital structure has been put forth in finance literature as an important antecedent to improved financial performance (Memba& Job, 2013). A study by Margaritis and Psillaki (2010) demonstrates that concentrated ownership improves firm performance, while capital ownership results in increased debt in an enterprise's capital structure. Berger and Di Patti, (2006) affirms this finding by observing that a lower equity ratio results in improved profitability for a firm. These studies provide sufficient evidence of the close relationship between capital structure and performance.
financial structures to assure entrant and existing shareholders of sustainable and economically viable financial returns. Despite this, there are very little advances in documenting the importance of capital structure in improving performance. Existing studies have made profound efforts in documenting the importance of capital structure in fostering performance; however, they have focused either on specific industries (Njagi, 2013) or a particular financing approach (Mwangi, Makau, &Kosimbei, 2014). As a result, there is a lack of adequate empirical literature that can be relied upon by Kenyan firms in their restructuring efforts. Therefore, this study endeavors to bridge this void by conducting a study that cuts across firms quoted at the securities market.
1.3 General Objective
The objective of this study is to assess the relationship between capital structure and performance of listed firms at the NSE.
1.4 Specific Objective
I. To determine the effect of internal financing on the performance of listed firms in Kenya. II. To assess the effect of equity financing on the performance of listed firms in Kenya. III. To establish the effect of short term debt on the performance of listed firms in Kenya. IV. To evaluate the effect of long-term debt on the performance of listed firms in Kenya.
1.5 Research Hypothesis
H0: There is a significant relationship between the internal financing and performance of listed firms in Kenya.
H1: There is no significant relationship between the internal financing and performance of listed firms in Kenya.
H0: There is a significant relationship between equity financing and performance of listed firms in Kenya.
H2: There is no significant relationship between equity financing and performance of listed firms in Kenya.
H0: There is a significant relationship between short term debt and the performance of listed firms in Kenya.
H3: There is no significant relationship between short term debt and the performance of listed firms in Kenya.
H0: There is a significant relationship between long term debt and the performance of listed firms in Kenya.
H4: There is no significant relationship between long term debt and the performance of listed firms in Kenya.
1.6 Significance of the Study
The findings of this study will be of great importance to the management of the listed companies as it will discuss the most critical factors surrounding financial components and their impact on the performance of the listed companies. This will contribute to a greater understanding of approaches a firm can use to raise funds so as to increase its performance, and become a market leader. The findings of this study will also be of great importance to researchers as they will make significant contributions to existing knowledge and literature. Financial consultants and financial analysts will find the study helpful in their social and advisory services on methods to finance a firm, especially listed companies.
Most importantly, the results will contribute to the growth of the Kenyan economy. Numerous research has linked listing companies in the NSE to immense economic growth (Njiraini, 2006; Omoke, 2010; Owiti, 2012; Nyamakanga, 2013; Kipchumba, 2017; Njenga, 2016). Furthermore, public listed companies are very crucial for achieving numerous economic agendas in Kenya. For instance, by being listed in the NSE, companies facilitate NSE's role to mobilize domestic and international resources for investment in Kenya and make Kenya a central financial hub in Africa, that is based on the capital markets Master Plan in Vision 2030 (NSE, CO. profile). These contributions will also fast-track the attainment of other internal and external economic development agendas, including African Union's (AU) African Agenda 2063, United Nations (UN's) 17 Sustainable Development goals (SDG), and Kenya's Big Four Agenda. As the listed firms improve, so will the economy.
1.7 Scope of the Study
III), including its self-listing in September 2014. This made it the second African Exchange to be listed, after the Johannesburg Stock Exchange. As of August 2016, the listed firms were categorized under 10 major industrial sectors, which included an additional 3 categories for debt securities NSE. In this study, these sectors were analyzed separately to provide suitable conclusions about the various companies trading in NSE. Data was collected from financial managers from each of the 51 listed companies that were in operation for the eight years of concern to the study.
1.8 Limitations of the Study
Most listed companies considered some information confidential and, hence, they were concerned about revealing it. The researcher could not verify the accuracy of the financial reports given by respondents. It is not uncommon for firms to provide doctored financial reports that make them look favorable to potential investors. There is no way to deal with this limitation in this study as none of the companies had been reported for this crime. The data was used based on the assumption that they were accurate.
1.9 Assumption of the study
Data obtained through questionnaires was valid since the data collection instrument developed was reliable and appropriate for the study. The researcher operated with the assumption that the financial statements found on the company websites were accurate. Moreover, the study also adopted a working assumption that the financial crisis that was witnessed in 2008 did not spill over to the period under study since this would significantly affect the equity-debt ratio.
Literature Review
2.1 IntroductionThis chapter detailed relevant literature on the relationship that exists in the Nairobi Securities Exchange between capital structure and performance of the listed companies. This concentrated on theoretical analysis, empirical examination, and conceptual context.
2.2 Theoretical Review
In this section, relevant theories were reviewed in order to establish the theoretical framework of this study.
2.2.1 Capital Structure and Firm Performance
Capital structure entails the method through which a firm chooses to finance its assets and operations. Firms can choose to finance their operations and assets through shareholder's equity, debt financing, or a combination of both (Orangi, 2017). An appropriate mix of debt and equity financing enhances the performance of a firm. This mix is referred to as the optimal capital structure and is meant to reduce the cost of capital thus, maximizing the value of the firm through the best combination of shareholder's equity and debt. Mwangi, Makaun&Kosimbei (2014) argued that the optimal capital structure is determined by variables/components such as the overall size of the firm, projected growth, the profitability margin, the liquidity level, and the level of tangible assets of a firm. These components of the capital structure of a firm have varied influences on firm performance.
The performance of a firm is determined by the firm's profitability and especially return on equity, return on total capitation, and sales profit margins. These measures depend upon the historical accounting data patterns generating them. Samuel (2016) claimed that the performance of a firm also depends on the market perception of a firm's competitiveness, expected returns, and riskiness of the current investments of a firm. Perception is particularly applied by lenders and investors in the stock market. The debt share of assets and shareholders' equity is also used as a measure of a firm's performance as well as debt repayment history (Hagel, Brown & Davison, 2010).
allows a firm to choose the financing mix between equity and debt that maximizes the firm's value. This determines the firm's performance in the long run.
2.2.2 Pecking Order Theory
The pecking order theory was developed by Myers and Majluf (1984). The theory proposes that a firm has a particular order in making a financing decision. Therefore, information asymmetry contributes to the increased cost of financing. According to this model, firms rank their alternatives for finance sources. Precisely, they rank internal financing first and use it till exhausted, before they turn to debt and equity as the last alternative. Internal financing is preferred due to its nature of no flotation cost and expenses on disclosures (Kishore, 2009). This implies that businesses access external funds once the internal funding is considered inadequate to facilitate the financing of a project. Equity issues experience asymmetric information problems compared to debt (Meier &Tarhan, 2007). However, the adverse selection is always available in external financing but in different measures; this leads managers in selecting debt first before equity.
This theory makes a number of assumptions, which denote its insufficiency. Firstly, it assumes that there exists information asymmetry, which entails the fact that managers practice insider trading since they possess more information about the future of the organization. Additionally, the managers perform in the best interest of existing shareholders (Sheikh & Wang, 2011). Consequently, potential investors are disadvantaged. Furthermore, the theory does not consider the fact that most firms keep some cash for caution in anticipation of the financial crisis (Kishore, 2009). Additionally, not all firms make an adequate profit to be used as an internal form of finance, an assumption that is one of the major indicators of the principle's weakness (Upneja&Dalbor, 2001). The theory also does not work if all the shares are allocated to existing shareholders since they are in the strong form of an efficient market hypothesis (Abosede, 2012).
Nevertheless, previous studies carried out byNwude, Itiri, Agbadua, and Udeh (2016) have been in support of this theory. Fama& French (2002) found larger firms to demonstrate pecking order behavior than the small ones. Thus, the pecking order theory forms bases for discussing the variables that are financing through equity, short term, and long term debts.
This theory relates to this study in various ways. Firstly, it facilitates an understanding of the capital structure of different companies listed in the NSE by comparing their debt-equity ratio. Furthermore, it enables an analysis of the company's worth.
2.2.3 Trade-Off Theory
Myers (1984) developed this theory, and it is derived from tax and agency cost-based models. Modigliani and Miller (1963), DeAngelo and Masulis (1980), and Jensen and Meckling (1976) indicate that businesses can have an optimal capital structure by offsetting the debt and debt cost benefits. The trade-off theory thus refers to the idea that a business determines the amount of debt funding and equity financing to use by weighing the costs and benefits. It states that each funding option has its advantages and shortcomings. For instance, financing with debt leads to numerous benefits related to a tax of debt. However, debt financing has costs like the costs of financial distress, bankruptcy costs, and agency costs.
This theory is useful for this study for two reasons. It allows one to understand the rationale behind an individual firm's financing mix. More importantly, it suggests that there could be a favorable relationship between the choice of finance and firm performance. Moreover, this trade-off theory implies that firms have target leverage, which presents optimal outcomes for the firm. Over time, businesses adjust their leverage toward the target to achieve maximum results.
2.3 Empirical Review
Many empirical studies studied the relationship between various types of financial structures to effects the success of companies.
2.3.1 Equity and Performance
Akbarpour and Aghabeygzadeh (2011) reviewed literature on whether a relationship exists between the financial structure and the success of companies listed in the Tehran Stock Exchange. Data collected by using library research and rahaverdnovin software were from the 101 listed firms. Multiple regression analysis was used, and the results indicated that a significant relationship existed between financial structure and asset returns. Nevertheless, on financial structure and profitability, no meaningful connection was found. Additionally, Arulvel and Ajanthan (2013) studied capital structure and financial performance and found out that debt ratio and debt to equity ratio were negatively correlated with net profit, gross profit, and return on equity. This was in line with a report by Pratheepkanth (2011) on listed companies at the Sri Lankan Colombo stock exchange.
Takeh and Navaprabha (2015) conducted a study on the capital structure and its effect on financial performance over 5 years from 2007 to 2012. The results of the multiple regression analysis gave the impression that the financial performance effect on the capital structure is important. The findings of the correlation study depicted a negative link between capital structure and financial performance. Thus, there is a need for the firms to inject more funding from internal rather than borrowing, as the benefits of borrowing are less than the cost of internal financing.
Nwude, Itiri, Agbadua, and Udeh (2016) studied the effect of the debt system on the financial performance of listed companies in Nigeria. We used information on financial statements and analyzed them using the concept of regression. The results indicated that there is a significant negative relationship between a firm's debt structure and efficiency when calculated using the return on assets. This research reinforced the pecking order principle. An increase in the cost of funding a company externally is therefore due to moral hazard and adverse selection. Therefore, a firm needs to consider the payback derived from debt against financial distress.
Samuel (2016) did a study on the impact of capital structure on Kenyan commercial banks' financial performance. Secondary data was used and multiple linear regression adopted. The outcome revealed that debt, preference shares, and retained earnings are positively related to financial performance while ordinary shares are negatively related. The researcher, therefore, recommended that firms should maintain a low number of ordinary shares to avoid financial distress. The study did not consider other factors like advertising, inflation, or even government policies.
2.3.2 Short-term debt and performance
In a review study conducted by Githaiga and Kabiru (2015) about debt financing and financial performance of 50 SMEs in Eldoret Kenya, stratified sampling was used to get secondary data. Regression results disclosed that short term debt and long term debt have a negative effect on financial performance. It was noted by the researcher that SMEs are disadvantaged over the large firms since they can't raise funds in the capital market. The researcher thus recommended the firms to diversify their ways of raising funds so as to improve their sustainability.
Muchiri, Muturi, and Ngumi (2016) have studied the relationship between the financial structure and performance of listed companies at East Africa Securities Exchanges. They followed the explanatory research design and collected secondary panel data for 61 companies, spanning from 2006-2014. The results from correlation and regression analysis indicated that current liabilities, non-current liabilities, internal equity, and external equity had an insignificant negative relationship with financial performance. Additionally, economic growth had a moderately significant impact. The study, therefore, recommended that before making financing decisions managers need to study and understand the business cycles.
2.3.3 Long-term debt and performance
Chemutai, Ayuma, and Kibet (2016) assessed the effect of the capital structure on Kenya's share price performance of listed commercial banks. The data were analyzed using descriptive statistics, variance analysis, and correlation. The results showed a relationship exists between equity, bond, debt, retained earnings, and share price performance. Retained earnings improve firm liquidity and it is cheaper compared to other sources of finance. Bonds and debts are also important in signaling firm performance as payment of it would portray the ability to pay for the firm (Chemutai, Ayuma&Kibet, 2016). The study recommended that commercial debt should be cheaper so as to lower the cost of operation for a firm.
Kajirwa (2015) studied the effect of debt on firm performance and used 11 commercial banks that were listed in NSE and longitudinal research design to collect data. Correlation and regression model was adopted in the analysis. Analyzed data revealed that debt affects the return on assets negatively but not statistically significant. The researcher recommended that firms should diversify their ways of sourcing for funds that are cheaper and central banks to lower the interest rates on loans offered to commercial banks.
Siro (2013) conducted a study on the impact of capital structure on the financial performance of companies listed on the NSE. The debt ratio was used as a measure of the capital structure while the return on equity was used as a measure of the financial outcome. That research was carried out during the electioneering period, which is characterized by political tension. Secondary data was used. Regression analysis results revealed that interest in long term debts was found to exceed the returns of the investment. It facilitated the increase in firms' risk and lowered their performance. The researcher recommended that listed firms need to finance their firms using equity rather than long term debt.
Soumadi and Hayajneh (n.d.) studied the relationship between capital structure and corporate performance of publicly listed firms in Jordan. The research used multiple minimal square regression models (OLS) and attempted to establish a correlation between corporate capital structure and corporate performance over a period of five years. The results showed that the capital structure was negatively and statistically correlated with the firm's output in the study. Another finding from the analysis was that there was no significant difference in how they operate between highly leveraged financial firms and low financial leveraged firms in the effect of financial leverage. The research also came to the conclusion that the relationship between a company's capital structure and success in both high growth firms and low growth firms was negative.
The literature reviewed reveals that a relationship exists between various forms of financing structures and performance. These findings justify this study's hypotheses by indicating that this association exists in different contexts. The goal of this study is to explore this relationship in the Kenyan context, through analysis of publicly listed firms.
2.4 Conceptual Framework
The conceptual framework indicates the relationships between the variables in this study.
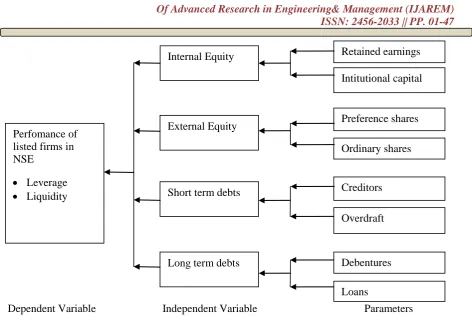
Independent variables Dependent variable
Figure2.1:Conceptual Framework
The explanatory constructs represents capital structure compositions that are internal and external equity, short-term and long-term debts. The choice of each or a combination of these elements affects a firm’s financial performance (Mamba & Job, 2013).
2.4.1 Equity
Equity funding reflects a company's ownership interest and is also the debt-free part of resources (Moyer et al., 1999). It is the sum paid by the proprietors and can be in the form of ordinary share capital and preferential capital. Those who provide equity are entitled to returns that are mindful of dividends from income earned by the company (Titman et al., 2011). Preference shareholders are the first to receive their dividends at a
Internal Financing
Equity Financing
Short term debts
Long term debts
rate agreed before ordinary shareholders, and any unfair advantage to the growth programs of the company is retained (Titman et al., 2011).
2.4.2 Short-term debt
Short term debt, referred to as current liabilities in the financial position statement, are obligations payable within a year like overdraft facilities and are good indicators of liquidity and performance of a firm when compared with current assets. When the current liabilities outweigh current assets, the firm has a poor liquidity performance. Increasing short-term debt is seen as a source of business capital (Ryan, 2004). Short-term debt in an atmosphere of unfinished contracts gives the lender a right of control, as the willingness of the company to roll over the debt can be dependent on financial ratios and satisfactory results. Since this process restricts managerial flexibility, it may help to ease financial constraints (Rajan and Winton, 1995). This increased availability of external finance will improve productivity.
2.4.3 Long-term debt
Long term debt refers to obligations which are payable beyond one year like bonds and mortgages. Such long term loans are used to measure the gearing extent of a firm. Investments that usually have a longer payback period are financed by long term debts. They carry the benefit of having low short term shocks exposure and are usually secured by formal agreements thus more stable than short term debts. It is famous for financing capital expenditures (Lancett, 2008). However, it is usually necessary to carry out cost-benefit analysis at all times to determine the ratio of each component that forms part of the long term debt structure (Ikapel&Kajirwa, 2017). Affordability of long term debt assists a firm to access productive technologies which are not easy through short term debt due to liquidation worries and thus may interfere with a firm's financial performance (Jaramillo &Schiantarelli, 2002).
2.4.4 Performance
To clearly understand how performance is affected by capital structure, research has been carried out previously but it seems to be rambling. For example, Nwude, Itiri, Agbadua, and Udeh (2016) looked at how debt structure affects the performance of listed companies in Nigeria. They concluded that there is a significant negative relationship between a firm's success and its debt structure. Kajirwa (2015) also conducted an analogous study but on listed firms in NSE and concluded that debt affects return on assets negatively but not statistically significant. Samuel (2016) conducted a study into the effect of capital structure on commercial banks' financial performance. Findings revealed that preferential shares, debt, and retained earnings are related positively to financial performance while ordinary shares are related negatively. The study carried out by Muchiri, Muturi, and Ngumi (2016) was in disjoint as current liabilities, non-current liabilities, internal equity, and external equity had an insignificant negative relationship with financial performance.
2.5 Operational Framework
Dependent Variable
Independent Variable
Parameters
Figure 1.2: Operational Framework
Research Methodology
3.1 IntroductionThis chapter presents the design that was used, target population, sampling procedure, data collection instruments and procedures, and how data was analyzed.
3.2 Research Design
This research applied causal research design. The study focused on both descriptive and statistical analysis of the relationship between capital structure and performance of firms listed in the Nairobi Security Exchange between 2009 and 2016. According to Kabir (2016), causal research design allows researchers to analyze a specific problem or a situation to explain the patterns and extent of the relationship between variables. The design helps in testing cause and effect to understand and explaining the connections between various variables (Zikmund, Babin, Carr & Griffin, 2012).
Research design is a structured sequence of the whole process involved in carrying out Miller's research study. This research covered all NSE listed non-financial companies from the years 2009 to 2016. Various reforms undertaken at the NSE told the option for this time. These include a spike in initial public offerings (IPOs), additional offers (AOs), proper issues, incentive issues, and stock splits, all of which have a significant impact on stock returns. In addition, cross-listing, demutualization, dematerialization, and global financial crisis occurred during this time which is likely to influence the volatility of returns. Therefore, an empirical review was worthwhile and timely, with the upward rise of the NSE index and bullish conduct dominating the market by the end of 2013. This research involved both descriptive and inferential. The descriptive analysis involved the use of frequencies and tables while in inferential statistics multiple linear regression was used.
Examination of the records was also used to link incidents that occurred in the past to current events. This made it possible for the researcher to link the research issue to the missed holes of other research work covered and also to demonstrate what the other researchers might have ignored due to time constraints or economic and social factors (Kombo& Tromp, 2006).
Perfomance of
listed firms in
NSE
Leverage
Liquidity
Internal Equity
Creditors
External Equity
Short term debts
Long term debts
Overdraft
Debentures
Loans
Retained earnings
Preference shares
3.3 Target Population
The study targeted all the listed companies that traded at the NSE, for the period 2009-2016. There were 51 listed companies that were in operation over the eight years period of interest to this study. The selection of listed firms was due to their ability to raise a large amount of capital and they are accountable to the majority of stakeholders by providing mandatory and voluntary information. It refers to a set of elements that the researcher wants to make a conclusion using the sample statistics. The group possesses the information and view relevant to the survey content (Edwards, Thomas, Rosenfeld, & Booth-Kewley, 1997). Sekaran and Bougie (2011) describe the population as the whole group of people, incidents, or interesting things that the researcher would like to examine.
Table 3.1: List of target population
Target Population
Company Number of Respondents Percentage (%)
Eaagads Ltd 1 1.96%
KakuziPlc 1 1.96%
Kapchorua Tea Co. Ltd 1 1.96%
The Limuru Tea Co. Ltd 1 1.96%
Sasini Ltd 1 1.96%
Williamson Tea Kenya Ltd 1 1.96%
Car & General (K) Ltd 1 1.96%
Barclays Bank of Kenya Ltd 1 1.96%
Diamond Trust Bank Kenya Ltd 1 1.96%
Equity Group Holdings Ltd 1 1.96%
HF Group Ltd 1 1.96%
KCB Group Ltd 1 1.96%
National Bank of Kenya Ltd 1 1.96%
NIC Bank Ltd 1 1.96%
Stanbic Holdings Plc 1 1.96%
Standard Chartered Bank Kenya Ltd 1 1.96%
The Co-operative Bank of Kenya Ltd 1 1.96%
Eveready East Africa Ltd 1 1.96%
Express Kenya Ltd 1 1.96%
Kenya Airways Ltd 1 1.96%
Longhorn Publishers Ltd 1 1.96%
Nation Media Group Ltd 1 1.96%
Sameer Africa Ltd 1 1.96%
Standard Group Ltd 1 1.96%
TPS Eastern Africa Ltd 1 1.96%
Uchumi Supermarket Ltd 1 1.96%
WPP Scangroup Ltd 1 1.96%
ARM Cement Plc 1 1.96%
Bamburi Cement Ltd 1 1.96%
Crown Paints Kenya Ltd 1 1.96%
E.A.Cables Ltd 1 1.96%
E.A.Portland Cement Co. Ltd 1 1.96%
KenGen Co. Ltd 1 1.96%
KenolKobil Ltd 1 1.96%
Kenya Power & Lighting Co Ltd 1 1.96%
Total Kenya Ltd 1 1.96%
Jubilee Holdings Ltd 1 1.96%
Kenya Re Insurance Corporation Ltd 1 1.96%
Sanlam Kenya Plc 1 1.96%
Centum Investment Co Plc 1 1.96%
Olympia Capital Holdings Ltd 1 1.96%
Nairobi Securities Exchange Plc 1 1.96%
B.O.C Kenya Ltd 1 1.96%
British American Tobacco Kenya Ltd 1 1.96%
Carbacid Investments Plc 1 1.96%
East African Breweries Ltd 1 1.96%
Kenya Orchards Ltd 1 1.96%
Mumias Sugar Co. Ltd 1 1.96%
Unga Group Ltd 1 1.96%
Safaricom Ltd 1 1.96%
Total 51 100 (%) Source: Author, (2017)
3.4 Sampling Design
The study did not rely on any sampling technique since respondents were drawn from the entire population. Consequently, a census was conducted across the 51 listed firms, whereby the respondents were the 51 finance managers of the listed companies.
3.5 Data Collection Instruments
The study utilized both primary and secondary sources of data. Data was collected using questionnaires that were administered to the respondents by the researcher. Data was collected using closed ended questions, which gave the respondents limited, and pre-determined response options to choose from. For this analysis, a questionnaire was adequate as questionnaires are widely used to gather essential population information (Orodho, 2004), and each parameter in the questionnaire was designed to answer a specific objective (Mugenda&Mugenda, 2003).
The questionnaires were administered through email because it was not feasible to meet with all the financial managers from the 51 listed firms (2009-2016). The researcher retrieved the respondents' contacts through referrals as well as from company websites and professional profiles provided in such platforms as LinkedIn.
Secondary sources mainly entailed industry reports and the annual financial reports from the individual firms. The reports were obtained from the NSE portal as well as the individual firm's websites. Data from these sources were compared against that returned from questionnaires in order to derive the appropriate conclusions and recommendations regarding the relationship between capital structure and performance.
3.6 Reliability
To check the accuracy of the research tools with a view to correcting them, a reliability test was carried out. The thesis used the internal consistency method to test for reliability by using the Cronbach Coefficient Alpha test to check the research tools. This was deemed appropriate on a scale of 0 to 1, 0.7, and above. Internal consistency of the data was calculated by correlating the scores obtained at one time with scores obtained in the research instrument from other times.
3.7 Validity
Using the material validity test, the validity of the instrument which is the accuracy and meaningfulness of inferences was measured. The degree to which data obtained using a particular instrument reflects a specific scope of measures or content of a particular concept is assessed by information validity.
3.7 Data Analysis and Presentation
financing, short term debts, and long term debt) and the dependent variable (performance). This assisted in indicating the strength and direction of the relationship between the variables.
The multiple linear regression model for the study is expressed as follows: Where Y = β0 + β1ef + β2std + β3ltd
Where:
Y is performance β0is the constant
β1, β2, β3, are the regression coefficient the contribution of each independent variables ( equity financing, short
term debt, long term debt) to performance. ef is equity financing
std is short term debt ltd is long term debt
Trend analysis was used to analyze secondary data. The researcher analyzed the trends of performance of the listed company to understand and explain how firm performance was influenced by the capital structure. Zikmund et al. (2012) suggested that it is imperative to evaluate the trends of causality between variables to understand the extent to which the independent variable affects the dependent variable.
3.8 Ethical Considerations
Before data collection commenced, the researcher obtained authority from the School of Business of Kenya Methodist University. By use of this letter, the researcher acquired a permit from NACOSTI to conduct the research. The research kept data collected from the respondents confidential and safe. All data collected in this connection is kept in safe custody. To prevent revealing who gave what details the identification was, respondents were asked not to write their names on the questionnaire.
Results and Discussions
4.1 IntroductionThis chapter presents the data analysis results and explains the procedure and review and profile of the quoted firms for data collection. For the study of the connection between capital structure and performance of quoted firms in Kenya, descriptive statistics and multiple regression analysis used.
4.2 Data Collection Process and Analysis
The analysis utilized primary as well as secondary data. Primary data was collected using a questionnaire administered to the financial officers in the listed firms while secondary data were collected from NSE handbooks and the quoted companies released financial statements. Nonetheless, this study focused on the 51 listed companies that were active for this study's eight-year duration (2009 to 2016). The research results from the collected data were analyzed using SPSS, arranged, and presented in tables.
4.3 Response Rate
A total of 51 questionnaires were distributed to the financial officers of the quoted companies. Only 34 questionnaires were successfully completed; hence a 66.7% response rate was realized. Mugenda (2003) observed that a response rate of 50% is adequate for analysis and reporting. The impressive return rate could be attributed to the fact that the primary data was collected via email. Besides, the respondents were assured that the study was purely for academic purpose and the researcher had sought approval from the relevant authorities.
4.4 Reliability Test Results
The Cronbach's Alpha coefficient for the eight questions on the independent variables was found to be 0.895; hence the internal consistency of the items under the study was good since it was within the acceptable range of 0.7 to 0.9 as recommended by Siegle (2011).
4.5 Profile of the Respondents
4.6 Distribution of Respondents by Education Level
It was established that 58.8% of the respondents had master’s degree qualification, 35.3% had a first degree while 5.9% had a CPA (K) qualification. This result signifies that most of the respondents had at least a first-degree qualification since only less than a twentieth indicated not having a first-degree qualification. Hence, the financial officers working with the listed firms were well educated.
Table 4-1: Distribution of respondents by education level
Frequency Percent
First Degree 12 35.3
Master’s Degree 20 58.8
CPA (K) 2 5.9
Total 34 100.0
4.6.1 Distribution of Respondents by Position Held
It was revealed that 64.7% of the respondents were in top management while 35.3% were in middle level management. This was good for the study since the caliber of respondents interviewed were likely to give credible information relating to the research variables.
Table 4-2: Position held by the respondent
Frequency Percent
Middle level management 12 35.3
Top level management 22 64.7
Total 34 100.0
4.6.2 Distribution of Firms by Duration of operation in Kenya
Slightly above a third (35.3%) of the firms included in the study had operated in Kenya for 41 to 60 years, 26.5% for more than 80 years, 14.7% for 61 to 80 years, same as 21 to 40 years while 8.8% had operated in Kenya for up to 20 years. The findings imply that most of the organizations included in the study had operated in Kenya for more than 20 years since only around a tenth indicated duration of up to 20 years.
Table 4-3: Duration the company has operated in Kenya
Frequency Percent
Up to 20 years 3 8.8
21 to 40 years 5 14.7
41 to 60 years 12 35.3
61 to 80 years 5 14.7
Above 80 years 9 26.5
Total 34 100.0
4.7 Descriptive Analysis of Study Variables
The study wanted to determine the effect of equity financing, short term, and long term debts on performance. The following section provides descriptive findings based on the research constructs.
4.7.1 Internal Financing
internal financing means for the trading firms, distribution of NSE listed companies by internal financing category, and industry versus internal financing cross-tabulation.
4.7.2 Distribution of Firms by Percentage of Balance Sheet Financed Internally
The study established that majority of the firms (41.2%) had up to 20% of their balance sheet financed internally, 29.4% had more than 50% of their balance sheet financed internally, 11.8% had 31 to 40% of their balance sheet financed internally same as those with 21 to 30% while 5.9% had 41 to 50% of their balance sheet financed internally. The outcome signifies that the majority of the trading companies had less than half of their balance sheet financed internally since close to three-quarters of the respondents indicated so.
Table 4-4: Percentage of balance sheet financed internally
Frequency Percent
Up to 20% 14 41.2
21 to 30% 4 11.8
31 to 40% 4 11.8
41 to 50% 2 5.9
Above 50% 10 29.4
Total 34 100.0
4.7.3 Respondents opinion on Influence of Internal Financing on Performance
Close to two thirds of the respondents (64.7%) opined that to a large extent, internal financing influenced performance, 20.6% indicated moderate extent influence while 14.7% specified that to a very large extent internal financing influenced the performance of a firm. Hence, in the opinion of the respondents, internal financing significantly influenced the performance of a firm since around four fifths of the respondents upheld this opinion.
Table 4-5: Respondents opinion on influence of Internal financing on financial performance
7 20.6
22 64.7
5 14.7
Total 34 100.0
4.7.4 Internal Financing Trend analysis for Quoted Companies (2009 to 2016)
The research revealed that the mean internal financing of the quoted companies had consistently increased from 5.346 billion shillings in the year 2009 to 14.7 billion shillings in the year 2016. Hence, the mean retained earnings and reserves for the trading firms had steadily increased from the year 2009 to 2016 as shown in figure 4.1.
Figure 4-1: Internal Financing Trend analysis for listed firms in Kenya (2009 to 2016)
YR
2009
YR
2010
YR
2011
YR
2012
YR
2013
YR
2014
YR
2015
YR
2016
Series1
5,34
6,54
7,16
9,26
10,4
11,9
13,1
14,7
4.7.5 Internal Financing Means for the Trading Firms: 2016
It was further reported that the telecommunications and technology industry registered the highest amount of internal funding for 2016 with an average of 82.05 billion, closely followed by the insurance industry with an average of 70.369 billion shillings (SD= 110.367). With 1,386 (SD= 1,212), 1,226 (SD= 1,441) and 0,986 (SD= 1,114) billion shillings respectively, manufacturing and allied, automotive and accessories, and investment industries reported the lowest internal funding numbers. That is shown in table 4.6.
Table 4-6: Internal Financing Means for the Trading Firms: 2016
Industry N Mean (Kshs '000,000') Std. Deviation Std. Error
Telecommunication and Technology 1 82,052.20 . .
Insurance 4 70,369.46 110,367.64 55,183.82
Energy and Petroleum 4 25,980.93 23,355.41 11,677.71
Banking 7 18,253.02 22,075.84 6,656.12
Construction and Allied Sector 2 4,718.01 7,477.65 3,344.11
Agricultural Sector 2 4,452.45 5,068.14 2,069.06
Commercial and Services 8 1,980.52 3,108.38 1,098.98
Manufacturing and Allied 3 1,386.76 1,212.07 458.12
Automobiles and Accessories 1 1,226.23 1,441.97 832.52
Investment 2 986.81 1,114.17 787.84
Total 34 14,700.89 36,235.73 5,074.02
4.7.6 Distribution of NSE Listed Companies by Internal Financing Category: 2016
Majority of the companies (31.4%) posted internal financing of 3 to 20 billion shillings, 19.6% registered internal financing of 1 to 3 billion shillings category, and 17.6% recorded internal financing of below 100 million shillings while 15.7% indicated internal financing of above 20 billion shillings same as 100 million to 1 billion shillings as illustrated in figure 4.2.
Figure 4-2: Distribution of Listed firms in Kenya by Internal Financing Category: Year 2016
4.7.7 Industry and Internal Financing Cross tabulation
A cross tabulation was done to establish the relationship between industry and internal financing. The result indicates that the distribution of the firms by internal financing was different between the industries. For instance, insurance, energy, and telecommunication and technology sectors had all their companies registering internal financing amounts of more than 3 billion shillings while automobiles, investment, and accessories, segments had none of their companies registering internal financing of more than 3 billion shillings.
Table 4-7: Industry and Internal Financing Cross tabulation
Internal Financing category: 2016
Total
<100M 100M -1B 1-3B 3-20B >20B
Agricultural Sector F 0 0 1 1 0 2
% .0% .0% 50.0% 50.0% .0% 100.0%
Less than Ksh100 Million
1000000001 to Ksh3 Billion
Above Ksh20 Billion
17.6%
15.7%
19.6%
Automobiles and Accessories F 0 0 1 0 0 1
% .0% .0% 100.0% .0% .0% 100.0%
Banking F 2 0 0 2 3 7
% 28.6% .0% .0% 28.6% 42.9% 100.0%
Commercial and Services F 3 2 1 2 0 8
% 37.5% 25.0% 12.5% 25.0% .0% 100.0%
Construction and Allied Sector F 1 0 0 1 0 2
% 50.0% .0% .0% 50.0% .0% 100.0%
Energy and Petroleum F 0 0 0 2 2 4
% .0% .0% .0% 50.0% 50.0% 100.0%
Insurance F 0 0 0 2 2 4
% .0% .0% .0% 50.0% 50.0% 100.0%
Investment F 0 1 1 0 0 2
% .0% 50.0% 50.0% .0% .0% 100.0%
Manufacturing and Allied F 0 1 1 1 0 3
% .0% 33.3% 33.3% 33.3% .0% 100.0%
Telecommunication and Technology
F 0 0 0 0 1 1
% .0% .0% .0% .0% 100.0% 100.0%
Total
F 6 4 5 11 8 34
% 17.6% 11.8% 14.7% 32.4% 23.5% 100.0%
4.8 Equity Financing of Trading Firms
A descriptive analysis of equity financing of quoted companies is presented. This analysis comprise; distribution of firms by the percentage of balance sheet financed by equity, respondents opinion on the influence of equity financing on performance, equity financing trend analysis for listed firms in Kenya (2009 to 2016), equity financing means for the trading firms, distribution of NSE listed companies by equity financing category, and industry versus equity financing cross-tabulation.
4.8.1 Distribution of Firms by Percentage of Balance Sheet Financed by Equity
In regard to the percentage of the balance sheet financed by equity, nearly half of the respondents (44.1%) indicated up to 2%, 23.5% specified 2.1 to 5%, 14.7% indicated 5.1 to 10%, and 11.8% cited more than 20% while 5.9% stated that 10.1 to 20% of their balance sheet had been financed by equity. Hence, in the opinion of the respondents, most of the firms had up to 10% of their balance sheet financed by equity since more than four fifths of the respondents indicated up to 10% equity financing of the balance sheet.
Table 4-8: Percentage of balance sheet financed by Equity
Frequency Percent
Up to 2% 15 44.1
2.1 to 5% 8 23.5
5.1 to 10% 5 14.7
10.1 to 20% 2 5.9
Above 20% 4 11.8
4.8.2 Respondents opinion on Influence of Equity Financing on Performance
Half of the respondents (50%) indicated moderate extent influence, 41.2% specified large extent influence while 9.8% opined that to a very large extent, equity funding meaningfully determines the success of trading firms in Kenya. Hence, in the respondent’s opinion, financing through equity had a meaningful effect on the performance of the quoted companies since more than half indicated either a large extent or very large extent influence.
Table 4-9: Respondents opinion on influence of equity financing on performance
Frequency Percent
Moderate extent 17 50.0
Large extent 14 41.2
Very large extent 3 9.8
Total 34 100.0
4.8.3 Equity Financing Trend analysis for listed firms in Kenya (2009 to 2016)
In regard to equity financing trend analysis of companies listed at the NSE, three movements can be observed from the financial statements. For the year 2009 to 2011, the mean equity financing did not change significantly; from 1.195 billion shillings in 2009 to 1.254 in 2010, then to 1.237 billion shillings in 2011. From the year 2011 to 2013, a constant improvement was registered in the mean equity financing of the quoted firms; from 1.237 billion shillings in 2011 to 2.448 billion shillings in 2013. However, from the year 2013 to 2016, there was a remarkable decline in the mean equity financing from 2.448 billion shillings at 2013 to 1.537 billion shillings at 2016. This result reveal that the mean equity financing of the trading firms was fluctuating within the eight years period of examination as illustrated in figure 4.3.
Figure 4-3: Equity Financing Trend analysis for listed firms in Kenya (2009 to 2016)
4.8.4 Equity Financing Means for the Quoted Firms: 2016
Analysis of the NSE revealed that Energy and petroleum sector posted the highest equity financing mean of 5.105 billion shillings (SD = 2.025), banking industry registered a mean of 2.445 billion shillings (SD = 2.104) while telecommunication and technology enumerated a mean of 2.003 billion shillings. Automobiles and accessories, investment, and agricultural sector posted the least equity financing means of 554.73 (SD = 727.69), 170.07 (SD = 42.33), and 86.16 (SD = 30.80) million shillings respectively.
Table 4-10: Equity Financing Means for the Quoted Firm: 2016
Industry
N Mean (Kshs '000,000') Std. Deviation Std. Error
Energy and Petroleum 4 5,105.73 4,051.08 2,025.54
YR
2009
YR
2010
YR
2011
YR
2012
YR
2013
YR
2014
YR
2015
YR
2016
Series1
1,19
1,25
1,23
1,40
2,44
1,61
1,64
1,53
-500.00
1,000.00
1,500.00
2,000.00
2,500.00
3,000.00
Mea
n Equit
y
:
Ksh
Banking 7 2,456.63 2,104.64 634.57
1 2,003.27 . .
Commercial and Services 8 1,399.67 2,515.92 889.51
4 1,353.72 1,032.80 516.40
3 940.37 1,075.23 406.40
2 648.55 667.39 298.47
Automobiles and Accessories 1 554.73 727.69 420.13
Investment 2 170.07 42.33 29.93
Agricultural Sector 2 86.16 75.45 30.80
Total 34 1,537.41 2,178.51 305.05
4.4.2.5 Distribution of NSE Listed Companies by Equity Financing Category: 2016
Close to a quarter of the firms (23.5%) posted a mean equity financing of 300 million to 1 billion shillings, 21.6% registered more than 3 billion shillings same as 1 to 3 billion shillings, 17.6% had a mean equity financing of less than 100 million while 15.7% indicated a mean equity financing of 100 million to 300 million shillings as illustrated in figure 4.4.
Figure 4-4:Distribution of Listed firms in Kenya by Equity Financing Category: Year 2016
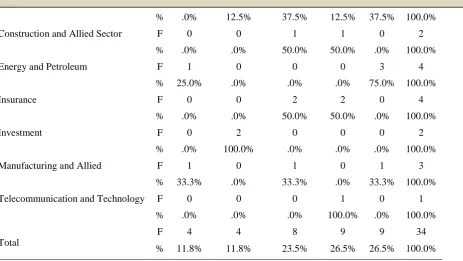
4.8.5 Industry and Equity Financing Cross tabulation
A cross tabulation was done to establish the relationship between industry and equity financing. The result indicates that the distribution of the firms by equity financing was different between the industries. For instance; insurance, and telecommunication and technology sectors had all their companies registering equity financing amounts of more than 300 million shillings while agriculture and investment sectors had none of their companies registering equity financing of more than 300 million shillings.
Table 4-11:Industry and Equity Financing Cross tabulation
Equity Financing category: 2016
Total
Industry <100M 100 - 300M 300M - 1B 1-3B >3B
Agricultural Sector F 1 1 0 0 0 2
% 50.0% 50.0% .0% .0% .0% 100.0%
Automobiles and Accessories F 0 0 0 1 0 1
% .0% .0% .0% 100.0% .0% 100.0%
Banking F 1 0 1 3 2 7
% 14.3% .0% 14.3 42.9% 28.6% 100.0%
Commercial and Services F 0 1 3 1 3 8
Less than Ksh100 Million
1000000 to Ksh300Million
300000001 to Ksh1 Billion
1000000001 to Ksh3 Billion
Above Ksh3 Billion
17.6%
15.7%
% .0% 12.5% 37.5% 12.5% 37.5% 100.0%
Construction and Allied Sector F 0 0 1 1 0 2
% .0% .0% 50.0% 50.0% .0% 100.0%
Energy and Petroleum F 1 0 0 0 3 4
% 25.0% .0% .0% .0% 75.0% 100.0%
Insurance F 0 0 2 2 0 4
% .0% .0% 50.0% 50.0% .0% 100.0%
Investment F 0 2 0 0 0 2
% .0% 100.0% .0% .0% .0% 100.0%
Manufacturing and Allied F 1 0 1 0 1 3
% 33.3% .0% 33.3% .0% 33.3% 100.0%
Telecommunication and Technology F 0 0 0 1 0 1
% .0% .0% .0% 100.0% .0% 100.0%
Total
F 4 4 8 9 9 34
% 11.8% 11.8% 23.5% 26.5% 26.5% 100.0%
4.9 Short term debt Financing of Companies Listed at the NSE
A concise review of the financing of listed companies at the NSE through short-term debt is presented. This analysis includes: distribution of firms by the percentage of the balance sheet financed by short-term debt, opinion of respondents on the influence of short-term debt financing on performance, short-term trend analysis of debt financing for quoted companies in Kenya (2009 to 2016), short-term debt financing for companies listed in the NSE, distribution of NSE listed firms by short-term debt financing
4.9.1 Distribution of Firms by Percentage of Balance Sheet Financed by Short Term Debt
Majority of the respondents (32.4%) indicated that more than 70% of their balance sheet were financed by short term debt, same as those who specified 30.1 to 50%, and 14.7% indicated 10.1 to 30% while 11.8% specified 50.1 to 70% and 14.7 specified 10.1 to 30%. This result signifies that most of the firms had more than 30% of their balance sheet financed by short term debt since more than two thirds of the respondents indicated short term debt financing of more than 30% of the balance sheet.
Table 4-12: Percentage of balance sheet financed by Short Term Debt
Frequency Percent
Up to 10% 3 8.8
10.1 to 30% 5 14.7
30.1 to 50% 11 32.4
50.1 to 70% 4 11.8
Above 70% 11 32.4
Total 34 100.0
4.9.2 Respondents opinion on the Influence of Short Term Debt Financing on Performance
substantial impact on firms’ performance since more than half indicated either large extent or very large extent influence.
Table 4-13: Respondents opinion on influence of short term debt on performance
Frequency Percent
11 32.4
6 17.6
14 41.2
3 8.8
Total 34 100.0
4.9.3 Short Term Debt Financing Trend analysis for listed firms in Kenya (2009 to 2016)
It was established that there was a consistent increase in the mean short term debt for the NSE listed companies from the year 2009 to the year 2015; from 19.344 billion shillings in 2009 to 56.891 billion shillings in 2015. However, there was a slight decline in the mean short term debt; from 56.891 billion shillings at 2015 to 56.297 billion shillings at 2016. This result signifies that, other than for the last year under examination, the mean short term debt financing for companies listed at the NSE had a consistent upward trend as illustrated in figure 4.5.
Figure 4-5:Short Term Debt Financing Trend analysis for losted firms in Kenya (2009 to 2016)
4.9.4 Short Term Debt Financing Means for the Companies listed at the NSE: 2016
The banking industry registered the highest short term financing debt mean of 189.618 billion shillings (SD = 149.988) while energy and petroleum sector and telecommunication industry followed with 76.235 (SD = 100.119) and 42.443 billion shillings in that order. The construction and allied sector, automobile, and accessories industry, and agricultural sector registered the least short term debt financing means of 6.020 (SD = 4.607), 2.449 (SD = 2.882), and .399 (SD = .306) billion shillings respectively. This result is shown in table 4-14.
Table 4-14: Short term debt financing means for the quoted firms 2016
N Mean (Kshs '000,000') Std. Deviation Std. Error Industry
Banking 7 189,618.71 149,988.61 45,223.27
Energy and Petroleum 4 76,235.65 100,449.80 50,224.90
Telecommunication and Technology 1 42,443.54 . .
Insurance 4 31,866.62 25,196.00 12,598.00
Commercial and Services 8 25,941.42 43,528.40 15,389.61
Investment 2 7,054.54 9,589.12 6,780.53
3 7,002.53 10,030.21 3,791.06
YR
2009
YR
2010
YR
2011
YR
2012
YR
2013
YR
2014
YR
2015
YR
2016
Series1
19,3
23,6
29,3
33,5
38,3
45,8
56,8
56,2
-20,000.00
40,000.00
60,000.00
Mea
n Curr
ent
L
iabili
ti
es: Kshs
2 6,020.78 4,607.56 2,060.56
Automobiles & Accessories 1 2,449.87 2,822.34 1,629.48
Agricultural 2 399.10 306.22 125.01
Total 34 56,297.35 103,942.98 14,554.93
4.9.5 Distribution of NSE Listed Companies by Short Term Debt Financing: 2016
Slightly above a quarter of the firms (25.5%) registered a mean short term debt financing of fewer than 1 billion shillings, 19.6% posted means of above 100 billion shillings, same as 5 to 20 billion and 1 to 5 billion shillings as well, while 15.7% indicated short term debt financing of 20 to 100 billion shillings as illustrated in figure 4.6.
Figure4-6:Distribution of Listed firms in Kenya by Short Term Debt Financing: Year 2016
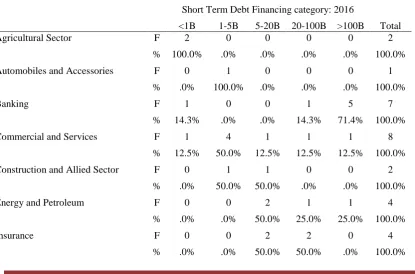
4.9.6Industry and Short term debt Financing Cross tabulation
To determine the relationship between industry and short-term debt financing, a cross tabulation was made. The result suggests that the distribution between the sectors of companies funded by short-term debt has been different. For example; insurance, telecommunications and technology, and the energy and petroleum sectors had all of their companies registering short-term debt financing amounts of more than 5 billion shillings, while the agricultural sector had all of its companies registering short-term debt financing of less than 1 billion shillings as illustrated in table 4.15.
Table 4-15 Industry and Short term debt Financing Cross tabulation
Short Term Debt Financing category: 2016
Total
<1B 1-5B 5-20B 20-100B >100B
Agricultural Sector F 2 0 0 0 0 2
% 100.0% .0% .0% .0% .0% 100.0%
Automobiles and Accessories F 0 1 0 0 0 1
% .0% 100.0% .0% .0% .0% 100.0%
Banking F 1 0 0 1 5 7
% 14.3% .0% .0% 14.3% 71.4% 100.0%
Commercial and Services F 1 4 1 1 1 8
% 12.5% 50.0% 12.5% 12.5% 12.5% 100.0%
Construction and Allied Sector F 0 1 1 0 0 2
% .0% 50.0% 50.0% .0% .0% 100.0%
Energy and Petroleum F 0 0 2 1 1 4
% .0% .0% 50.0% 25.0% 25.0% 100.0%
Insurance F 0 0 2 2 0 4
% .0% .0% 50.0% 50.0% .0% 100.0%
Less than Ksh1 Billion
1000000001 to Ksh5 Billion
5000000001 to Ksh20 Billion
20000000001 to Ksh100 Billion
Above Ksh100 Billion
25.5
19.6
19.6
15.7
Investment F 1 0 1 0 0 2
% 50.0% .0% 50.0% .0% .0% 100.0%
Manufacturing and Allied F 1 0 1 1 0 3
% 33.3% .0% 33.3% 33.3% .0% 100.0%
Telecommunication and Technology F 0 0 0 1 0 1
% .0% .0% .0% 100.0% .0% 100.0%
Total
F 6 6 8 7 7 34
% 17.6% 17.6% 23.5% 20.6% 20.6% 100.0%
4.10 Long term debt Financing of Trading Firms
A descriptive analysis is provided by companies funded by long-term debt. The research includes: distribution of companies by percentage of the balance sheet financed by long-term debt, opinion of respondents on the impact of financing through long-term debt on results, long-term trend analysis of debt financing for listed companies in Kenya (2009 to 2016), long-term debt financing means for listed companies in the NSE, distribution of NSE listed companies through long-term debt financing.
4.10.1 Distribution of Firms by Percentage of Balance Sheet Financed by Long Term Debt
Close to two fifths of the respondents (38.2%) indicated that up to 1% of their balance sheet were financed by non-current liabilities, 23.5% specified 1.1 to 10%, 14.7% indicated 10.1 to 20%, and 11.8% specified 20.1 to 30% and same indicated that more than 30% of their balance sheet was financed by current liabilities. Hence, the majority of the firms had up to 10% of their balance sheets financed by non-current liabilities since nearly two thirds of the respondents indicated up to 10% financing by non-non-current liabilities.
Table 4-16:Percentage of balance sheet financed by Non-Current Liabilities
Frequency Percent
Up to 1% 13 38.2
1.1 to 10% 8 23.5
10.1 to 20% 5 14.7
20.1 to 30% 4 11.8
Above 30% 4 9.8
Total 34 100.0
4.10.2 Respondents opinion on Influence of Long Term Debt Financing on Performance
Slightly above two fifths of the respondents (41.2%) indicated that to a very large extent non-current liabilities financing influenced firms' outcomes in Kenya, same as those who specified large extent influence while 17.6% opined that non-current liabilities financing influenced the performance of the firms to a moderate extent. This result signifies that, in the opinion of the respondents, non-current liabilities financing had a meaningful effect on the performance of the trading organizations in Kenya since more than four fifths of the respondents indicated a very large extent or large extent influence.
Table 4-17:Respondents opinion on influence of non-current liabilities financing on performance
Frequency Percent
Moderate extent 6 17.6
Large extent 14 41.2
Very large extent 14 41.2
4.10.3 Long Term Debt Financing Trend analysis for listed firms in Kenya (2009 to 2016)
In regard to the long term debt financing trend of NSE listed companies, three movements can be observed. From 2009 to 2012, there is a gentle increase in non-current liabilities; from 3.367 billion shillings in 2009 to 4.753 billion shillings in 2012. From 2012 to 2014 the slope of the curve is steeper; from 4.753 billion shillings in 2012 to 7.554 billion shillings in 2014. Notably, from 2014 to 2016, the gradient of the curve increases signifying an increase from 7.554 billion shillings in 2014 to 15.587 billion shillings in 2016. This result is illustrated in figure 4.7.
Figure 4-7:Long Term Debt Financing Trend analysis for listed firms in Kenya (2009 to 2016)
4.10.4 Long Term Debt Financing Means for the Listed Companies at the NSE: 2016
Energy and Petroleum sector posted the highest long term debt financing mean of 90.334 (SD = 103.312) billion shillings then commercial and services with a mean of 46.124 (SD = 31.609) billion shillings. Remarkably, the banking sector, insurance industry, and telecommunication and technology did not have any of their companies posting a single shilling in long term debt financing for the year 2016. This result is illustrated in table 4.18.
Table 4-18: Long Term Debt Financing Means for Quoted Firms: 2016
N MeanKshs ‘000,000’ Std. Deviation Std. Error Industry
Energy and Petroleum 4 90,334.38 103,312.23 51,656.12
8 46,124.49 89,406.46 31,609.96
3 5,147.30 8,405.45 3,176.96
Construction and Allied 2 3,580.81 3,527.15 1,577.39
Investment 2 2,262.99 3,074.71 2,174.15
Agricultural Sector 2 882.76 905.62 369.72
Automobiles and Accessories 1 282.35 474.66 274.05
Banking 7 - - -
Insurance 4 - - -
Telecommunication and Technology 1 - . .
Total 34 15,587.02 50,199.10 7,029.28
4.10.5 Distribution of NSE Listed Companies by Long Term Debt Financing: 2016
The study revealed that slightly more than a third of the firms (35.3%) had no long term financing obligation, 23.5% had long term debts of 1 to 100 billion shillings, 21.6% registered a debt of 500 million to 1 billion, and 11.8% indicated a debt of up to 50 million shillings while 7.8% recorded a long term debt of more than 100 billion shillings as illustrated in figure 4.8.
YR
2009
YR
2010
YR
2011
YR
2012
YR
2013
YR
2014
YR
2015
YR
2016
Series1
3,36
4,05
4,49
4,75
6,05
7,55
10,0
15,5
-5,000.00
10,000.00
15,000.00
20,000.00
Mea
n Non Curr
ent
L
iabili
ti
es: Kshs
Figure 4-8:Distribution of Listed firms in Kenya by Long Term Debt Financing: Year 2016
4.10.6 Industry and Long term debt Financing Cross tabulation
A cross tabulation was done to establish the relationship between industry and long term debt funding. The result indicates that the distribution of the firms by long term debt financing was different between the industries. Investment, energy, and petroleum and construction and allied sector had all their companies registering long term debt financing amounts of more than 50 million shillings while the banking sector, insurance industry, and telecommunication and technology did not have any long term financing obligations.
Table 4-19:Industry and Long Term Debt Financing Cross tabulation
Long Term Debt Financing category: 2016
To