University of Trento
CIMeC – Centre for Mind/Brain Sciences
Doctoral School in Cognitive and Brain Sciences (XXXI Cycle)
Track Cognitive Neuroscience
FROM PERCEPTUAL TO SEMANTIC REPRESENTATIONS
IN THE HUMAN BRAIN
Simone Viganò
Supervisor: prof. Manuela Piazza
Submitted in partial fulfillment of the requirements for the degree of
Doctor of Philosophy in Cognitive and Brain Sciences
ABSTRACT
Humans are capable of recognizing a myriad of objects in everyday life. To do that, they have
evolved the ability to detect their commonalities and differences, moving from perceptual details to
construct more abstract representations that we call concepts, which span entire categories (such
as the one of people) or refer to very specific and individual entities (such as our parents).
Organizing our knowledge of the world around concepts, rather than around individual
experiences, allows us for more rapid access to behavioural relevant information (for instance, how
to behave when we encounter a dangerous animal), and to quickly generalize this information to
what we never encountered before. In few words, this is what permeates the world with meaning.
The present work is about the neural bases of learning novel object concepts, a process that in our
species is vastly supported by symbols and language: for this reason, I talk about semantic
representations. The word “semantics” generally refers to the study of meaning (and to what a
“meaning” ultimately is) as it is conveyed by a symbol; in the specific case of cognitive
neuroscience, it deals with the neural mechanisms that allow symbols to re-present the meanings
or concepts they refer to in the brain. For instance, we can easily describe what is the meaning of
the word “DOG”, pretty much as we can explain what “DEMOCRACY” means. However, although
cognitive neuroscience has focused on the neuro-cognitive bases of semantic representations for
decades, the neural mechanisms underlying their acquisition remain elusive. How does the human
brain change when learning novel concepts using symbols? How does a symbol acquire its
meaning in the brain? Does this learning generate novel neural representations and/or does it
modify pre-existing ones? What internal representational format (neural code) supports the
representation of newly learnt concepts in the human brain?
The contribution of this work is three-fold. First, I show how new semantic representations learned
using words, emerge from the orchestrated plasticity of both perceptual and memory systems.
Second, I show results converging on the idea that brain regions that evolved in lower-level
mammals to represent spatial relationships between objects and locations, such as the
hippocampal formation and medial prefrontal cortex, in humans are recruited to encode
relationships between words and concepts by means of the same neural codes used to represent
and navigate the physical environment. Finally, I present preliminary data on the cognitive effects
of using symbols during learning novel object concepts, showing how language supports the
ACKNOWLEDGMENTS
Thanks to Manuela, for being an advisor, a guide, a mentor.
Thanks to my friends, parents, and relatives.
The universe (which others call the Library) is composed of an indefinite and perhaps infinite
number of hexagonal galleries, with vast airshafts between, surrounded by very low railings. […]
Like all men of the Library, I have travelled in my youth; I have wandered in search of a book,
perhaps the catalogue of catalogues; now that my eyes can hardly decipher what I write, I am
preparing to die just a few leagues from the hexagon in which I was born.
TABLE OF CONTENTS
ABSTRACT ... II ACKNOWLEDGMENTS ... IV
GENERAL INTRODUCTION ... 1
SEMANTIC REPRESENTATIONS IN THE HUMAN BRAIN ... 3
SPATIAL CODES FOR SEMANTIC SPACES ... 9
INTRODUCTION TO THE EXPERIMENTAL WORK ... 16
NEURAL MECHANISMS UNDERLYING THE EMERGENCE OF SEMANTIC REPRESENTATIONS ... 21
INTRODUCTION ... 21
METHODS ... 23
RESULTS ... 31
DISCUSSION ... 38
SUPPLEMENTARY MATERIAL ... 46
NAVIGATING A NOVEL SEMANTIC SPACE WITH DISTANCE AND DIRECTIONAL CODES IN THE HUMAN BRAIN ... 48
INTRODUCTION ... 48
METHODS ... 52
RESULTS ... 56
DISCUSSION ... 61
OBJECT NAMING SUPPORTS THE EMERGENCE OF GENERALIZED SEMANTIC CATEGORICAL SPACES ... 67
INTRODUCTION ... 67
METHODS ... 69
RESULTS ... 72
DISCUSSION ... 73
GENERAL DISCUSSION ... 75
FINAL REMARKS ... 82
GENERAL
INTRODUCTION
A key step for making sense of the rich multisensory world surrounding us is to be able to
parse it into meaningful discrete and recognizable object categories, or “concepts”. To solve this
task, the human brain needs to extract from experience and combine all the defining details of a
concept, such as its sensory or contextual properties. This set of information we have about things
in the world is called “conceptual knowledge”, and it defines the bases for nearly every human
activity: it allows us, for instance, to remember what distinguishes dogs from wolves, how to use a
pen to write, or how to behave in a particular situation. A long-standing tradition in cognitive
neuroscience has referred to the neural representations of concepts in the human brain as
semantic representations, because of the central and undeniable role that language and symbols
(such as words or numbers) play in acquiring, organizing, and recalling conceptual knowledge
(semàntico derives from the late latin semantĭcus, and from the greek term σηµαντικός
-“meaningful”, from the root σηµαίνω «to symbolize, to mean»). The present work is about how
semantic representations emerge in the human brain, how they are organized, and what are their
effects on human behaviour.
This thesis is divided into 5 chapters. Chapter 1 is an introduction to the neuroscience of semantic
representations, and it will revolve around two main themes: the representation and acquisition of
concepts in the human brain through symbols (an issue known as the “symbol-grounding problem”
(Harnad 1980)), and the neural codes supporting the organisation of these representations.
Bringing together knowledge from previous studies, I will formulate two predictions: 1) that novel
semantic representations, defining the meaning of symbols (words) emerge in the brain as a
consequence of the orchestrated plasticity of both memory and perceptual systems, and 2) that in
humans the same neural codes subtending spatial navigation, might also support the
representation of language-based semantic knowledge, especially in those brain regions mostly
formation and the medial prefrontal cortex. By the end of Chapter 1 I will present a behavioural
training paradigm thanks to which human adults learn novel object concepts that I validated and
used for subsequent experiments. In Chapter 2 and 3 I will present a longitudinal fMRI study I
designed to test these predictions. In this study, participants were trained for 9 days to construct a
novel semantic space, and crucially they were tested before and after this learning process. I will
present the two sets of analyses separately, in the format of two independent journal articles, as
they attack two questions that I believe(d) being distinguishable. Chapter 2 will summarize the
neuroimaging results addressing the first prediction. Chapter 3 will address the idea that spatial
neural codes (distance-based and direction-based) employed by specific brain regions to represent
the structure of the physical space and to support spatial navigation, may also be recruited to
represent the structure of the novel semantic space during an orthogonal and non-spatial symbolic
categorization task. In Chapter 4 I will present the results of an independent behavioural
investigation aimed at verifying the advantages of using symbols to create novel categorical
representations: although at the moment of writing this experiment is still ongoing, I believe the first
effects that it shows will be of particular interest for the present dissertation. Finally, in Chapter 5 I
Semantic representations in the human brain
The nature of concepts has been a central topic in philosophy and cognitive science for
centuries. A long standing tradition in cognitive neuroscience attacked the question of the neural
correlates of human conceptual knowledge by taking advantage of the fact that in humans
conceptual memory is dependent on symbols, such as words or numbers, and can be inferred by
mostly using linguistic material. Such symbol-dependent form of conceptual knowledge is defined
“semantic memory” and its study aims at unveiling the neuro-cognitive mechanisms that give rise
to semantic representations.
Early neuropsychological studies (e.g. Warrington & McCarthy 1983; Warrington and Shallice
1984) indicated that brain damaged patients have selective deficits for some categories of
concepts compared to others. More than one hundred cases has been reported so far (for reviews
see Capitani et al. 2003; Mahon & Caramazza 2010), involving semantic specific impairments for
living things such as animals (e.g. Caramzza & Shelton 1998; Blundo et al. 2006), fruit/vegetables
(e.g. Hart et al. 1985; Samson & Pillon 2003), non-living things such as tools (e.g. Laiacona &
Capitani 2001; Sacchett & Humphreys 1992); and conspecifics (e.g. Ellis et al. 1989; Miceli et al.
2000).
Other studies tried to further extend these results by mapping what neocortical regions were
activated when healthy participants were engaged in various conceptual tasks prompted by words
presentation. The rationale behind this approach is that words, as abstract symbols provided with
meanings by experience, guarantee a rapid and efficient access to conceptual representations
while at the same time controlling the contribution of low-level properties of the physical input.
When participants are asked to perform tasks that enhance the meaningful nature of words, as
opposed for instance to pseudowords (e.g. Demonet et al 1992; Binder et al. 2003, 2005; etc etc.),
only those neocortical regions that store and elaborate purely conceptual information should
Despite the high variability in the kind of words (e.g. concrete vs. abstract words) or tasks (e.g.
evaluate if a string of letters was a words or a pseudo-words, or whether two words referred to
similar concepts or not) used, these studies generated very consistent results. In 2009 Binder et al.
published a critical review and meta-analysis of 120 functional neuroimaging (fMRI and Positron
Emission Tomography, or PET) studies focusing on conceptual processing on healthy adults.
These studies were conducted in laboratories all over the world in a period of time that span more
than 15 years (from 1992 to 2007), and involved a great variety of conceptual tasks. The results
revealed a distributed, but mainly left-lateralized network of 7 cortical regions consistently
activated: the left Angular Gyrus in the inferior parietal cortex; 2) middle and inferior temporal gyri
extending to the anterior temporal lobe; 3) fusiform and parahippocampal gyri; 4) dorsomedial
prefrontal cortex; 5) ventromedial prefrontal cortex; 6) inferior frontal gyrus; 7) precuneus and
posterior cingulate cortex (Figure 1.3). All the nodes of this network are associative regions far
from primary sensory and motor cortices, and they are consistently reported as high-level
multimodal areas (Mesulam 1985; Sepulcre et al. 2012) with wide and distributed connectivity with
secondary sensory areas (Achard 2006; Buckner et al. 2009; Andersen et al. 1990).
In 2013, Fairhall & Caramazza directly investigated what brain regions showed the definitional
property of neural semantic representations of object concepts (that is of concepts that represent
object classes) – that of showing corresponding, or similar, activation patterns for a concept,
irrespective to its presentation modality (either the symbol (e.g., the word CAT) or its referent (e.g.,
the picture of a cat) – by using multivariate analysis to identify neocortical regions that represented
well known object concepts in a modality invariant fashion. They presented participants with stimuli
belonging to 5 semantic categories – fruits, clothes, tools, mammals, and birds – during a
typicality-judgment task (e.g. rating the typicality of “hammer” as a tool, or “apple” as a fruit).
Crucially, participants were presented with these stimuli in either a pictorial (e.g. the picture of an
apple) or a symbolic (e.g. the string of letters A-P-P-L-E) format. The authors then applied a
cross-modal decoding procedure implemented in a whole-brain searchlight: for each sphere of the
brain activity evoked during the presentation of stimuli in one sensory modality (e.g. pictures), and
it was tested on the independent brain activity dataset collected during stimuli presentation in the
other modality (e.g. words). This revealed a network of areas mostly overlapping to the semantic
network, thus indicating that these regions are indeed representing semantic content irrespective
of the format (symbolic or pictorial) of presentation.
Among these neuroimaging studies using words to access semantic representations, the most
consistently reported neocortical region is the left Angular Gyrus (AG), in the inferior portion of the
parietal lobule (IPL). This region is practically absent in lower primates, and expanded significantly
in humans compared to their homologues in macaques (von Bonin and Bailey 1947; Hyvarinen
1982). Given its anatomical location at the conjunction of secondary visual, auditory, spatial, and
somatosensory associative regions, it has been indicated as the ideal candidate as neo-cortical
“convergence zone” (for a definition see Damasio 1989 and Meyer & Damasio 2009), where
high-level conjunction of perceptual information is integrated into more abstract, or conceptual,
representations (Geschwind 1965; Binder & Desai 2011). This view has been confirmed by brain
stimulation studies, causally linking modulation of AG activity to modulation of behaviour and
performance in memory tasks (e.g. Sestieri et al. 2013). Yazar et al. (2017) applied continuous
theta burst stimulation to this area while participants had to retrieve information on audio-visual
features of recently acquired memories. They showed a significant impairment in participants when
they had to retrieve conjunctive multisensory information (audio and video together) compared to a
condition where the stimulation was applied at a vertex control site, and no effect when they had to
retrieve single modality features (audio or video separately). This indicated a specific role of the
Angular Gyrus in combining (or binding) multisensory information, an operation that in real life is
essential for defining new memories and concepts, and also for grounding the meaning of new
symbols.
However, other works mostly based on clinical observations, indicated the anterior portion of the
left temporal lobe (ATL) as the key convergence hub for semantic processing (for reviews see
neurodegenerative disorder, semantic Dementia (SD). Mostly affecting temporal regions, this
disorder is characterized by severe anomia and inability to recover conceptual knowledge even in
tasks that do not require its explicit verbal communication, such as simple object use (Hodges et al
2000) or item identification based on sound (Bozeat et al. 2000), taste (Piwnica-Worms et al 2010)
or smell (Luzzi et al. 2007). SD patients are usually impaired in judging the typicality of items within
a conceptual category (e.g. guitar as musical instrument), and their performance decreases as a
function of specificity (e.g. recognizing a very specific dog breed)(Lambon Ralph et al. 2016).
Neuroimaging studies confirmed that anterior regions of the temporal lobe differently represent
concepts on the bases of their semantic details, such as categorical membership (Malone et al.
2016, Borghesani et al. 2016).
All these studies suggest that processing semantic knowledge in humans elicits activity in a
widespread network of associative regions that presumably, in light of their specific anatomical
positions, act as convergence zones (Meyer & Damasio 2009) for inputs coming from lower
associative and sensory regions.
But how do these semantic representations emerge in the brain? A fundamental problem in
cognitive science, indeed, is the “symbol-grounding problem” (Harnad 1980), that relates to the
issue of how a symbol acquires its meaning. In the field of cognitive neuroscience, this translates
to the question of whether and how the neural representations of symbols and the objects they
refer to change to reflect the novel, meaningful, association, or whether this novel representation
emerge separately and independently in brain regions that did not previously represent either the
symbols or the objects themselves.
The observation that in some cases there are shared neural representations between a symbol
and its non-symbolic meaning suggests that symbols acquire their meaning by means of a
mapping process onto the same neural representation of their referent (Pulvermuller 2013). This
seems particularly true in the case of numbers, where brain regions responding to quantity, such
as the Intraparietal Sulcus (hIPS), show a representational code common to both number symbols
that even the semantics of complex mathematical sentences activates the same neuronal circuits
usually involved in processing simpler numerical operations or over digits but also sets of items
(Amalric & Dehaene 2016).
However, as these studies focused on well known semantic categories, it is not possible to have a
conclusive answer, neither to unveil what are the brain mechanisms that allow this putative
mapping or grounding process to happen: indeed, these results are silent on whether the
computations necessary to attach a symbol to its meaning (and viceversa) happen within the same
areas the later show the mutual correspondence, or if other areas participates in building the novel
semantic representation.
One potentially powerful way to address the problem is to use training studies, where participants
learn new concepts by associating them with specific names. The use of functional neuroimaging
techniques then permits to record the activity patterns for the stimuli at different time points, for
instance before and after learning the semantic association, and thus reveal what are the changes
occurring in the brain as new meanings are created.
The behavioural consequences of learning novel with the use of symbols compared to learning it
without symbolic aids have been indeed explored in behavioural training experiments showing that,
for instance, the availability of symbols greatly facilitates the acquisition of novel categories both in
adult (Lupyan et al. 2007) and children (e.g. Althaus & Plunkett 2016, Althaus & Westemann
2015). There are reasons, coming from behavioural studies, to believe that the changes supporting
the emergence of semantic information spread also to perceptual representations. Past works,
indeed, highlighted the effects of categorization on perceptual judgements. Long-lasting expertise
can improve perception of diagnostic structures and features in animal (Biederman & Shiffrar
1987) or beer (Peron & Allen 1988) experts, as well as in radiologists (Norman et al. 1992),
suggesting that learning to recognize specific object categories by attaching them a label can alter
perceptual processing. Such a categorical effect on perceptual judgements seems to rely on
alteration revolves around acquired distinctiveness between members of different categories
(Lawrence 1949) and acquired equivalence between members of the same category (for a review
see Braunitzer et al. 2017). Goldstone (1994), for instance, found that participants who have been
trained to categorize, using labels, a set of 16 squares basing on their size and brightness were
more likely to discriminate between across- boundary stimuli compared to a control group,
providing behavioural evidence for acquired distinctiveness. This “warping” of the perceptual
representations occurring during categorization might indicate that learning new semantic
knowledge involves changes that may be traced down to the perceptual systems as well, effects
that are usually overlooked by studies that focused on well-known classes of object/words.
This might indicate that the symbol-grounding problem is solved by the human brain by means of
complex and distributed changes that spread even to perceptual representations.
Conclusions
Humans construct their conceptual knowledge of the world by organizing multisensory experiences
into labelled categories. No study to date systematically looked for the neural changes supporting
this uniquely human faculty monitoring the early stages of learning to map symbols to their
meaning. Several questions remain open: does learning generate ex-novo neuronal
representations that were not present before? Does it also, or only, modify previously existing
ones? Do these changes involve brain regions beyond the semantic network? What neural
mechanisms support these changes?
To answer these questions, I designed a learning experiment where I monitored, using fMRI, the
neural changes of learning novel multisensory object concepts using symbols. The details of the
experiment will be presented in Chapter 2, while the remaining part of this introductory chapter will
revolve around the second central topic of the present work: what is the representational format
Spatial codes for semantic spaces
The second part of this introduction is about the format underlying conceptual
representations in the human brain. This refers to the neural code(s) that different brain regions
employ to represent the relations between concepts. Specifically, I will discuss a fascinating idea
that emerged in the late 40s by Tolman (1949) and that has been recently formalized in a
theoretical work (Bellmund et al. 2018), suggesting that the representation of the knowledge we
have about things in the world and that we use in our everyday behaviour is supported by the
same neural mechanisms that we recruit to represent the physical space. This theory states that
the relationships between concepts and items in memory are conceivable as distances between
the regions of a conceptual representational space, and thus we can use the same neural codes
that allow us to navigate in the physical space (spatial codes) to “move” among concepts in
memory.
Between the 30s and the 40s Tolman conducted a series of behavioural experiments on rats,
where he observed that animals, to find rewards in complex mazes, were able to take shortcuts or
find new routes when the old ones were blocked (e.g. Tolan & Honzik 1930, Tolman et al. 1946).
He coined the term “cognitive map” to indicate that the animals, in order to show such complex and
adaptive behaviour, must have had developed an internal representation of the world and the
relationships between its elements, such as landmarks or locations (Tolman 1948).
A literal interpretation of the word “map” directed the following years of research to find the internal
neural correlates of such representation of the external physical environment. In 1971 O’Keefe and
Dostrovsky discovered hippocampal “place cells”, neurons that are active when the animal enters
very specific positions in the environment, no matter the orientation of the movement trajectory or
its velocity. The following four decades have seen a proliferation of milestone results in the study of
such as head direction cells (Ranck 1984; Taube et al 1990), boundary cells (O’Keefe and Burgess
1996), boundary vector cells (Lever et al. 2009), speed cells (Kroppf et al. 2015), object vector
cells (Hoyadal et al. 2017) and most recently even social place cells (Omer et al. 2018; Danjo et al.
2018).
The most celebrated kind of spatially tuned neurons are grid cells, first described by the group of
Edvard and Mary-Britt Moser (hafting et al. 2005), who in 2014 were awarded, together with John
O’Keefe, the Nobel Prize in Medicine and Physiology. Grid cells were first observed in the medial
entorhinal cortex of rats (a sub-portion of the hippocampal formation, mostly projecting to the
hippocampus), and are neurons that fire for multiple spatial locations in the environment. These
locations correspond to the vertices of a regular triangular grid covering the entire environment,
and show a precise 6-fold rotational symmetry, resulting in a very specific hexagonal pattern.
Besides their peculiar firing rate, grid cells show some other very interesting properties. First,
visual cues strongly influence the alignment of the grid: when external cues are rotated, the grid
pattern rotates in the same way. Second, grid activity remains unchanged when visual input is
removed (e.g. by turning off the lights in the environment). Third, grid patterns appear as soon as
the animal enters a novel environment. Finally, and possibly most importantly, grid cells maintain
the specific size of the grid pattern and its offset compared to one another even if the animal is
moved to different environment. This property is not shown for instance by hippocampal place
cells, that exhibits a profound remapping in different environments (Bostock et al. 1991; Leutgeb et
al. 2005; Fyhn et al. 2007). In general, grid cells are thought to support path-integration, enabling
an internal representation of distances between locations, thus guiding mammals’ behaviour when
navigating the environment (Bush et al 2015).
A seminal study by Doeller et al. (2010) demonstrated that grid activity is present in humans, and
that it is possible to record it using non-invasive functional MRI. This study moved from a very
precise observation about electrophysiological data on rats: grid orientation of different grid cells
relative to the external environment remains constant across cells (while for instance their relative
consider a single grid cell, which activates more often when the animal moves in the environment
in a direction that is aligned to one of the 6 main axes of the grid, compared to a situation where it
moves for the same distance but in a direction that is not aligned. If we consider now entorhinal
activity at the population level, this would result in a stronger signal for movement directions
aligned to the grid (one of the 6 axes) compared to movement directions that are not aligned to the
grid.
The brilliant intuition of the authors was that such different population activity should require a
different consumption of blood, thus it could be observed at cortical level as a modulation of the
BOLD signal, using functional MRI. Doeller et al. in their experiment asked participants to navigate
a virtual reality environment with a joystick, while lying in the MR scanner. During navigation,
participants had to find the locations of some objects, while their brain activity was analysed,
looking for 6-fold modulations of the BOLD signal as a function of running direction (at this step,
randomly aligned to a reference direction). The analysis technique they used was particularly
complex, and consisted in two steps. In a first step, half of the functional data were used to
estimate the putative grid orientation, by means of a quadrature filter procedure. Next, they aligned
the running directions of the second, and independent, half of the dataset to the putative grid
orientation, and looked for intensity of the BOLD signal for aligned vs. misaligned clusters (30°) of
movement directions. They reported an impressively precise modulation of BOLD signal in the
right entorhinal cortex, that could not be explained by other periodicities (e.g. 45° or 90°). Crucially,
when they applied fMRI adaptation to reveal those brain regions that showed a reduction in fMRI
signal according to how recently participants were running at 60° to the current direction, this
revealed a network of areas including not only the entorhinal cortex, but also other areas, such as
the medial prefrontal cortex, best known for its connectivity to the hippocampal formation and for
its role in both spatial e non spatial memory (Preston & Eichenbaum 2013).
In 2013 Jacobs et al. reported the first evidence of grid cells in humans using intracranial
cortex and in medial prefrontal cortex exhibited grid-like firing patterns as a function of spatial
position in the virtual environment, thus proving that humans and lower level animals rely on
corresponding spatial-coding schemes at neuronal level. Interestingly, two independent studies in
2016 observed grid-like modulation of fMRI BOLD signal when healthy participants were involved
in imagined navigation tasks. In the first of these studies, Horner et al. (2016) trained participants
to memorize the positions of 6 objects in a virtual reality environment. Next, they asked them to
either move or imagine moving to the locations of each object, from various positions, thus eliciting
different movement trajectories. ROI-based analysis revealed a significant cluster of voxels in EC
that showed 6-fold modulation of bold signal as a function of running direction. In the second study,
Bellmund et al. (2016) independently confirmed these results by applying a more parsimonious
and potentially powerful method based on Representational Similarity Analysis (RSA, Kriegeskorte
et al. 2008), where they showed that the neural similarity of pairs of imagined movement
trajectories – carefully sampled to be at 30° or 60° apart one from each other – was higher, in EC,
when the two trajectories were 60° apart compared to when they were 30° apart, as an underlying
grid-code would impose.
As both the hippocampal formation and the medial prefrontal cortex are classically associated to
more general memory functions (see Preston & Eichenbaum 2013, Stalnaker et al. 2015; Behrens
et al. 2018 for reviews), is it possible that the same spatial codes are involved in non-spatial
navigation tasks? Constantinescu et al. have made a crucial contribution in this sense in 2016.
They adapted the same logic and experimental design of Doeller et al. (2010) to ask whether the
same grid-like activity could be observed, using fMRI, when participants processed a novel
continuous space of visual shapes. They created 6 bird shapes and they associated each one of
them to a Christmas symbol. Crucially, bird shapes varied in the length of their legs and neck, thus
each bird could be intended as a point in a bi-dimensional “bird” space where coordinates were the
length of the two diagnostic features. They made participants familiarize with this bird space by
means of a task where they could adjust the ratio between neck-length and legs-length, thus
had to find the 6 birds shapes associated to the Christmas symbols. Next, during the fMRI
sessions, participants were presented with brief videos of morphing birds, showing a slow change
in their silhouette in terms of neck- and legs-length. Participants were instructed to imagine the
morphing animation to continue “in the same way” (that is, crucially, in the same direction in the
corresponding 2D bird space) and to guess what kind of resulting bird shape they will find, as
indicated by one of the Christmas symbols. Although participants were not consciously aware of
the 2D spatial representation underlying this task, when authors analysed their brain activity as a
function of “morphing” direction looking for the 6-fold periodic modulation typical of grid-cells
activity, they found it in a network of areas strikingly similar to the one reported by Doeller et al.
(2010) for spatial navigation. In particular, this signal was stronger in the entorhinal cortex and in
the ventromedial prefrontal cortex.
This result was the first, and to date the only one, evidence of hexadirectional modulation for a
non-spatial task in humans, which required memorizing a continuous and bi-dimensional visual
space. This proves that the grid-code might serve, in the human brain, a more general function
than representing the physical space, and it opens the possibility of representing conceptual
knowledge using spatial codes.
But what does it mean to represent knowledge using spatial codes? In the theoretical framework
formalized by Gardenfors (2000), knowledge can be conceived as organized into “cognitive
spaces”, internal representations of objects or events spanning by a set of quality dimensions
(sensory or abstract features). For instance, a zebra and a wasp can be thought as occupying
different regions in a bi-dimensional “animal space” spanning animals’ size and ferocity, or any
other two dimensions might be relevant for the task to solve or for the memory to encode. Any
given stimulus can be thus located in a cognitive space according to a set of diagnostic feature
values. Relations between concepts (regions of the cognitive space) can be expressed using
geometrical notions: dissimilarity between concepts can be expressed as Euclidean distance
conceivable as movements in the corresponding underlying space. Interestingly, a very similar
intuition is also emerging in completely different fields, that of neurolinguistics and computational
linguistics, where scholars tend to conceptualize word meanings (that is, semantic representations
of concepts), as regions or points in an internal space, the semantic space, with proximities
reflecting similarity in meaning, thus highlighting that high-level symbolic thinking might share
some important features with spatial processing (Borghesani & Piazza 2017). Under this
framework, it is essential to provide an interface to index the location of a concept along one or
more dimensions. Place- and grid- cells do that for physical spaces, easily conceivable as
bi-dimensional navigable surfaces, but they might serve the same purpose for any conceptual
representation that can be reduced to an n-dimensional space of task relevant features.
Consider the study by Aronov et al. (2017). In the task they designed, rats were required to use a
joystick to manipulate a sound along a 1-dimensional continuous frequency axis, to find the correct
frequency that would lead to a reward. They recorded neural activity in the hippocampus and in the
entorhinal cortex, and they found that both regions contained neurons that responded to very
specific sound frequencies. In particular, neurons in the hippocampus fired selectively for only one
frequency each, while neurons in the entorhinal cortex exhibited multiple firing fields at different
(usually 2-3) sound frequencies. Crucially, to test whether these neurons were also involved in
spatial representations, they recorded their activity while rats navigated a spatial environment
looking for pellets of food. They found that between 25% and 35% of spatially tuned cells were
also involved in the sound modulation task. These results indicate that during a non-spatial task,
the hippocampal-entorhinal system of lower-level mammals holds a representation of the task
relevant features (in this case just one, sound) in a 1-dimensional feature space, where different
regions or states (the frequencies) are represented by the same neurons that represents locations
in the physical environment, showing similar firing properties (e.g. single selective vs. multiple firing
fields for place and grid cells, respectively). As spatial and non-spatial task representations are
produced by the same neuronal population, the underlying neural code(s) – usually referred to as
function, such as representing the underlying structure of an internal representation of the task:
exactly what Tolman called “cognitive map” and what Gardenfors called “cognitive space”.
Conclusions
Humans and lower level mammals rely on the same neural mechanisms to navigate the physical
space, recruiting a variety of spatial codes mostly encoded in the hippocampal formation.
However, the same spatial-codes that allow to navigate the physical space have been observed in
humans in non-spatial tasks, such as evaluating visual shapes corresponding to regions of a
perceptual bi-dimensional visual space. This suggests that in humans, the same structures and
neural codes that subtend spatial representations might also be recruited for more abstract and
higher-level forms of cognition. To date, no study has investigated more thoroughly this intuition.
Do “spatial” codes activate to represent human semantic knowledge, which is multisensory,
categorical, and highly dependent, by definition, on symbols and language?
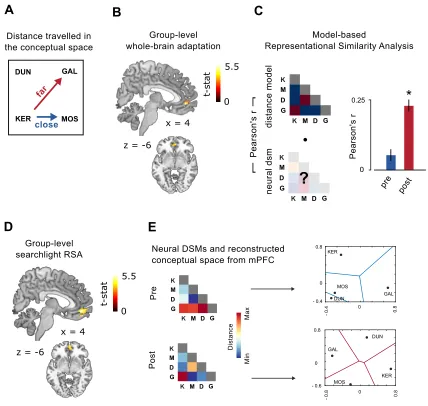
I will address this point specifically in Chapter 3, where I will use multivariate analysis to explore
the existence of both a distance and a direction-based code of a novel semantic space during a
Introduction to the experimental work
In the next chapters I will describe three works trying to attack 3 fundamental questions in
the study of semantic representations:
1. how do semantic representations emerge in the human brain?
2. does the human brain recruit spatial codes for representing semantic information even
when it has no spatial content?
3. does learning categories of objects using symbols facilitate generalization to novel
exemplars?
The first two works will describe a set of longitudinal fMRI analyses combined with a 9-days long
symbolic categorical training, that represented the core of my work during this doctoral program.
The third work, which is still ongoing, will present the very preliminary, yet of potential interest,
results of a behavioural investigation.
The first part of my doctorate has been dedicated, besides the study of the relevant literature and
of the neuroimaging methods that I will be describing later on, to validate a behavioural training
paradigm suitable for later experiments. This revolved around i) the creation of a novel semantic
space composed by multisensory objects, which are divided into 4 orthogonal categories by means
of abstract labels (novel words), and ii) the validation of the behavioural training. I will briefly sum
up the methods and the results of this validation as final part of this introductory chapter, before
moving to the presentation and the discussion of the experimental work.
Participants. The study included 15 right-handed adult volunteers (10 females and 5 males; mean
age = 21.6, std = 2.02). All participants gave written informed consent and were reimbursed for
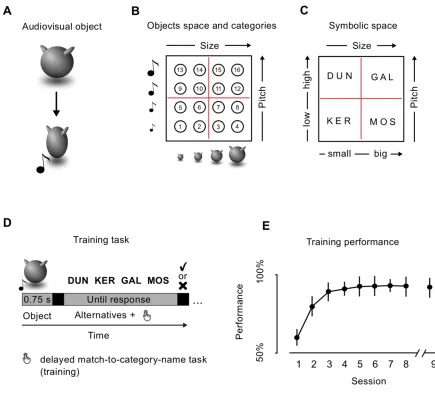
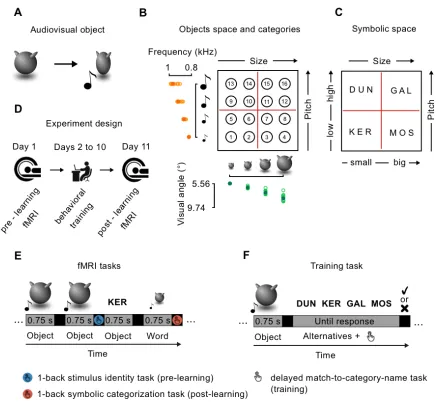
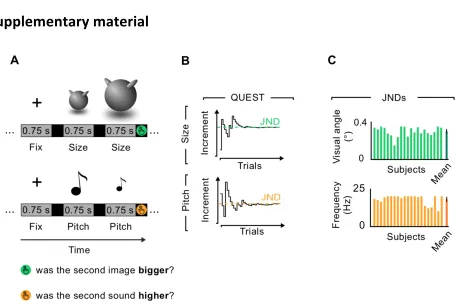
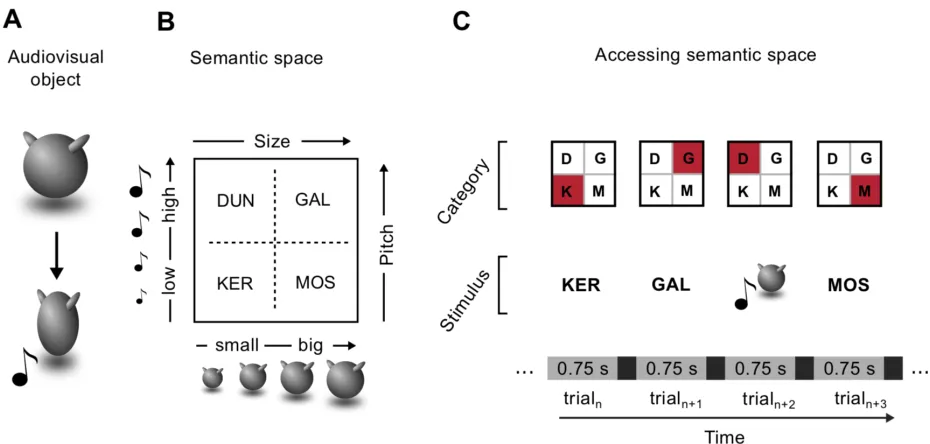
Stimulus space. I developed a set of 16 novel animated multisensory objects, orthogonally
manipulating the size of an abstract shape (Figure 1.1A) and the pitch of an associated sound. A
total of four size- and pitch- levels were used for each participant, leading to a stimulus space
where each object represented the unique combination of one size and one pitch level (Figure
1.1B). The values of these two features were selected for each participant on the first day of the
experiment, following a brief psychophysical validation consisting of a QUEST adaptive staircase
method (Watson & Pelli 1987). Using a two-stimuli comparison task for each sensory modality, I
calculated subject-specific sensitivity as the minimum appreciable increment (Just Noticeable
Difference, JND) from a reference value (size: visual angle of 5.73°, pitch: frequency of 800 Hz)
leading to 80% of correct responses. For each sensory modality, four subject-specific feature
levels were calculated, applying the logarithmic Weber-Fechner’s law and selecting values at every
three JNDs, in order to ensure that feature levels were equally distant and clearly identifiable.
Moreover, in order to strengthen the multisensory binding between the two unisensory features, I
applied a ‘squeezing’ animation during each object presentation by displaying 13 frames of the
same object with increasing (frames 1 to 7) and decreasing (frames 8 to 13) size along the
horizontal axis (for an exemplar video of the animated stimuli, visit
https://www.youtube.com/watch?v=Nyq2BgY-8jc&feature=youtu.be). Objects presentation lasted a
total of 750 ms and sounds were presented at the apex of the squeezing period. The object space
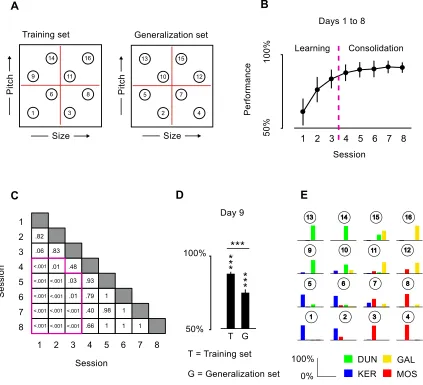
was divided into four categories based on the combination of two sensory boundaries (Figure
1.1B). The categorical membership of each object, as well as their unique multisensory identities,
could thus be recovered only when considering both sensory features. I assigned to each category
an abstract name (Figure 1.1C): KER (small size and low pitch); MOS (big size and low pitch);
DUN (small size and high pitch); GAL (big size and high pitch).
Stimuli presentation. Stimuli were presented foveally using MATLAB Psychtoolbox in all
experimental phases, at a distance of ~ 130 cm. Multisensory objects subtended a different visual
angle for each size level, and a different frequency for each pitch level, ranging from an average of
level 4. Each word subtended a visual angle of 3.58° horizontally and 2.15° vertically, and was
presented with black Helvetica font on a grey background.
Stimuli presentation. Stimuli were presented foveally using MATLAB Psychtoolbox in all
experimental phases, at a distance of ~ 130 cm. Multisensory objects subtended a different visual
angle for each size level, and a different frequency for each pitch level, ranging from an average of
5.73° and 800 Hz for level 1 (size and pitch, respectively) to an average of 8.97° and 973.43 Hz for
level 4. Each word subtended a visual angle of 3.58° horizontally and 2.15° vertically, and was
presented with black Helvetica font on a grey background.
Behavioral training. Participants underwent 9 daily sessions of behavioral training, aimed at
making them learn the correct name of each object. Each behavioral session was approximately
10 minutes long, and it was divided into 4 mini-blocks of 20 trials each, for a total of 80 trials. It
started with a brief presentation of the objects as exemplars of the four categories (KER, MOS,
DUN, GAL). After this familiarization phase, each trial consisted of an object presentation (750
ms), followed by a fixation cross (500 ms), and by the presentation of the 4 possible names in
random order, from left to right (Figure 1.1D). Each object was presented 10 times per training
session. Participants were instructed to press one key on the keyboard to select the correct name.
They were asked to respond as fast as possible, but no time limits were imposed. After their
response, an immediate feedback appeared on the screen for 1000 ms, indicating with the words
“Correct!” or “Wrong!” the accuracy of the choice. In the case of a wrong answer, the feedback also
showed the correct object name, in order to speed up the learning process. After each miniblock,
participants would be provided with the cumulative percentage accuracy. Starting from the seventh
training session, the trial-by-trial feedback was removed and participants could rely only on the
block-by-block cumulative feedback. For the first 8 days of training, participants were presented
with the same 8 objects used in the two fMRI sessions. On the last training day, without being
notified of the change, they were presented with all 16 objects. This allowed me to test for
10 - 12 - 13 - 15), which would be a key ingredient of an efficient semantic representation. For this
last session, the mini-blocks number was kept at 4, but the number of trials was doubled, resulting
in a total testing time of ~ 20 min.
Behavioral training results.The learning trajectory indicated an increment in performance from
session 1 to 8 (session 1: 46.5 ± 16%; session 2: 66.33 ± 20%; session 3: 75 ± 18%; session 4:
77.5 ± 15%; session 5: 78.6 ± 19%; session 6: 78.7 ± 18%; session 7: 79 ± 14%; session 8: 78 ±
19%; difference from session 8 to session 1: t14 = 7.25, p = 4.17x10⁻⁶). Performance collected on
session 9 confirmed both the successful learning of the name-objects association and its
generalization (training set: mean accuracy = 79.5%, std = 17%, different from chance t = 16.71, p
< .001; generalization set: mean accuracy = 75.58%, std = 15.29%, difference from chance, t =
12.81, p < .001)(Figure 1.1E).
Conclusions
The results of this first behavioural validation indicates that participants correctly learned to
categories the novel multisensory space using words. Moreover, by analysing the performance on
the last training day (test day), I can conclude that the categorical meaning of the novel word was
acquired in an abstract and generalisable way, because participants could correctly categorise
novel exemplars, a key ingredient when creating behaviourally relevant semantic representations.
NEURAL MECHANISMS UNDER
LYING THE
EMERGENCE OF SEMANTIC
REPRESENTATIONS
Introduction
A fundamental problem in cognitive science is the “symbol-grounding problem” (Harnad
1980), related to the question of how symbols acquire their meanings. Indeed, a key step for
making sense of the rich multisensory world surrounding us is to be able to parse it into meaningful
discrete categories, and humans use symbols (such as words or numbers) to construct, recall, and
generalise this knowledge. Although even very young children can solve this fundamental act with
a striking ease, its neural correlates are still elusive and largely unexplored.
Previous studies investigated how the human brain represents meanings, mostly focusing on the
brain responses of adults processing overly known semantic categories, such as that of
manipulable objects, food items, animals, or numbers. They report that several regions of the
cortex, mostly in the parietal and infero-temporal lobes (see Binder et al. 2009; 2011) contain
sufficient information for discriminating concepts both within and across classes, and do so both
when they are presented as visual shapes (e.g. Connolly et al. 2012, Clarke & Tyler 2014, Cichy et
al. 2014) and as written (e.g. Borghesani et al. 2016; Liuzzi et al. 2019) or spoken (Liuzzi et al.
2015; 2017) words. Crucially, few studies suggested that symbols acquire meaning by linking their
neural representations to the ones of the (class of) objects they refer to: this has been suggested
to be the case in the case of numbers (Piazza et al. 2007; Eger et al. 2009), color (e.g. Simmons et
al. 2007), objects/tools (Chao et al. 1999), and places (Kumar et al. 2017). However, since humans
start learning the meaning of words and thus constructing these kinds of representation extremely
emergence. As a consequence, how the human brain solves the symbol-grounding problem
remains unknown.
While functional imaging in young children is possible, it is extremely time consuming and difficult
to perform. A potentially easier and more powerful way to attack this issue is to engage adult
participants in training studies, where they have to learn new concepts by giving names to
previously unseen classes of objects or events. Monitoring, through functional neuroimaging, the
changes occurring in the neural representations evoked by the stimuli (the symbols and their
referents) as a function of learning, should unveil the brain mechanisms underlying the emergence
of semantic representations. Behavioural studies already showed that learning to categorise visual
objects using labels (that is, linking specific portions of a perceptual space to an abstract symbol
and therefore creating a meaning, or a semantic representation, for that portion), alters perception,
facilitating categorization itself (Lupyan et al. 2007) and even altering the perception of the objects
themselves (Goldstone et al. 1994). This suggests that the way our brain creates new meanings
through symbols significantly affects its own internal representation of the external world, and that
the brain mechanisms engaged to solve the symbol-grounding problem might be more profound
than simply associating two previously separate representations.
In this study, I focused on the neural correlates of learning novel categories of multisensory objects
by giving them a name, and asked two specific questions:
i. where and how the new semantic representations emerge, as a function of learning, in the
human brain?
ii. how profound are the changes induced by symbolic learning on perceptual
representations?
I designed a longitudinal learning experiment where a behavioural training was paired with two
fMRI sessions: one before and one after the training period. Participants learned for 9 days to
focused on written words because reading is one of the most distinctive abilities humans
developed in the course of the evolution, strongly linked to the act of creating and conveying
meanings using symbols, and the processing of which we have a good cognitive and
neuroscientific understanding (e.g. McCandliss et al. 2003; Dehaene & Cohen 2011). Also, I opted
for using a multisensory object space because previous studies on categorization focused mostly
on visual stimuli, thus overlooking other sensory modalities and most of the times not even
considering their combinations. In real life, however, we constantly integrate information coming
from different sensory inputs to correctly recognize objects (for instance, I recognize an individual
by integrating several visual features of her face with the specific sound of her voice), and how this
multisensory integration relates with the process of creating semantic representations is ignored.
Before and after learning participants were presented, during an fMRI scanning session, with
pseudorandom sequences of the very same set of multisensory objects and visual words. While
before learning they performed a simple one-back task on stimulus identity, after the learning
period outside the scanner they were actively engaged in an object-name categorization task that
explicitly required to associate each word to the correct objects, which is akin to the task they were
performing during their training. In this way, I could properly isolate the brain regions involved in
the process of grounding symbols to their meaning, and study the effects of this process at the
whole brain level.
Methods
Participants. The study included 25 right-handed adult volunteers (fifteen females and ten males;
mean age = 22.20, std = 2.74). All participants gave written informed consent, underwent
screening to exclude incompatibilities with the MRI scanner, and were reimbursed for their time.
The study was approved by the ethics committee of the University of Trento (Italy). Data from 4
subjects were excluded from the analyses given their poor behavioral performance during the
second fMRI day (accuracy < 70%). This led to a final sample of 21 participants (thirteen females
Stimulus space. You can refer to Chapter 1, section 1.3 for identical procedures on how the
stimulus space was created. For the current Chapter, the relevant figures are Figure 2.1 (A-B-C)
and Figure 2.S1.
Stimuli presentation. You can refer to Chapter 1, section 1.3 for identical procedures on how the
stimulus space was presented. Behavioural and fMRI sessions were matched for stimuli
presentation details.
Experimental sessions. The experiment consisted of three parts: pre-learning fMRI, behavioral
training, and post-learning fMRI (Figure 2.1D). During pre-learning fMRI, participants were
exposed for the first time to the new multisensory objects and to the abstract names. This allowed
recording of the patterns of neural activity evoked by the stimuli when they didn’t share any
relationship. Starting with the following day, subjects underwent nine sessions of behavioral
training outside the scanner. The aim was to teach them the object-name correspondence, an
operation requiring parsing of the object space into four categories and connecting each symbol
(word) to its meaning (the correct category exemplars). Finally, during the post-learning fMRI, they
were again exposed to the same objects and words, now probing their mutual correspondence,
and allowing us to record the updated cortical activity. On average, the second fMRI session
occurred 9.86 days (std = 1.4 days) after the first one. All the tasks are described below. During
both fMRI sessions, and during the first 8 training days, I used 8 out of 16 objects available in each
subject’ stimulus space (objects: 1 - 3 - 6 - 8 - 9 - 11 - 14 - 16); the remaining 8 were used only
during the 9th training session to test for generalization (see below).
Functional localizer. At the start of the pre-learning fMRI session, participants underwent a
block-design functional localizer block-designed to isolate the cortical regions recruited to process visual and
acoustic components of our objects, as well as their conjunction. During video mini-blocks,
component. During audio mini-blocks participants were presented with sounds varying in pitch,
without the object visual component. Finally, during multisensory blocks participants were
presented with multisensory objects: animated objects varying in size, associated with sounds of
different pitch. There were four blocks for each condition (video, audio, multisensory), resulting in a
total of twelve mini-blocks of six stimuli each, presented in pseudo-random order. Each block was
preceded and followed by 10 s of fixation cross. For each block, participants had to perform a
simple 1-back task, pressing a button whenever they detected a repetition of the same stimulus:
same size for video blocks; same pitch for audio blocks; same size and same pitch for
multisensory blocks.
fMRI tasks. During the first fMRI session, participants performed a simple 1-back task on stimulus
identity, where they were presented with the multisensory objects and the four abstract words in
pseudorandom order. They were instructed to press a button when they detected an immediate
repetition of the very same stimulus (either multisensory object or word). In the case of
multisensory objects, they had to take into account both the size of the object and the pitch of the
associated sound to provide the correct answer (Figure 2.1E). Each stimulus was presented for
either 750 ms (objects) or 500 ms (words), with a variable ISI of 4 +/- 1.5 sec during which a blue
fixation cross was presented. There were 4 runs, each one lasting around 7 minutes. Within a run,
each stimulus (8 objects and 4 words) was repeated 6 times, resulting in 72 trials per run. There
was one target event (1-back repetition) per stimulus, for a total of 12 out of 72 (~17%) expected
responses per run. During the second fMRI session, participants were presented with a 1-back
task on word-object correspondence, were they had to correctly associate each object to the
corresponding name. This task could not be performed before learning given the absence of any
categorical knowledge for our stimulus space. Participants were instructed to press the button
anytime a multisensory object was followed by the corresponding name (e.g. object 1 followed by
the word “KER”), and vice versa (e.g. word “KER” followed by object 1), requiring thus access to
number of runs, trials, and stimuli repetition matched the 1-back task on stimulus identity on the
first fMRI day.
Behavioral training. You can refer to Chapter 1, section 1.3 for identical training procedures. The
relevant figure for the current Chapter is Figure 2.1F.
Neuroimaging acquisition. Data were collected on a 4T Bruker scanner (Bruker BioSpin) with
standard head coil, at the Center for Mind/Brain Sciences, University of Trento, Italy. Functional
images were acquired using EPI T2*-weighted scans. Acquisition parameters were as follows: TR
= 3 s; TE = 21 ms; FA = 81°; FOV = 100 mm; matrix size = 64 x 64; number of slices per volume =
51, acquired in interleaved ascending order; voxel size = 3 x 3 x 2 mm. T1-weighted anatomical
images were acquired twice per participant (pre- and post-learning) with an MP-RAGE sequence,
with 1 x 1 x 1 mm resolution.
Preprocessing and General Linear Model. Functional images were preprocessed using the
Statistical Parametric Toolbox (SPM8) in MATLAB. Preprocessing included the following steps:
realignment of each scan to the first of each run; co-registration of functional and session-specific
anatomical images; segmentation; normalization to the MNI space. No smoothing was applied.
Functional images for each participant individually were analyzed using a general linear model
(GLM) separately for the two fMRI sessions. For each run, 22 regressors were included: 13
regressors of interest, corresponding to the onsets of the eight objects, the four words, and the
motor response; 6 regressor for head-movements (estimated during motion correction in the
pre-processing); 3 regressors of no interest (constant, linear, and quadratic). Baseline periods were
modelled implicitly, and regressors were convolved with the standard HRF without derivatives. A
high-pass filter with a cutoff of 128s was applied to remove low-frequency drift. I thus obtained one
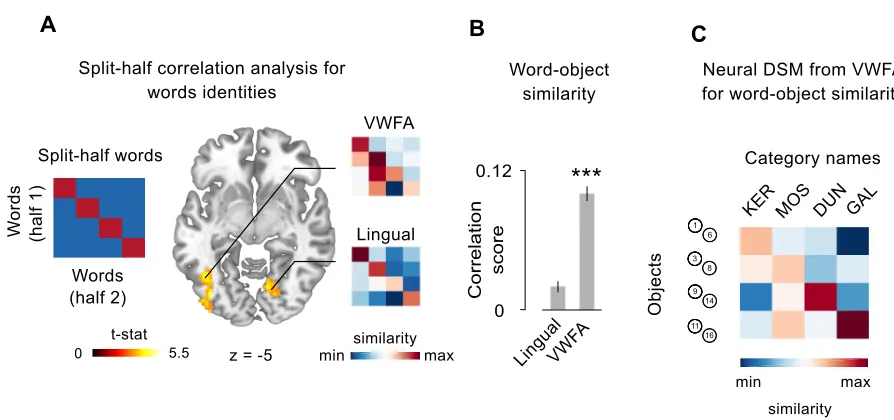
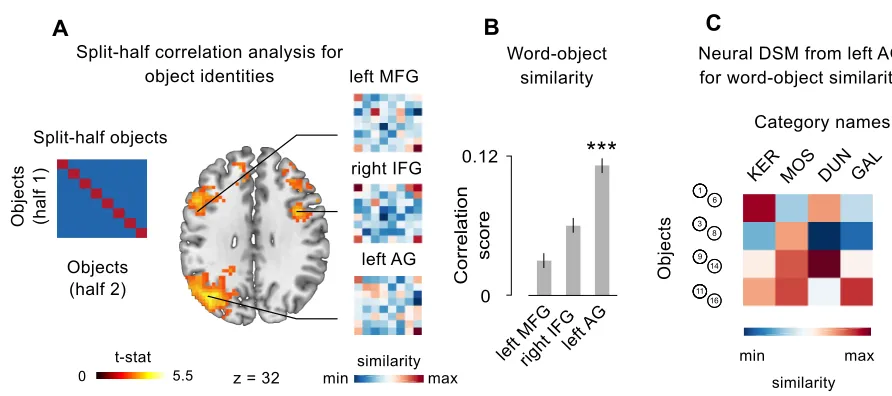
Split-half correlation analysis: words and objects identities. First of all I isolated those brain regions
representing the identities of the 4 words and the 4 objects. To do that I applied a multivariate
approach (see Haxby et al. 2014), implemented in a whole brain searchlight. A sphere with a
radius of 3 voxels - selected for consistency with previous studies (Connolly et al. 2012) - was
centered in every voxel of the subject- and session-specific datasets. Within each sphere, I
conducted a split-half correlation analysis (Haxby et al. 2001) that allowed me to test whether the
distributed activity within a brain region differentiates between stimuli. I extracted, within each
sphere, the patterns of neural activation across voxels for either the 4 words or the 8 objects,
separately. Then I divided the dataset into two halves, and I crossed the neural representations of
each stimulus (either words or objects) with each other, resulting in a correlation matrix with 4x4
entries for words, and 8x8 entries for objects (Figure 2A-D): here, the correlation between
matching stimuli coming from the two different halves laid on-diagonal, while the correlation
between non matching stimuli laid off-diagonal. If the activity in the ROI is differentiating between
stimuli identities (that is, is representing differently the four words or the eight multisensory
objects), the mean difference between Fisher-transformed values on-diagonal versus off-diagonal,
resulting from all the possible combinations of the two dataset halves, should be positive. For each
sphere, the resulting correlation score was stored in the center voxel, therefore I obtained one
correlation map per subject, per session, and per type of stimuli (words or objects).
Single-subjects’ correlation maps were then submitted to group-level analysis to reveal significant clusters
of voxels where multivariate information was sufficient to distinguish different words and different
object identities. In the specific case of object identities, to be sure that the resulting clusters were
sensitive to multisensory information and not to one of the two sensory features (that is,
differentiating objects only basing on their size or on their pitch), I additionally run two
corresponding searchlights but looking for brain regions responding to unimodal variations
between objects. I used the union of these two resulting maps as exclusive mask for the
group-level analysis on object identities, therefore guaranteeing that the resulting clusters were sensitive
to multisensory conjunction only, that is the real definitional criteria of our individual object
following analyses were conducted on Regions of Interest (ROIs) of matching voxel size.
Corresponding results were obtained when the entire clusters were considered.
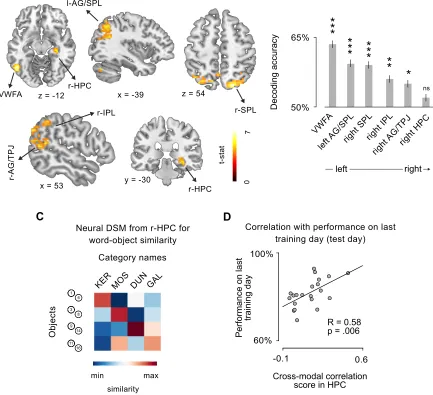
Crossmodal correlation analysis. In the brain regions individuated from the two split-half correlation
analyses, encoding the identity of either the four words or of the 8 objects, I run a crossmodal
correlation analysis, where I attacked directly the core question of the study, that is the rise of
mutual correspondence between the representations of objects and the names (symbols) used to
denote them. By looking in these two areas I put to direct test the hypothesis that brain regions
representing either words or objects change their activity to reflect the acquired association with
the corresponding referent or symbol, respectively. In the crossmodal correlation analysis I divided
the dataset into categories of objects (e.g. objects 1 and 3, or objects 6 and 8) and words, and I
crossed the neural representation of each object category to the neural representations of each
name (e.g. ‘KER’ or ‘GAL’), resulting in a 4x4 correlation matrix. I reasoned that if voxels within an
ROI represent the correct category-name association (e.g. the category composed by objects 1
and 3, and the word ‘KER’), then the correlation of neural patterns corresponding to matching
stimuli (on-diagonal) should be higher than that of non-matching ones (off-diagonal). Thus, the
mean difference between Fisher-r-to-z-transformed on-diagonal vs. off-diagonal values is stored
for each subject, as summary of the information for the ROI, and subjects’ correlation scores are
later tested against a null hypothesis of no correlation at the group level. Additionally, to avoid
overlooking other potential brain regions that could contribute to this association, I implemented
the same ROI analysis in a whole brain searchlight (for parameters, see above Split half
correlation analysis).
Decoding stimulus modality (words vs. objects). To investigate the contribution of the brain regions
individuated by previous analyses, I wanted to quantify, in each region, the extent of abstraction in
the representation of semantic classes. The neural signature of full abstraction from stimulus
modality would correspond to an absence of residual information relative to it, that is the
given corresponding object. In order to test this I implemented a decoding approach, because the
higher the information on the stimulus modality, the higher the performance of a classifier trained
with that that information to predict the incoming modality of an independent stimulus. I used a
leave-one-run-out scheme to train and test a Linear Discriminant Analysis (LDA) in correctly
predict the modality of the incoming stimulus, and I stored each subjects’ and ROI’s accuracy for
later group-level test against a null hypothesis of chance performance (50%). Corresponding
results are obtained using a Support Vector Machine (SVM).
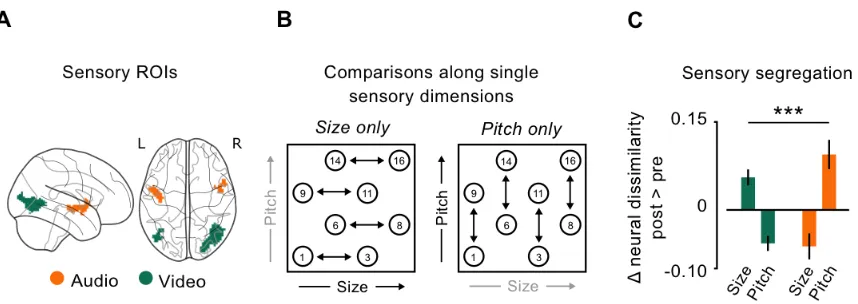
Perceptual learning and sensory segregation. To investigate is the changes induced by learning
could be traced down to the activity of sensory regions, I focused on the representational
geometries of objects in those brain regions that responded separately for their size or their pitch.
ROIs responding to the visual and to the acoustic components of our multisensory objects were
isolated on pre-learning imaging data. I selected brain activity evoked at group-level (p<.001; FWE
corr.) by objects presentation during the 1-back task on stimulus identity. I masked the signal with
the group-level results (p<.001; FWE corr.) of the functional localizer for either the visual and the
acoustic modality. This resulted in a bilateral network wherein the Lateral Occipital Complex (LOC)
and the anterior portions of the Superior Temporal Gyrus (STG) responded to the visual and to the
acoustic components of our stimuli, respectively (Figure 2.4A). All clusters were binarized and
used as regions of interest in the following analyses. In absence of a priori hypotheses on the
lateralization of sensory signals, bilateral ROIs were used. In order to investigate whether the
activity in sensory areas responding to visual and acoustic components of our objects changed
after learning, I extracted neural dissimilarity (1 - Pearson’s correlation) between pairs of all
objects varying along one sensory dimension only (e.g. between object 1 and object 3, that varied
in their size but had the same associated sound, Figure 2.4B), and considered their difference
between the two fMRI sessions as dependent variable. I conducted a 2x2 repeated measures
ANOVA looking for the interaction between the two ROIs (LOC and STG) and the two sensory
modalities (distance between objects with different size but same sound, and vice versa). This
to their names (which is a fundamental step in the symbol-grounding problem) affected the
perceptual representations of the referents (here the objects). By taking advantage of a
longitudinal neuroimaging study, I could compare their neural representations after learning, during
a semantic categorization task, with a pre-learning condition where no semantic information could
be retrieved, not even automatically, because it was not part of participants’ knowledge.