A SMALL MACRO-ECONOMETRIC MODEL FOR NAMIBIA
EMPHASISING THE DYNAMIC MODELLING OF THE
WAGE-PRICE, PRODUCTIVITY AND UNEMPLOYMENT
RELATIONSHIP
by
TAFIRENYIKA SUNDE
Submitted in accordance with the requirements for the degree of
DOCTOR OF LITERATURE AND PHILOSOPHY
In the subject of
ECONOMICS
at the
UNIVERSITY OF SOUTH AFRICA
SUPERVISOR: PROF. OA AKANBI
i
DECLARATION
Student number: 49012347
I declare that “A SMALL MACRO-ECONOMETRIC MODEL FOR NAMIBIA EMPHASISING THE DYNAMIC MODELLING OF THE WAGE-PRICE,
PRODUCTIVITY AND UNEMPLOYMENT RELATIONSHIP” is my own work
and that all the sources that I have used or quoted have been indicated and acknowledged by means of complete references.
ii
ABSTRACT
The contribution of this thesis is to build a small macro-econometric model of the Namibian economy, which demonstrates that there is significant statistical support for the hypothesis that there is a contemporaneous relationship between real wage, productivity, unemployment and interest rates in Namibia. This phenomenon has not yet been exploited using macro-econometric modelling, and thus, represents a significant contribution to modelling literature in Namibia. The determination of the sources of unemployment also receives special attention given that high unemployment is a chronic problem in Namibia. All models specified and estimated in the study use the SVAR methodology for the period 1980 to 2013. The study develops a small macro-econometric model using three modular experiments, which include, a basic model, models that separately append demand and exchange rate channels variables to the basic model, and the specification of a small macro-econometric model. The ultimate aim is to find out if monetary policy plays a role in influencing labour market and nominal variables. The hypothesis that the basic real wage, productivity, unemployment rate and interest rate system can be estimated simultaneously is validated. Further, demand and exchange rate channels variables are found to have important additional information, which explains the monetary transmission process, and that shocks to labour market variables affect monetary policy in Namibia. The results also show that the demand channel (import prices and bank credit to the private sector) and the exchange rate channel (nominal exchange rate) variables have important additional information, which affects monetary transmission process in Namibia, which justifies their inclusion in the small macro-econometric model. In addition, shocks to the import price and exchange rate in the macro-econometric model significantly affect labour market variables. However, shocks to bank credit only partially perform as expected, implying that its results need to be considered cautiously. The study further finds that tight monetary policy shocks significantly affect real and nominal variables in Namibia. The results also show that shocks to all variables in the unemployment model significantly affect unemployment, suggesting that the hysteresis assumption is corroborated. This implies that long run aggregate demand is non-neutral in Namibia.
iii
KEYWORDS
Real Wages, Prices, Unemployment, Productivity, Import Prices, Exchange Rates, Interest Rates, Monetary Policy Reaction Function, Structural Vector Autoregression, Variance Decomposition, Impulse Response Functions, Namibia.
iv
DEDICATION
I dedicate this work to my beloved wife, Ketiya Cathrine Sunde and our adorable children, Leo, Lynn and Liberty.
v
ACKNOWLEDGEMENTS
I would like to express my sincere indebtedness to the following:
The Lord Almighty, for providing me with the strength and determination to be able to complete this study.
My supervisor, Prof. OA Akanbi, for his guidance, support, encouragement and infinite patience throughout my studies.
UNISA Student Funding, for awarding me the UNISA Doctoral Study Bursary.
Dr. RT Chifamba, for the help he rendered by explaining to me how the Structural Vector Autoregression Method works.
Mr. Kofi Boamah for understanding and giving me the valuable time to work on my thesis.
My employer, Namibia University of Science and Technology (NUST), for all the support provided.
My family and friends for their support and patience.
My late parents Mr Simon Wasarirevhu Sunde and Mrs Elise Makwiramiti Sunde for the love and solid foundation they gave me in life.
Input from editors and reviewers of the internationally recognised journals that have reviewed and published or accepted for publication articles emanating from this thesis. These journals include:
o International Journal of Sustainable Economy (IJSE), o Journal of Economic and Social Thought (JEST), and o African Journal of Economic Review (AJER).
All those who have assisted and supported me in one way or the other during my studies. Without the support, encouragement and guidance of all the above-mentioned, this thesis would never have become a reality.
Despite the support and contributions of the above-mentioned institutions, individuals and journals, I take complete responsibility for all the viewpoints and any shortcomings of this thesis. All the inaccuracies and attendant omissions are exclusively ascribed to me and should not be attributed to any of the above-mentioned institutions, individuals or journals.
TABLE OF CONTENTS DECLARATION ... i ABSTRACT ... ii KEYWORDS ... iii DEDICATION ... iv ACKNOWLEDGEMENTS ... v TABLE OF CONTENTS ... vi LIST OF TABLES ... xi
LIST OF FIGURES ... xii
ACRONYMS ... xiii
CHAPTER 1 ... 1
INTRODUCTION AND BACKGROUND ... 1
1.1 INTRODUCTION ... 1
1.2 PROBLEM STATEMENT ... 5
1.3 the Objectives of THE STUDY ... 6
1.3.1 The specific objectives of the study ... 7
1.4 HYPOTHESeS OF THE STUDY ... 8
1.5 JUSTIFICATION OF THE STUDY ... 8
1.6 Methodology ... 9
1.7 Outline of the study ... 9
CHAPTER 2 ... 12
ECONOMIC AND LABOUR MARKET PERFORMANCE OF NAMIBIA ... 12
2.1 Introduction ... 12
2.2 OVERVIEW OF THE ECONOMY OF NAMIBIA ... 13
2.2.1 Macroeconomic framework for Namibia ... 13
2.2.2 An analysis of the key macroeconomic indicators... 14
2.2.3 Comparison of Namibia’s growth with other regions and countries ... 18
2.2.4 Comparison of Namibia’s fiscal balances with other regions and countries ... 19
2.2.5 Supply Side Developments ... 21
2.2.6 Demand Side Developments ... 23
2.2.7 Fiscal developments ... 26
vii
2.2.8.1 Monetary policy in Namibia ... 30
2.2.9 The external position of the economy ... 31
2.3 THE NAMIBIAN LABOUR MARKET ... 33
2.3.1 Unemployment in Namibia ... 34
2.3.2 Types of Unemployment ... 35
2.3.4 Basic indicators of the labour market since 1993 ... 39
2.3.5 Namibia’s labour market performance compared to SACU countries ... 43
2.4 THE INFLATIONARY ENVIRONMMENT IN NAMIBIA ... 49
2.4.1 Namibia’s inflation performance ... 50
2.4.2 The wages and Namibia’s economy ... 52
2.5 CONCLUDING REMARKS ... 55
CHAPTER 3 ... 59
MACROECONOMIC FOUNDATIONS AND LITERATURE REVIEW ... 59
3.1 Introduction ... 59
3.2 Theoretical foundations of the wage-price models ... 60
3.2.1 The Philips curve ... 60
3.2.2 The new Keynesian Phillips curve ... 62
3.2.3 The monetarist revolution ... 65
3.2.4 Keynesian response to the monetarist challenge ... 69
3.2.5 Keynesian model of inflation with a vertical Phillips curve ... 70
3.2.6 Unemployment and hysteresis effects ... 74
3.2.7 Unemployment and macro policy coordination ... 76
3.3 THE WAGE-PRICE EMPIRICAL LITERATURE REVIEW ... 77
3.3.1 A short background to macroeconometric modelling ... 77
3.3.2 Alternative research strategies in macroeconometrics ... 79
3.3.3 Literature analysis of the wage-price relationship ... 81
3.3.4 Justification for the extension of the wage-price model ... 90
3.3.5 The simultaneous wage-price-productivity-unemployment model specification ... ... 91
3.3.6 Unemployment literature analysis ... 107
3.3.7 Critical analysis of related literature from Namibia... 110
viii
CHAPTER 4 ... 118
THEORETICAL FRAMEWORK, METHODOLOGY AND DATA ANALYSIS ... 118
4.1 Introduction ... 118
4.2 wage-price models in imperfect competition ... 120
4.2.1 The new Keynesian wage-price model ... 120
4.2.2 The competing-claims model of a unionised economy ... 126
4.2.3 The efficiency wage model of productivity, unemployment and wages ... 134
4.2.4 The wage-price model in an open economy ... 137
4.3 THE STRUCTURAL VECTOR AUTOREGRESSION METHODOLOGY ... ... 142
4.3.1 Types of VARs ... 143
4.3.2 Modelling the relationship between VAR and the SVAR ... 145
4.4 The SVAR model ... 149
4.4.1 Introduction to vector auto regression (VAR) ... 149
4.4.2 Reduced form VAR ... 149
4.4.3 Short- run restrictions SVAR model ... 150
4.4.4 Long run SVAR Model ... 155
4.4.5 Impulse response functions (IRF) ... 155
4.4.6 Forecast error variance decomposition (FEVD) ... 157
4.4.7 Assessment of SVARs ... 158
4.5 IMPORTANT ISSUES IN ECONOMETRIC ESTIMATION ... 160
4.5.1 Unit Root Test ... 160
4.5.2 Lag Length Selection ... 161
4.5.3 Johansen Cointegration Approach ... 162
4.6 DATA DESCRIPTION AND ANALYSIS ... 164
4.6.1 Sources of the data and the variables ... 164
4.6.2 Descriptions and derivations of variables ... 165
5.6.3 Comments on interpolation and extrapolation methods applied ... 168
ix
CHAPTER 5 ... 173
THE SOURCES OF UNEMPLOYMENT FLUCTUATIONS ... 173
5.1 Introduction ... 173
5.2 Unemployment in Namibia ... 174
5.3 Unemployment brief Literature ... 176
5.4 The unemployment model for Namibia ... 177
5.4.1 The model ... 178
5.4.2 Identification of structural shocks ... 182
5.4.3 Non-stationarity and cointegration ... 183
5.5 Data and Estimation Results ... 188
5.5.1 Impulse-response functions and variance decomposition ... 188
CHAPTER 6 ... 196
THE SMALL MACRO-ECONOMETRIC MODEL FOR NAMIBIA ... 196
6.1 Introduction ... 196
6.2 THE SMALL MACRECONOMETRIC MODEL FOR NAMIBIA ... 198
6.2.2 Analysis technique ... 204
6.2.3 Properties of the Variables ... 205
6.3 ESTIMATION AND ANALYSIS OF RESULTS ... 207
6.3.1 The basic model ... 207
6.3.1.1 Impulse response functions of the basic model ... 209
6.3.1.2 Variance decomposition of the basic model ... 214
6.3.2 Possible channels of monetary transmission in the macro-econometric model 217 6.3.2.1 The demand channel model using import prices ... 217
6.3.2.2 The demand channel using the bank credit model ... 220
6.3.2.3 The exchange rate channel model ... 223
6.4.1 The small maroeconometric model for Namibia ... 226
6.4.1.1 Impulse response functions for the macro-econometric model ... 227
6.4.1.2 Variance decompositions for the macro-econometric model ... 232
6.5 Validating the robustness of the models ... 235
x
CHAPTER 7 ... 239
CONCLUSION, POLICY IMPLICATIONS AND FUTURE RESEARCH ... 239
7.1 Introduction ... 239
7.2 Summary of the study ... 239
7.3 Summary of empirical findings ... 242
7.3.1 The sources of unemployment model ... 242
7.3.2 The small macro-econometric model... 243
7.4 Conclusions and Policy implications ... 245
7.4.1 The sources of unemployment model ... 245
7.4.2 The small macro-econometric model... 247
7.5 Limitations of the study and areas of future research ... 249
REFERENCES ... 251
APPENDIX A: GENERAL APPENDICES ... 269
APPENDIX B: APPENDIX TO CHAPTER 5 ... 281
xi
LIST OF TABLES
Table 2-1: Selected Macroeconomic Indicators (Percentages) ... 15
Table 2-2: Real GDP growth (percentage) - global ... 18
Table 2-3: Global fiscal balances and budget deficits for selected economies as a percentage of GDP ... 20
Table 2-4: Value added by major production sectors as a percentage of GDP ... 21
Table 2-5: Aggregate demand components (million USD, 2005=100) ... 23
Table 2-6: Monetary aggregates (million Namibian dollars) and related statistics (%) ... 30
Table 2-7: Major balance of payments aggregates (N$ million)... 33
Table 2-8: Basic labour market indicators from labour force surveys ... 40
Table 2-9: Labour force, employment and unemployment ... 41
Table A 1: Data definitions and sources ... 269
Table A 2: Variable statistics ... 274
Table A 3: ADF and the PP non-stationarity tests in levels 1990 - 2013 ... 277
Table A 4: ADF and the PP non-stationarity tests in first differences 1990 - 2013 ... 278
Table B 1: Structural estimates of the A and C matrices of the unemployment model ... 281
Table B 2: Roots of characteristic polynomial of the unemployment model ... 283
Table B 3: VAR residual serial correlation tests of unemployment ... 284
Table C 1: Structural VAR estimates for the basic model ... 286
Table C 2: VAR lag exclusion Wald tests for the basic model ... 287
Table C 3: Roots of characteristic polynomial for the basic model ... 288
Table C 4: VAR residual serial correlation LM tests for the basic model ... 290
Table C 5: Structural VAR estimates for the small macro-econometric model ... 292
Table C 6: Roots of characteristic polynomial for the composite macro-econometric model.. 294
Table C 7: VAR residual serial correlation LM tests for the macro-econometric model ... 296
xii
LIST OF FIGURES
Figure 1-1: A stylised illustration of the complete macroeconomic model ... 7
Figure 2-2: Percentage growth Rates of Selected Macroeconomic Indicators ... 17
Figure 2-3: Value added by major production sectors as a percentage of GDP ... 22
Figure 2-4: Aggregate demand components (million USD, 2005=100) ... 25
Figure 2-5: Government revenue, government expenditure and the budget balance (in millions of Namibian dollars) ... 26
Figure 2-6: Budget balance in millions of Namibian dollars ... 27
Figure 2-7: Summary of major accounts of the Balance of Payments (million N$) ... 32
Figure 2-8: Unemployment rates for Namibia ... 35
Figure 2-9: Unemployment rates for SACU countries ... 45
Figure 2-10: SACU countries average unemployment rates for the period 1990-2013 ... 45
Figure 2-11: SACU countries employment growth rates ... 47
Figure 2-12: SACU countries' average employment growth for the period 1990-2013 ... 47
Figure 2-13: SACU countries average labour force growth rates: 1990-2013 ... 49
Figure A1: A stylised illustration of the complete macro-econometric model ... 272
Figure A2: Regional map of Namibia ... 273
Figure A 3: Trend diagrams of the variables ... 275
Figure A 4: First differences of the data used in the estimations ... 276
Figure A 5: Macro-econometric reduced form VAR equations: parameter stability tests ... 279
Figure B 1: Evolution of other variables against unemployment in the unemployment model 281 Figure B 2: Accumulated impulse responses for the unemployment model ... 285
Figure C 1: Inverse roots of AR characteristics polynomial ... 289
Figure C 2: Evolution of macro-econometric variables against the monetary policy variable . 291 Figure C 3: Inverse roots of AR characteristics polynomial for macro-econometric model .... 295
Figure C 4: Impulse responses for the small macro-econometric model ... 298
xiii
ACRONYMS
2SLS Two Stage Least Squares
ADF Augmented Dickey Fuller Test
ADL Autoregressive Distributed Lag
AIC Akaike Information Criterion
BC Bargaining Centralisation
BoN Bank of Namibia
BoP Balance of Payments
BRICS Brazil Russia India China and South Africa
CGE Computable General Equilibrium
CMA Common Monetary Area
CRS Constant Returns to Scale
CUTT Customs Union Task Team
EA Euro Area
ECHP European Community Household Panel
ECM Error Correction Model
EPL Employment Protection Legislation
FEVD Forecast Error Variance Decomposition FGSL Feasible Generalised Least Squares FIML Full Information Maximum Likelihood
GDP Gross Domestic Product
GMM Generalised Method of Moments
GoN Government of Namibia
HQ Hannan-Quinn Information Criterion
IMF International Monetary Fund
IRF Impulse Response Function
LDCs Less Developed Countries
LMIs Labour Market Institutions
MDGs Millennium Development Goals
MEMWOG Macroeconomic Modelling Working Group
xiv
MoF Ministry of Finance
MTEF Medium Term Expenditure Framework
NAIRU Non-accelerating Inflation Rate of Unemployment
NAMAF Namibian Macroeconomic Framework
NAMEX Namibia Macroeconometrics Model
NAMMAC Namibia Macroeconomic Model
NDP National Development Plan
NHIES National Housing Income and Expenditure Survey
NKPC New Keynesian Phillips Curve
NLFS Namibia Labour Force Surveys
NPC National Planning Commission
NSA Namibia Statistical Agency
NSX Namibia Stock Exchange
NUNW National Union of Namibian Workers
OECD Organisation for Economic Co-operation and Development
OLS Ordinary Least Squares
PC Phillips Curve
PER Public Expenditure Review
PP Philips Peron
RBSA Reserve Bank of South Africa
RMA Rand Monetary Area
RMSM-X Revised Standard Model-Extended
SACU Southern African Customs Union
SIC Schwarz Information Criterion
SVAR Structural Vector Autoregression
SVECM Structural Vector Error Correction Model SWAPO South West Africa Peoples' Organization
TIPEEG Targeted Intervention Programme for Employment and Economic Growth
UK United Kingdom
xv
USD United States Dollar
VAR Vector Auto regression
VECM Vector Error Correction Model
VEqCM Vector Equilibrium Correction Model
WASCOM Wages and Salary Commission
WB World Bank
1
CHAPTER 1
INTRODUCTION AND BACKGROUND
1.1 INTRODUCTION
Macroeconometric modelling has proved to be a significant component of the economics field and it has generated considerable debate for many years among macroeconomists, but with little consensus. To date, debate about the specification of the best macroeconometric model and the variables to include in it still rages on. Worse still, very little research on the small macroeconometric models incorporates the labour market variables. Although literature on macroeconometric modelling is growing (Wallis, 1993; Andrews et al., 1985; Gottschalk, 2005; Nymoen, 2008; Dufour et al., 2009; Uribe and Schmitt-Grohé, 2012; Garratt, Lee, Pesaran., & Shin, 2012) there is still no standard way to specify a macroeconometric model. However, the empirical potential of macroeconometric modelling to explain the real economy has done a lot over the years to assist economic modellers and policy makers in their decision-making processes (Nymoen, 2008). The value of macroeconometric modelling in formulating sound macroeconometric policies should not be overemphasised. Such models primarily reflect the main characteristics and structural inadequacies of an economy. Additionally, macroeconometric modelling is an imperative and extremely useful instrument, which helps in analysing the structure of the economy, making future forecasts of the economy’s macroeconomic indicators and analysing policy scenario impacts on the economy.
In many developing countries, it is complex to develop macroeconometric models that give robust results because the data may be inadequate and of poor quality. Implicitly, to be able to develop a macroeconometric model that produces reliable results that can be used for forecasting and policy analysis purposes, a reliable statistical database is required.
2
The starting point in developing a wage, price, productivity and unemployment macroeconometric model is the wage-price relationship. Previous studies concentrated on analysing the wage-price relationship and its feedback variables simultaneously. The study by Mchugh (2004) established that a simultaneous relationship also exists between wage, price, productivity and unemployment and this is corroborated by other authors such as Marcellino and Mizon (2000), Marcellino and Mizon (2001) Nymoen (1991) and Tsoukis et al. (2011). It is noteworthy that numerous studies were carried out on the macroeconometric relationship between wages and prices in the developed countries, very few studies were conducted in developing countries using various methodologies. Most of these studies specified and estimated wages and prices separately, thereby treating them as if they were not contemporaneously related. Of late, a few scholars have estimated the contemporaneous relationship between wages and prices for advanced economies and they all concluded that such a relationship exists between the two variables for all the countries studied. In addition, the existence of wage and price rigidities is widely recognised as a crucial issue for macroeconometrics and notably for monetary policy. Theory has reaffirmed the importance of price and wage rigidities for the evolution of the macroeconomy in response to shocks and, on the empirical domain, there is now a bulk of evidence on the existence of price and wage rigidities at the firm level (Bårdsen et al., 2007). In addition, the existence of price and nominal wage rigidities is expected to translate into persistent responses of wages and prices to shocks hitting the economy. It is also noteworthy that there are many studies in developed countries that studied the relationships between wage, price and unemployment; wage, price, and productivity; unemployment, productivity and wages, but there are very few studies that studied the simultaneous relationship between wages-price, productivity and unemployment under the macroeconometric setting using the structural vector autoregression (SVAR) methodology.1
The proposed approach has not yet been exploited in macroeconometric modelling in Namibia and therefore, represents a significant contribution to modelling and
1 Some of the studies that studied a relationship close to the current study include Baffoe-Bonnie and
Gyapong (2012), Forslund et al. (2008), Annicchiarico and Pelloni (2013), Andrew et al. (1990), Linzert (2001), Brüggemann (2006), Marcellino and Mizon (1999), and Arango et al. (2003).
3
macroeconometric literature in Namibia. This study follows a recent trend in other open economies such as Ghana, Portugal, Iceland, United States of America (USA), United Kingdom (UK), Norway and Australia, in which the behaviour of wage and price inflation is estimated in a simultaneous equation system. The current study differs from the majority of the previous studies in that it uses a different methodology (the structural vector auto regression (SVAR)) which allows for the study of downstream effects when there are shocks to the key variables in the model. In addition, the current study also differs from the traditional wage-price model, in that, instead of concentrating on the wage-price relationship it expands this relationship to wage-price, productivity and unemployment and then considers the feedback variables to this expanded relationship. In other words, this implies that in order to capture the behaviour of the foremost variables that drive the wage-price, productivity and unemployment model in Namibia, a complete model that incorporates important transmission channels needs to be constructed. In order to close the model, the study incorporates a monetary policy reaction function in the small macroeconometric model. This is not surprising because monetary policy plays a crucial role in the management of the economy. As outlined in the Bank of Namibia Act 15 of 1997, one of the principal objectives of the Bank of Namibia is to influence credit availability, interest rates, money supply and exchange rates in a bid to promote economic growth, employment (reduce unemployment), price and wage stability ultimately. The achievement of this objective obviously requires an understanding of the process through which monetary policy affects economic activity. It is against this backdrop that monetary policy, particularly interest rates, plays an important role in the development of the small macroeconometric model in the current thesis. There is no macroeconometric study in Namibia that has analysed the simultaneous relationship between wage, price, productivity and unemployment. The current study, therefore, contributes to macroeconometric literature in Namibia by filling this gap. Moreover, the study isolates monetary policy autonomous disturbances from other shocks, quantifies their dynamic behaviours and measures the consequent macroeconomic implications using an SVAR model with short run restrictions.
4
The macroeconometric model of the Namibian economy developed in this thesis was originally developed using three SVAR modular experiments and it borrows ideas from studies by Watzka (2006), Disyatat and Vongsinsirikul (2003) and Ngalawa and Viegi (2011). First, the study estimates a basic model comprising the country’s real wage, productivity, unemployment and interest rate relationship. The essence of this basic model that incorporates the interest rate into the key variables of the study is to establish which labour market variables are affected by monetary policy (Watzka, 2006).
At the second level of analysis, the study separately appends demand and exchange rate channel variables to the basic model and estimate the resultant model. If the shocks to the appended variables are important in explaining the variables in the basic model, incorporate them in the small macroeconometric model. Additionally, two sets of impulse responses are estimated in each case: one with the variable of interest calculated endogenously, while the other calculates the variable of interest exogenously (Disyatat and Vongsinsirikul, 2003; Morsink and Bayoumi, 2001; Ngalawa and Viegi, 2011). The latter procedure generates an SVAR comparable to the former even though it blocks off any responses within the SVAR that pass through the variable of interest (Disyatat and Vongsinsirikul, 2003). The next stage in the second modular experiment is to compare the two sets of impulse responses. Therefore, the size differences in the impulse responses are an indicator of the level of additional information contained in the series of interest, which explains a particular transmission channel. Large differences indicate that there is more information in the variable of interest and suggest that the related transmission channel is of great importance. In particular, the current study investigates the level of additional information contained in the individual series of interest, which explain the monetary transmission channel.
At the third and final level of analysis, the researcher pools all variables found to have important additional information in explaining the country’s monetary transmission process and append them to the basic model to create a composite SVAR, which the study labels the small macroeconometric model. The ultimate aim of the study is to find out if monetary policy has a role to play in influencing labour market variables. This
5
implies that only a short run analysis of the study conforms to the subject matter under examination. There is, therefore, little value in extending the study of the monetary transmission process to cover the long run since economists generally agree that monetary policy affects only the price level in the long-run and not the other variables (Disyatat and Vongsinsirikul, 2003).
The research also attempts to give prominence to the problem of unemployment by studying the sources of Namibian unemployment since Namibia has a high unemployment rate. Knowledge of the sources of unemployment in Namibia helps as far as the recommendations of the solutions to the problem is concerned. The sources of unemployment are analysed by using the long run SVAR methodology, which has been used by other previous researchers who studied similar topics in other countries (see Dolado and Jimeno, 1997; Linzert, 2001; Maidorn, 2003; Brüggemann, 2006; Baffoe-Bonnie and Gyapong, 2012).
1.2 PROBLEM STATEMENT
Since independence, the economy of Namibia has performed moderately well, growing at an approximate average rate of four (4) per cent per annum. However, the unemployment rate and poverty levels have remained high while the inflation rate advanced at a manageable average rate of 6.1 per cent. The unemployment problem can mainly be attributed to low productivity, growth in capital-intensive sectors of the economy, especially, the mining sector, low rate of new business start-ups and high cost of capital. It has been argued that sound economic policy is the remedy to these problems that bedevil the Namibian economy. Hence, the necessity of policy transformation and realignment need not be overemphasised.
It can be argued that there is a need to develop appropriate sectoral policy frameworks that can serve as reference points in the determination of whether the economy is in the right track or going astray so that corrective measures can be adopted to address policy issues pertinent to problems the Namibian economy faces. It is also vital that policy makers have a clear understanding of the interrelationships between policy instruments and targets so that they are able to choose the correct policy variables to achieve their
6
objectives. In addition, it is also necessary for policy makers to be able to assess the degree to which policy variables influence the ultimate targets. The understanding of such transmission mechanisms proves essential when it comes to dealing with the potential policy spill over effects. Specifically, it is essential for Namibia to know the relationship between the labour market variables, and the monetary transmission process since this clearly spells out the relationship between the labour market and monetary policy.
Macroeconometric modelling has always provided answers to policy makers and other interested parties and stakeholders. Despite the fact that econometric modelling was heavily criticised in the past, it has proven handy as far as policy formulation and analysis is concerned. Since the early econometric models that are heavily criticised, econometric modelling has gone through some revolutionary transformations in terms of its theory and computational techniques (Jacobs and Wallis, 2005; Matlanyane, 2005).
1.3 THE OBJECTIVES OF THE STUDY
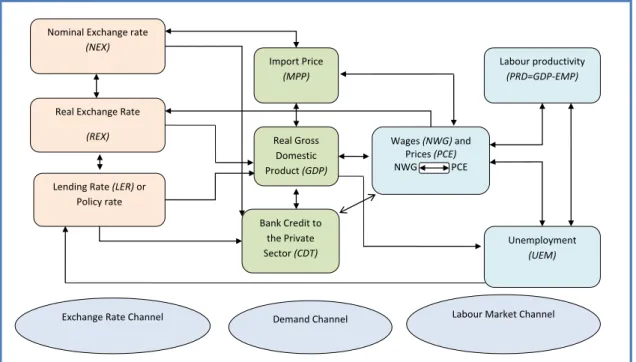
The main objective of this thesis is to construct a small structural macroeconometric model for Namibia with particular emphasis on the simultaneous relationship between real wages (wage-price), productivity, unemployment. The basic model constructed includes the interest rate (a monetary variable) which is used to test if the demand and exchange rate channel variables have important additional information that affects the monetary transmission process in Namibia. Special emphasis is placed on analysing the sources of unemployment in Namibia, since Namibia has the highest average unemployment rates among all the countries in SACU and yet it was designated a middle-income developing country in 2009. Figure 1-1, is a stylised representation of the macro-econometric model that the study attempts to develop in this thesis.
Figure 1-1, enlarged in Figure A1 in Appendix A, evidently illustrates the possible interaction of wages, prices, productivity and unemployment, and, the additional feedback variables that determine their behaviour. It is against the backdrop of this schematic depiction of the model, that the study comes up with seven objectives
7
explained below. Chapter 3 of the thesis gives the justification of the simultaneous modelling and estimation of the wage-price, productivity and unemployment model both theoretically and empirically.
Figure 1-1: A stylised illustration of the complete macroeconomic model
Adaptation from McHugh (2004)
1.3.1 The specific objectives of the study
The specific objectives of the study are:
(i) To review the macroeconomic environment and provide an overview of the labour market in Namibia for the period 1980 to 2013.
(ii) To determine the sources of unemployment in Namibia using the SVAR methodology.
(iii) To empirically test the impact of shocks in the basic real wage, productivity, unemployment and interest rates model.
(iv) To analyse empirically the dynamic effects of demand shocks on the monetary policy transmission process.
(v) To specify, estimate and evaluate the macro-econometric model with a lending rate reaction function.
(vi) To proffer some policy recommendation based on obtained results. Wages (NWG) and Prices (PCE) NWG PCE Labour productivity (PRD=GDP-EMP) Unemployment (UEM) Import Price (MPP) Real Gross Domestic Product (GDP) Bank Credit to the Private Sector (CDT)
Nominal Exchange rate
(NEX)
Real Exchange Rate
(REX)
Lending Rate (LER) or Policy rate
8
1.4 HYPOTHESES OF THE STUDY
The hypotheses tested in this study are as follows:
(i) There is a contemporaneous relationship between real wage, productivity and unemployment in Namibia.
(ii) Shocks to technology, real wage, price, labour demand and labour supply affect unemployment in Namibia.
(iii) The demand channel variables significantly affect monetary policy in Namibia. (iv) Shocks to lending rates affect both labour market and other macroeconomic
variables in Namibia.
1.5 JUSTIFICATION OF THE STUDY
The Namibia Macroeconometric Model (NAMEX) developed in 2004 is the first and only comprehensive macroeconometric model ever developed in Namibia. This model suffered from severe data deficiency problems that are minimal as far as the current study is concerned. The serious shortcomings of NAMEX (explained in Chapter 3) motivated the researcher to develop the current small macroeconometric model that shows the interaction of some key labour market and monetary variables in an open economy framework. Additionally, the high unemployment rate in Namibia also requires investigation and analysis to proffer possible solutions to resolve the problem.
The 2004 study by Tjipe et al. (2004) used annual data covering the period 1990 to 2004. However, the current study uses annual data for the period, 1980 to 2013 that gives 33 observations, and hence increases the number of observations and possibly improve the quality of the results. In addition, the current study makes use of the structural vector auto regression (SVAR) model, while Tjipe et al. (2004) used Engle Granger two-step econometric procedure. The Engle Granger two-step procedure is also the same methodology, which was used by Eita and Ashipala (2010) who studied the determinants of unemployment in Namibia, for the period 1970 to 2007.
The current study is also the first study that attempts to develop the small macroeconometric model for Namibia giving special emphasis to the labour market variables. Most of the studies that were carried out on similar topics were conducted in
9
developed countries, and these include Nymoen (1991), Bardsen et al. (2003), Maidorn (2003), Bårdsen et al. (2007), Zumer (2004) and Brüggemann (2006). Some of the few studies on African countries include Wakeford (2004), Baffoe-Bonnie and Gyapong (2012), Ojapinwa and Esan (2013) and Van Zyl (2010). The majority of these studies from both the developed and developing countries made use of cointegration and error correction modelling technique, and only a few of them used the SVAR procedure. It is against this background that the current study makes use of the SVAR methodology. The next section of the chapter discusses the objectives of the study.
1.6 METHODOLOGY
Secondary data are collected for all the variables of interest in this study, and structural vector auto regression (SVAR) methodology is used to estimate the macroeconometric model for the Namibian economy for the period 1980 to 2013. Important issues discussed relating to this methodology, include the stationarity tests, cointegration tests, determination of the optimal lag length, impulse response functions (IRF), variance decomposition and robustness checks.
1.7 OUTLINE OF THE STUDY
Chapter 2 gives an overview of the macroeconomic performance of the Namibian economy, paying particular attention to the performance of the labour market variables that are used in this study. A general analysis of the macroeconomic performance gives deeper understandings of the relationships among the variables that are used in the models developed in this study. The study, therefore, provides a detailed discussion on the performance of the Namibian economy, highlighting some of the challenges that it currently faces. This discussion is done within the economic policy frameworks that the economy has followed. The chapter also analyses the behaviour of the key variables used in the study by using tables of figures and trend diagrams.
Chapter 3 discussions cover both theoretical and empirical literature related to the current study. The chapter discusses the theories related to the basic wage-price model. Some of the theories that are reviewed are the imperfect competition theory of wages and prices, the Phillips curve model, the new Keynesian Phillips curve model, the
10
monetarist revolution and the Keynesian response. Empirical research on both developed and developing nations are reviewed and analysed.
Chapter 4 discusses the methodological issues of the study. The chapter systematically clarifies the methodology applied in this study. The issues covered and discussed in the chapter include the stationarity tests, cointegration tests, SVAR modelling, determination of the optimal lag length, impulse response functions (IRF) and variance decomposition.
Chapter 5 gives an empirical analysis of the sources of unemployment in Namibia. In order to do this, the study uses the structural VAR methodology. The structural VAR is particularly suited to account unequivocally for the contemporaneous interactions among the variables. However, unlike the traditional VAR framework, the corresponding structural VAR gives a specific behavioural interpretation of the dynamics of the system. Therefore, the SVAR allows the examination of how particular macroeconomic shocks are transmitted in the economy.
Chapter 6, which develops the small macroeconometric model, commences by specifying and estimating the basic model, which contains real wages (nominal wages minus prices) productivity, unemployment and interest rates. It is to be noted that interest rates are included in the basic model by virtue of the fact that they directly and indirectly affect demand, exchange rate and monetary channel variables. In addition, that such a model permits the assessment of whether these channels contain additional information, which is important in monetary policy transmission. To test the latter, demand and exchange rate channel variables are appended to the basic model separately and then shocks to monetary policy in these models are analysed under two conditions where, first, the appended variable is treated as endogenous and second, where the appended variable, is exogenous. In the final analysis, the variables that are found to contain important additional information in the monetary transmission process are then appended to the basic model to develop the small macroeconometric model for Namibia.
11
Chapter 7 presents the concluding remarks of the study. Firstly, the chapter commences by giving a summary of the study. Secondly, the chapter gives a summary of the empirical findings. Thirdly, the chapter presents a discussion of the conclusions and policy implications. Lastly, a brief explanation of the limitations of the study and areas of future research is given.
12
CHAPTER 2
ECONOMIC AND LABOUR MARKET PERFORMANCE OF
NAMIBIA
2.1 INTRODUCTION
The principal aim of this chapter is to provide the background to the Namibian economy with a view to highlighting the key characteristics of the state of the economic system and the policy developments over the period 1980-2013. Additionally, the two chief issues the current chapter is concerned with are the macroeconomic environment and performance of the Namibian labour market. The current chapter, therefore, offers an overview of the macroeconomic performance indicators of the Namibian economy, paying special attention to the functioning of the labour market indicators that are central to the current study. A general analysis of the macroeconomic performance gives a deeper understanding of the relationships among the variables that are used in the models developed later in the study. The study, therefore, provides a detailed discussion of the performance of the Namibian economy, highlighting some of the key challenges that it currently faces. This discourse is presented within the economic policy frameworks that the economy has been following. The chapter also analyses the inflationary environment in Namibia since it plays a very important function in a wage-price-productivity-unemployment relationship, which is the basic relationship used in the current research. The analysis provided in this chapter is primarily based on the Annual reports of the Bank of Namibia (BoN), Reports of the Government of Namibia (GoN), Ministry of Finance (MoF), Labour Force Surveys, World Bank (WB) Reports for Namibia and the National Statistics Agency (NSA) reports.
Given this brief background, the purpose of this chapter is threefold: (i) to critically evaluate the macroeconomic performance of Namibia. (ii) to assess the performance of the Namibian labour market.
13
(iii) to discuss the inflationary environment in Namibia, since it is fundamental to the basic relationship, which forms the basis of the current study.
2.2 OVERVIEW OF THE ECONOMY OF NAMIBIA
2.2.1 Macroeconomic framework for Namibia
To understand the development trajectory for Namibia, it is necessary to understand the various macroeconomic frameworks that Namibia has been following since independence in 1990. According to the National Planning Commission, (2012) Namibia inherited a dual economy at independence, which had four interrelated challenges, namely: low economic growth, a high rate of poverty, inequitable distribution of income and high unemployment levels. The first attempt by the Namibian government in addressing these challenges was the adoption of the Transitional Development Plan in the first five years of independence. In 1995, the first National Development Plan (NDP 1) was developed and implemented, and it ran for five years up to the year 2000. The NDP 1 only focused on the following four objectives: to boost and sustain economic growth, to create employment, to reduce inequalities in income distribution and to reduce poverty (National Planning Commission, 2008, 2012; Malumo, 2012). Both the Transitional Development Plan and the NDP1 primarily focussed on the same challenges.
The third macroeconomic framework that was developed was the National Development Plan 2 (NDP 2) which ran from 2001 to 2006. Among the twenty-one goals that NDP 2 had, four were the same as those of the NDP 1 mentioned above. In addition, the third National Development Plan (NDP 3) was implemented between 2007 and 2011. Furthermore, the Fourth National Development Plan (NDP4) came into being in July 2012 and it is supposed to guide policies until 2016. It should be noted that the three overarching objectives of NDP4 are economic growth, increased income equality and job creation. NDP4 proposes to realise these objectives by utilising industrial policies, which stimulate growth in regional trade logistics, tourism, agriculture and manufacturing (National Planning Commission, 2012). The reduction of extreme poverty and improvements of health, education, business environment and infrastructure, are considered as basic enablers that support the above economic
14
priorities. NDP4 grants ten preferred results, each complemented by an indicator for determining achievement of the result, broad approaches anticipated to realise the result, and a ministry that will function as the supporter (National Planning Commission, 2012). This selectivity differentiates NDP4 from previous NDPs, whose agendas covered the entire public policy space. In addition, the issues that were targeted by the Transitional Development Plan also featured in all the national development plans (NDP 1, NDP 2, NDP 3 and NDP 4). These macroeconomic frameworks make up the short-term strategies that Namibia has been following. The reason for the same basic goals featured in all the macroeconomic frameworks that were implemented in Namibia, is that each framework has failed to resolve these issues completely. In some cases, the challenges escalated instead of abating. A good example of this is the unemployment rate, which increased to 37.6 per cent in 2008.
As far as the long-term development plans are concerned, Namibia is implementing two such plans, namely, Vision 2030 and the Millennium Development Goals (MDGs). Vision 2030 in Namibia is a long-term development agenda (framework) which outlines the aspirations and objectives of the people of Namibia. Issues central to Vision 2030 are the desire to increase living standards and improve quality of life for the whole population in Namibia. The other central issue that Vision 2030 wants to achieve is that it wants to ensure that Namibia becomes an industrialised nation by 2030. However, for Namibia to achieve this feat it is supposed to achieve a growth rate of 7 per cent per annum. This goal is also similar to what the Millennium Development Goals also aim to achieve.
2.2.2 An analysis of the key macroeconomic indicators
According to Sunde (2013: 53) “since the attainment of independence in 1990, the Namibian government has made great strides to grow the economy, which performed below its potential before independence due to the armed struggle and also the fact that Namibia was considered as an annex or province of South Africa." This demonstrates that, between 1980 and 1989, the average growth rate of Namibia was 3.3 per cent, and the average growth rate for the period 1990 to 2013 was 4.2 per cent, that is, a remarkable improvement from the pre-independence era. Sunde (2013: 53) further adds
15
that: “After independence in 1990, the government of Namibia made sure that certain economic structures that were not available before independence were developed, and these include a vibrant financial system (financial markets and intermediaries), the Namibia Stock Exchange (NSX), the Bank of Namibia (BoN) just to name but a few."
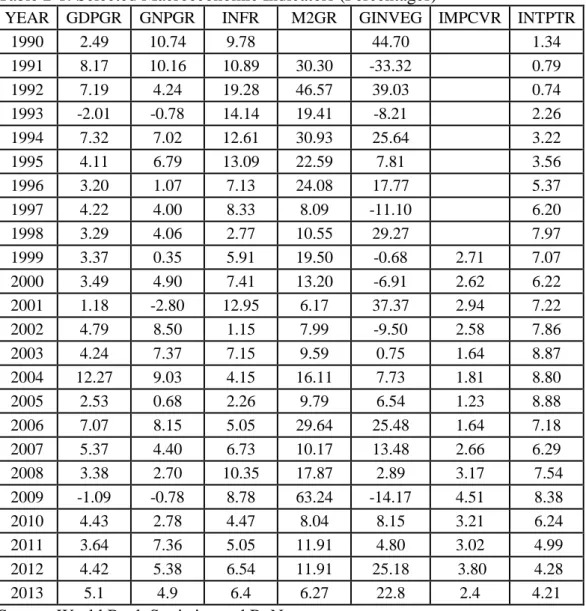
Table 2-1: Selected Macroeconomic Indicators (Percentages)
YEAR GDPGR GNPGR INFR M2GR GINVEG IMPCVR INTPTR
1990 2.49 10.74 9.78 44.70 1.34 1991 8.17 10.16 10.89 30.30 -33.32 0.79 1992 7.19 4.24 19.28 46.57 39.03 0.74 1993 -2.01 -0.78 14.14 19.41 -8.21 2.26 1994 7.32 7.02 12.61 30.93 25.64 3.22 1995 4.11 6.79 13.09 22.59 7.81 3.56 1996 3.20 1.07 7.13 24.08 17.77 5.37 1997 4.22 4.00 8.33 8.09 -11.10 6.20 1998 3.29 4.06 2.77 10.55 29.27 7.97 1999 3.37 0.35 5.91 19.50 -0.68 2.71 7.07 2000 3.49 4.90 7.41 13.20 -6.91 2.62 6.22 2001 1.18 -2.80 12.95 6.17 37.37 2.94 7.22 2002 4.79 8.50 1.15 7.99 -9.50 2.58 7.86 2003 4.24 7.37 7.15 9.59 0.75 1.64 8.87 2004 12.27 9.03 4.15 16.11 7.73 1.81 8.80 2005 2.53 0.68 2.26 9.79 6.54 1.23 8.88 2006 7.07 8.15 5.05 29.64 25.48 1.64 7.18 2007 5.37 4.40 6.73 10.17 13.48 2.66 6.29 2008 3.38 2.70 10.35 17.87 2.89 3.17 7.54 2009 -1.09 -0.78 8.78 63.24 -14.17 4.51 8.38 2010 4.43 2.78 4.47 8.04 8.15 3.21 6.24 2011 3.64 7.36 5.05 11.91 4.80 3.02 4.99 2012 4.42 5.38 6.54 11.91 25.18 3.80 4.28 2013 5.1 4.9 6.4 6.27 22.8 2.4 4.21
Source: World Bank Statistics and BoN where:
GDPGR Gross Domestic Product growth GNPGR Gross National Product growth INFR CPI inflation
M2GR Broad Money Supply growth GINVEG Government Investment Growth IMPCVR Import Cover
16
The economy of Namibia has experienced modest economic growth since independence. Before independence, there is virtually very little discussion about simply because the statistics for the majority of the key economic variables are non-existent. The data contained in Table 2-1 and Figure 2-1 indicates that the Namibian economy has been experiencing unstable macroeconomic conditions. The figures show that the average economic growth rate for Namibia is 4.4 per cent; and that the GNP average growth rate is 4.5 per cent. The data shows that the Namibian economy has a high and volatile GDP growth rate and an economic structure that is unable to diversify away from its historic patterns. The volatility and the composition of GDP growth rate could be implicated for the persistently high and mostly growing unemployment rate. Although the Namibian economy has been growing, its growth rates fall short of the growth rates required to become industrialised, as per its Vision 2030. It is noteworthy that Namibia has implemented various economic frameworks since independence as alluded to earlier, and these frameworks have brought significant changes to the structure of the economy. As mentioned earlier, the specific aims common to all the economic frameworks implemented are to boost and sustain economic growth, to create employment, to reduce inequalities in income distribution and to reduce poverty.
The inflation rate was high in the early 1990s, mainly due to a crippling 1992 drought, which affected the greater part of Southern Africa. After 1992, the interest rates steadily declined until they hit a low value of 2.8 per cent in 1998 after which they started escalating again. In 2001, the inflation rate escalated to 12.9 per cent due to another drought experienced in the year 2000/2001. After this drought, the inflation rate fell again until it reached an all-time low of 2.26 per cent in the year 2005. In the year 2008, the inflation rate reached another high of 10.35 per cent, and this was thanks to a combination of factors, namely: the escalating food and oil prices and the global economic crisis. The Bank of Namibia responded to this increase in inflation by consistently reducing the repo rate every quarter in 2009 right through to 2010. The repo rate was reduced from 9 per cent in 2009 to the current 5.5 per cent in 2010. This monetary policy stance can be argued to have helped quell the effects of the global economic crisis on the Namibian economy.
17
Money supply has consistently grown at a rate that is faster than the growth rate of GDP. Under normal circumstances, this is supposed to lead to an increase in prices since there is too much money chasing too few goods. However, the Namibia situation is peculiar in that the Namibian dollar is pegged to the South African Rand, and that the Namibian economy is minute when compared to the South African economy in terms of the Gross Domestic Product, trade, among other variables.
Figure 2-2: Percentage growth Rates of Selected Macroeconomic Indicators
-40 -20 0 20 40 60 80 1990 1995 2000 2005 2010 GDPGR GINVEG GNPGR
IMPCVR INFR INTPTR
M2GR
Source: World Bank Statistics
The implication is that the value of the Namibian dollar is only influenced by the value of the South African Rand and nothing else. Government investment growth is another variable that needs to be explained since it is important as far as infrastructure development is concerned. The average growth rate over the period 1990 to 2013 is 4.2 per cent and that is quite impressive. In addition, the imports cover for the period 2008 to 2011 whose data is shown in Table 2-1, is healthy which implies that Namibia was doing very well concerning the generation of foreign exchange during this period. In addition, the exchange rate for Namibia has also remained stable for the period under review, mainly due to the pegging of the Namibian dollar to the South African Rand.
18
2.2.3 Comparison of Namibia’s growth with other regions and countries
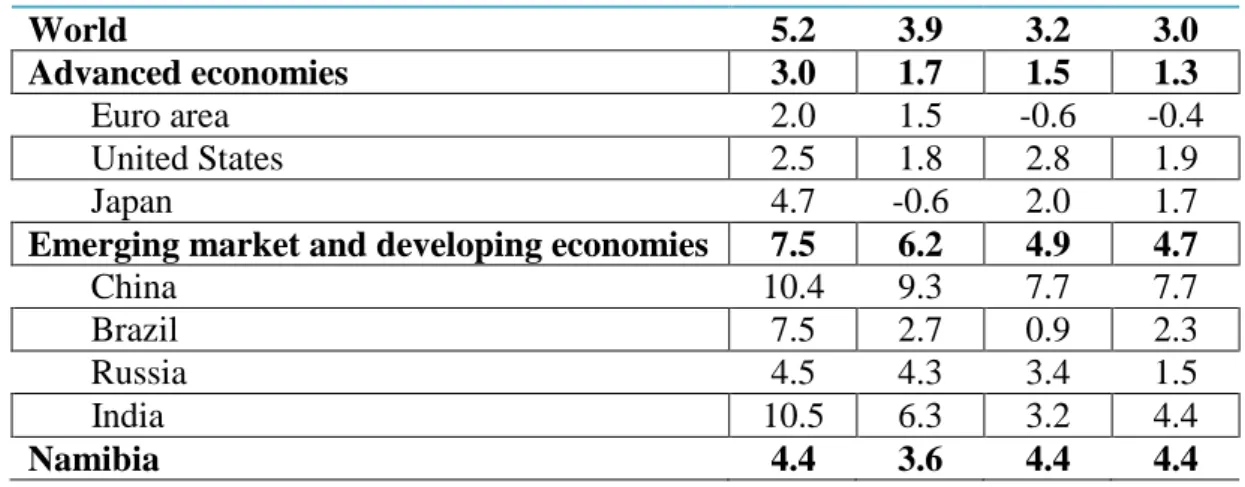
Table 2-2 indicates that world growth was 5.2 per cent in 2010 and in 2011, 2012 and 2013 it was 3.9, 3.2 and 3.0 respectively. These figures were quite impressive given the slowdown that had occurred in 2008 and 2009 due to the global economic crisis. As indicated, global growth, slowed to 3.2 per cent in 2012 from the 3.9 per cent recorded in the previous year as advanced, emerging markets, and developing economies experienced a slowdown in the level of economic activity.
Table 2-2 also shows that growth in advanced economies decelerated in 2013, to 1.3 percent, from 3, 1.7, and 1.5 in percent in 2010, 2011 and 2012, despite the fact that both the US and Japan posted better outturns in 2012 and 2013 compared to 2011 as the Euro zone slipped back into recession. Growth in the US accelerated from the 1.8 per cent recorded in 2011 to 2.8 per cent in 2012, while Japan registered an expansion of 2.0 per cent having witnessed a decline of 0.6 per cent in 2011. However, this was not enough to compensate for the weakness witnessed in the Euro zone, where the growth of 1.5 per cent recorded in 2011 was reversed as economic activity contracted by 0.6 and 0.4 percent in 2012 and 2013 respectively.
The economic growth in emerging markets and developing economies also decelerated in 2012, to 4.9 per cent from 6.2 percent in 2011. The deceleration was largely due to the slowdown experienced in China, where growth declined from the 9.3 per cent in 2011 to 7.7 per cent to mark the weakest rate of expansion since 1999. Table 2-2: Real GDP growth (percentage) - global
REGION OR COUNTRY 2010 2011 2012 2013 World 5.2 3.9 3.2 3.0 Advanced economies 3.0 1.7 1.5 1.3 Euro area 2.0 1.5 -0.6 -0.4 United States 2.5 1.8 2.8 1.9 Japan 4.7 -0.6 2.0 1.7
Emerging market and developing economies 7.5 6.2 4.9 4.7
China 10.4 9.3 7.7 7.7
Brazil 7.5 2.7 0.9 2.3
Russia 4.5 4.3 3.4 1.5
India 10.5 6.3 3.2 4.4
Namibia 4.4 3.6 4.4 4.4
19
Weaker growth in other BRICS countries, however, also contributed to the slowdown experienced by emerging market and developing countries, with Brazil posting growth of just 0.9 percent in 2012 (down from 2.7 percent in 2011), Russia expanding by 3.4 per cent (down from 4.3 per cent in 2011) and India grew by just 3.2 per cent (down from 6.3 per cent in 2011).
A comparison of the GDP growth rate for Namibia and the average growth rate of the world economies indicates that in 2010 and 2011, the world economies grew by an average that was higher than the growth rate of Namibia; but in 2012 and 2013, the Namibian economy grew by rates that were above the world average growth rates. In comparison with the advanced economies, Namibia grew by higher rates in all the years. In addition, the growth rate for Namibia falls short of the average growth rates of the emerging markets and developing countries. The one feature that distinguishes Namibia from other developing countries is that its agriculture, particularly crop farming, is weak and this can be attributed to weather and climatic conditions in Namibia not conducive for crop farming. This one factor explains why the growth rates in Namibia do not compare favourably with other emerging markets and developing countries. In addition, China is the only country that consistently grew at rates higher than Namibia did in all the years.
2.2.4 Comparison of Namibia’s fiscal balances with other regions and countries
Table 2-3 shows the comparison of global fiscal balances and budget deficits for selected economies during the period the world experienced the global economic crisis. For the majority of the countries shown in the table, their debts rose in 2009 and then began to fall after 2010. This is the case with the advanced economies, the United States of America (USA), the Euro Area, the United Kingdom (UK), emerging and developing economies, other European countries, Russia, China, Latin America and Caribbean countries and Brazil. What these figures show is that the global economic crises spurred world economies to borrow so that they could deal with the negative effects the crisis was likely to have on their economies. The world overall fiscal balance shown mirrors the pattern described above. As far as fiscal balances and budget deficits are concerned, Namibia compares favourably with the other countries and
20
regions shown in the table. The figures show that Namibia has not over borrowed and that it still has the fiscal space to finance development. This is not surprising because Namibia was upgraded from being a low-income country to a middle-income country in 2009. Such upgrades are only accorded to countries whose macroeconomic performance is improving and whose macroeconomic indicators are stable. Table 2-3 indicates that Namibia experiences smaller deficits when compared to the Advanced Economies, United States of America, Japan, United Kingdom and India.
Table 2-3: Global fiscal balances and budget deficits for selected economies as a percentage of GDP
REGION/COUNTRY 2008 2009 2010 2011 2012 2013
World Overall Fiscal Balance -2.2 -7.4 -5.9 -4.5 -4 -3.2
Advanced Economies -3.5 -8.9 -7.7 -6.5 5.9 -4.3 United States -6.5 -12.9 -10.8 -9.7 -8.3 -5.8 Euro Area --2.1 -6.4 -6.2 -4.2 -3.7 -3.0 Japan -4.1 -10.4 -9.3 -9.9 -10.1 -8.2 United Kingdom -5.0 -11.3 -10.0 -7.8 -7.9 -5.8 Canada -0.3 -4.5 -4.9 -3.7 -3.4 -3.0
Other Advanced Economies 2.9 -0.9 -0.2 0.4 0.4 0.1 Emerging Markets and Developing
Countries -0.1 -4.6 -3.1 -1.7 -2.1 -1.5 Namibia* 2.0 -1.2 -4.6 -7.0 0.1 -5.4 South Africa* 1.7 -1.2 -4.2 -3.6 -4.2 -4.4 Europe: Other 0.5 -6.1 -4.1 0 -0.7 -1.6 Russia 4.9 -6.3 -3.4 1.5 0.4 -1.3 China -0.7 -3.1 -1.5 -1.3 -2.2 -0.9 India -10.0 -9.8 -8.4 -8.5 -8.0 -7.2
Latin America and Caribbean -0.7 -3.6 -2.8 -2.4 -2.5 -3.4
Brazil -1.3 -3.1 -2.7 -2.5 -2.7 -3.3
Source: IMF Fiscal Monitor, October 2013. *Notes: Data for Namibia and South Africa i s sourced from the Ministry of Finance and National Treasury, respectively, and it refers to budget balances instead of fiscal balances. The data for Namibia and South Africa refer to fiscal years.
21
2.2.5 Supply Side Developments
The real sector of the Namibian economy is comprised of three major productive sectors, namely, the primary sector (predominantly agriculture, fishing and mining), the secondary sector (including manufacturing and construction) and the tertiary sector (alternatively called the service sector). The service sector in Namibia includes the following: wholesale and retail trade, hotels and restaurants, transport and communication, financial intermediation, real estate and business service and public sector administration. Table 2-4 and Figure 2-2 show that for the entire period under consideration, the value added contribution of the service sector to GDP is consistently the highest, followed by the secondary sector and then the primary sector. The average value added contributions of the primary, secondary and tertiary sectors for the period 1990 to 2013 are 10.43 per cent, 31.02 per cent and 58.44 per cent respectively. In addition, the contribution of agriculture to value added as a percentage of GDP ranged between 7.87 per cent and 12.76 per cent, implying that there were no significant policy shifts during the period 1990 to 2013. The fact that the primary sector is contributing the least to value added as a percentage of GDP is not surprising in Namibia because Namibia is a drought prone country, and many regions of the country are not adequately suited for crop farming but sufficient for animal husbandry.
Table 2-4: Value added by major production sectors as a percentage of GDP
Years Primary Sector Tertiary Sector Secondary Sector
1990 11.72 50.25 38.04 1991 12.44 52.85 34.71 1992 9.27 56.38 34.35 1993 9.47 61.55 28.98 1994 12.76 56.73 30.51 1995 12.11 59.99 27.90 1996 11.93 60.94 27.12 1997 10.90 61.18 27.92 1998 10.97 60.04 28.98 1999 11.37 60.95 27.68 2000 11.82 60.22 27.96 2001 10.51 58.57 30.92 2002 10.94 56.74 32.32 2003 10.94 60.71 28.35 2004 9.74 60.84 29.42 2005 11.33 59.50 29.18 2006 10.47 54.89 34.64
22 2007 9.36 55.04 35.60 2008 8.02 53.74 38.24 2009 7.87 59.48 32.65 2010 7.96 62.62 29.43 2011 8.68 62.94 28.38 2012 9.63 59.43 30.93 2013 8.66 59.08 32.24
Source: World Bank Statistics
Figure 2-3: Value added by major production sectors as a percentage of GDP
0 10 20 30 40 50 60 70 1990 1995 2000 2005 2010
PRIMARY SECONDARY TERTIARY
Source: Namibia Statistical Agency (NSA)
The regions that are suited for limited crop agriculture include northern regions, such as, Omusati, Oshana, Okavango, Kaprivi, Ohangwena and Oshikoto (see the regional map of Namibia under Appendix 2).
The contribution of value added to GDP by the secondary sector ranges between 27.68 and 38.24 per cent for the entire period. This also implies that the macroeconomic frameworks that Namibia implemented from independence onwards engendered no major shifts in sectoral growths. Additionally, there were also no major changes as far as the value added contribution of the service sector to GDP is concerned. The service sector is the main contributor to value added as a percentage of GDP, and the retail,
23
financial, and tourism and hospitality services are fundamental to this sector in Namibia. The pattern that prevailed concerning the contributions of these three sectors to GDP and the magnitude of their contribution has not changed significantly since independence. This suggests the ineffectiveness of the macroeconomic frameworks Namibia adopted and implemented since independence since there were no major shifts in sectoral growths.
2.2.6 Demand Side Developments
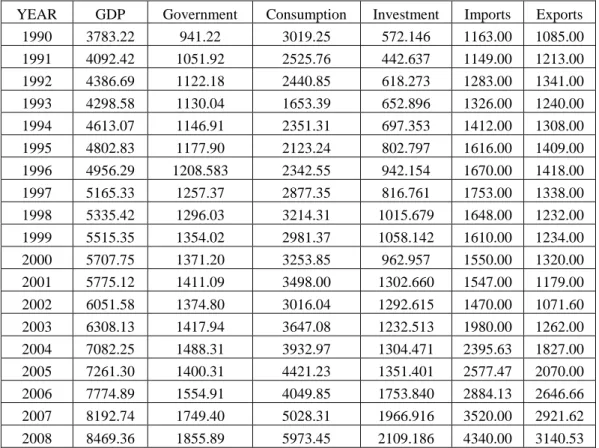
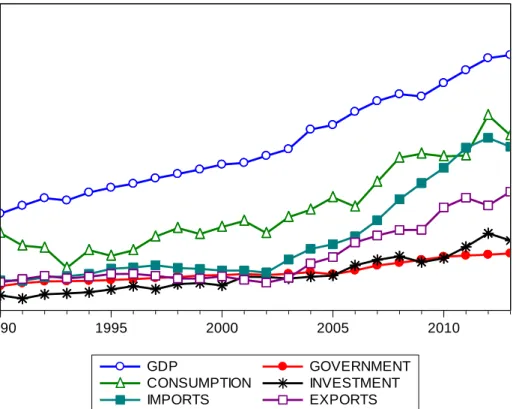
If a broader perspective is taken, the national accounts reveal a fascinating feature of the economy. Comparing economic activities from the supply and demand sides show quite transparently that the economy is supply driven, and demand constrained. The fact that throughout the period under investigation, GDP was greater than consumption expenditure by an average of 58 per cent illustrates the latter. This indicates that the economy is saving because its income is greater than its consumption expenditure. Another interesting feature shown in Table 2-5 and Figure 2-3 is the relationship between imports and exports in Namibia.
Table 2-5: Aggregate demand components (million USD, 2005=100)
YEAR GDP Government Consumption Investment Imports Exports 1990 3783.22 941.22 3019.25 572.146 1163.00 1085.00 1991 4092.42 1051.92 2525.76 442.637 1149.00 1213.00 1992 4386.69 1122.18 2440.85 618.273 1283.00 1341.00 1993 4298.58 1130.04 1653.39 652.896 1326.00 1240.00 1994 4613.07 1146.91 2351.31 697.353 1412.00 1308.00 1995 4802.83 1177.90 2123.24 802.797 1616.00 1409.00 1996 4956.29 1208.583 2342.55 942.154 1670.00 1418.00 1997 5165.33 1257.37 2877.35 816.761 1753.00 1338.00 1998 5335.42 1296.03 3214.31 1015.679 1648.00 1232.00 1999 5515.35 1354.02 2981.37 1058.142 1610.00 1234.00 2000 5707.75 1371.20 3253.85 962.957 1550.00 1320.00 2001 5775.12 1411.09 3498.00 1302.660 1547.00 1179.00 2002 6051.58 1374.80 3016.04 1292.615 1470.00 1071.60 2003 6308.13 1417.94 3647.08 1232.513 1980.00 1262.00 2004 7082.25 1488.31 3932.97 1304.471 2395.63 1827.00 2005 7261.30 1400.31 4421.23 1351.401 2577.47 2070.00 2006 7774.89 1554.91 4049.85 1753.840 2884.13 2646.66 2007 8192.74 1749.40 5028.31 1966.916 3520.00 2921.62 2008 8469.36 1855.89 5973.45 2109.186 4340.00 3140.53
24 2009 8377.10 1968.54 6131.84 1876.845 4980.00 3146.31 2010 8902.64 2087.36 6024.44 2033.276 5570.00 4025.52 2011 9407.93 2139.38 6060.14 2479.657 6360.00 4406.85 2012 9879.87 2170.26 7640.82 3011.333 6750.00 4100.00 2013 10003.00 2221.48 6851.90 2725.329 6405.10 4639.00
Source: World Bank Statistics
For the entire duration being studied, imports were consistently greater than exports and this is not sustainable in the long run. If the economy continues to experience the trade deficits, there will come a time when the sources being used to finance the deficits will dry up and this may lead the economy into an economic downturn. It is, therefore, advisable that the government pursues some policies that promote exports while at the same time ensuring that critical imports needed to grow the economy are adequate.
Between 1990 and 2002, both imports and exports were relatively stable, growing at moderately very slow rates. In addition, between 1990 and 2006, although imports were greater than exports, the gap between them was very small averaging only 20 percent per year. However, from 2007 onwards, the gap between imports and exports started widening, and between 2007 and 2013, it averaged at 44 percent per year. In addition, if the economy fails to make exports greater than imports, then it should aim to balance its trade or just oscillate around the trade balance region.
From 1990 to 2005, government expenditure was greater than gross investment; between 2006 and 2009, gross investment was greater than government expenditure and between 2005 and 2010, the gap between government expenditure and gross investment was small. It is to be noted that when the gross investment is greater than government expenditure the economy is likely to grow faster and vice versa. Higher government expenditure in a developing country simply means that the majority of the resources are going towards the operational expenses and not to the productive sector. Efforts should be made to ensure that the majority of the government resources are channelled towards investment and not towards government expenditure.