Juha Helminen
Jype – An Education-Oriented Integrated
Program Visualization, Visual Debugging, and
Programming Exercise Tool for Python
Master’s Thesis Espoo, April 23, 2009
Supervisor: Professor Lauri Malmi Instructor: Docent Ari Korhonen
Faculty of Information and Natural Sciences
Degree Programme of Computer Science and Engineering
Author Date 05.03.2009
Juha Helminen
Pages 84
Title of thesis
Jype – An Education-Oriented Integrated Program Visualization, Visual Debugging, and Programming Exercise Tool for Python
Professorship Software Technology Code T-106
Supervisor Professor Lauri Malmi Instructor Docent Ari Korhonen
Learning to program is difficult. In international studies, students have demonstrated a surprisingly definite lack of programming skills after passing their introductory program-ming courses. The underlying cause appears to be their fragile knowledge of elementary programming and overall insufficient understanding of control flow and program state. Ultimately, learning to program requires practice. On large programming courses auto-matic assessment can be used to provide students individual feedback on programming exercises without sacrificing quantity. In addition, visualization is often used in a support-ing role in order to facilitate learnsupport-ing of abstract concepts. However, existsupport-ing research indicates that mere visualizations are not effective in learning but the learners must be engaged beyond passive viewing. Furthermore, visualization tools are typically separate from automatic assessment environments, which prevents students from easily utilizing them simultaneously. An integrated environment could be used to efficiently deliver focused assignments that target the observed deficiencies in elementary programming. To address this, we developed a web-based easy-to-use tool for visualizing and debugging Python programs. The tool can be used to deliver automatically assessed Python programming exercises that are solved directly within the environment with the help of an integrated reversible debugger and automatically generated visualizations of program state. The tool was also integrated into the TRAKLA2 course management system where students’ points and submissions can be recorded and tracked.
Keywords program visualization, automatic assessment, computer science education, python, jython
Professuuri Ohjelmistotekniikka Koodi T-106 Ty¨on valvoja Professori Lauri Malmi
Ty¨on ohjaaja Dosentti Ari Korhonen
Ohjelmoinnin oppiminen on vaikeaa. Kansainv¨alisiss¨a tutkimuksissa on havaittu, ett¨a ensimm¨aiset ohjelmointikurssinsa suorittaneiden opiskelijoiden ohjelmointitaidoissa on suuria puutteita. Syy n¨aytt¨aisi piilev¨an heid¨an ep¨atarkoissa ja ep¨at¨aydellisiss¨a ohjelmoinnin alkeiden tiedoissa sek¨a kaiken kaikkiaan riitt¨am¨att¨om¨ass¨a ohjausvuon ja ohjelman tilan ymm¨art¨amyksess¨a.
Viime k¨adess¨a ohjelmoinnin oppiminen vaatii harjoittelua. Suurilla ohjelmointikursseilla automaattista arviointia voidaan k¨aytt¨a¨a antamaan opiskelijoille henkil¨okohtaista pa-lautetta ohjelmointiharjoituksista uhraamatta m¨a¨ar¨a¨a. Lis¨aksi tukena k¨aytet¨a¨an usein visualisointia abstraktien k¨asitteiden oppimisen helpottamiseksi. Tutkimusten perus-teella n¨aytt¨aisi kuitenkin, ett¨a pelk¨at visualisaatiot eiv¨at ole tehokkaita opetuksessa, vaan passiivisen katselun sijaan oppijat on aktivoitava. Lis¨aksi visualisointity¨okalut ovat tyypillisesti erillisi¨a automaattisen arvioinnin ymp¨arist¨oist¨a, mik¨a est¨a¨a opiskelijoita hy¨odynt¨am¨ast¨a n¨ait¨a helposti samanaikaisesti. Integroitua ymp¨arist¨o¨a voitaisiin k¨aytt¨a¨a tehokkaasti alkeisohjelmoinnin puutteisiin kohdistuvien teht¨avien teett¨amiseen.
T¨am¨an johdosta kehitimme web-pohjaisen helppok¨aytt¨oisen ohjelmaty¨okalun Python-ohjelmien visualisointiin ja virheenj¨aljitykseen. Ty¨okalua voidaan k¨aytt¨a¨a automaatti-sesti arvioitujen Python-ohjelmointiharjoitusten teett¨amiseen, jotka ratkaistaan suoraan j¨arjestelm¨ass¨a k¨aytt¨aen apuna integroitua virheenj¨aljitint¨a, joka tukee my¨os koodissa taaksep¨ain askeltamista, sek¨a automaattisesti tuotettuja ohjelman tilan visualisaatioita. Ty¨okalu integroitiin my¨os TRAKLA2-kurssinhallintaj¨arjestelm¨a¨an, jota voidaan k¨aytt¨a¨a opiskelijoiden pisteiden ja palautusten tallentamiseen sek¨a seurantaan.
Avainsanat ohjelmien visualisointi, automaattinen arviointi, tietotekniikan opetus, python, jython
Acknowledgements
This thesis presents results on work carried out in the Software Visualization Group in the Department of Computer Science at the Helsinki University of Technology during years 2008 and 2009.
I am thankful to my supervisor Lauri Malmi and instructor Ari Korhonen for providing the opportunity to do this work and the guidance to carry it through. Additionally, I would like to extend my gratitude to Ville Karavirta, Otto Sepp¨al¨a, Tapio Auvinen, Lasse Hakulinen, and the rest of SVG for their help, ideas, and comments. Furthermore, I thank Moti Ben-Ari, Mike Joy, Andr´es Moreno, Klaus M¨uller, Tom Naps, Hermann Schloss, and ´Angel Vel´azquez for their invaluable feedback on the finished software. Much of this work is based on Matrix and Jython, the developers of which I would also like thank for creating these useful software libraries.
Finally, I wish to thank my family for the tremendous support over the years.
Otaniemi, April 23, 2009
Juha Helminen
2 Programming Education 5
2.1 Introduction . . . 5
2.1.1 Programming and Program Comprehension . . . 5
2.1.2 Educational Software Visualization . . . 6
2.1.3 Constructivism in Programming . . . 7
2.1.4 Computer-Assisted Assessment . . . 8
2.2 Difficulties of Novice Programmers . . . 8
2.2.1 Students’ Performance on Introductory Courses . . . 8
2.2.2 Misconceptions in Programming . . . 11
2.2.3 Supporting and Improving Program Comprehension . . . 12
2.3 Program Visualization . . . 13
2.3.1 Classifications of Software Visualization . . . 13
2.3.2 Static Analysis . . . 17
2.3.3 Dynamic Analysis . . . 18
2.4 Automatic Assessment . . . 23
2.4.1 Assessing Features of Programs . . . 24
2.4.2 Approaches to Evaluating the Correctness of a Program . . . 25
2.4.3 The Pros and Cons of Automatic Assessment . . . 26
3.1 System Goals and Constraints . . . 31
3.1.1 Goal1 – Visualization . . . 32
3.1.2 Goal2 – Reversible Debugging . . . 33
3.1.3 Goal3 – Automatic Assessment and Feedback . . . 34
3.1.4 Goal4 – Ease of Use . . . 34
3.1.5 Goal5 – Low Barrier to Entry . . . 35
3.2 Existing Systems . . . 36
3.2.1 Educational Program Visualization . . . 36
3.2.2 Education-Oriented Programming Environments . . . 39
3.2.3 Automatic Assessment of Programming Assignments . . . 40
3.2.4 Tools for Python . . . 44
3.2.5 Summary . . . 44
3.3 Design Choices . . . 45
3.3.1 Representation – Content and Form . . . 45
3.3.2 Interaction . . . 46
3.3.3 Automatic Assessment and Feedback . . . 47
4 Implementation 49 4.1 Functionality . . . 49 4.1.1 Visualization . . . 50 4.1.2 Interaction . . . 54 4.1.3 Content . . . 55 4.2 Technical Details . . . 55 4.2.1 Python Tracing . . . 56
4.2.2 Defining Exercises and Examples . . . 58
5 Evaluation 61 5.1 Visualization in Jype . . . 61 5.2 Interaction in Jype . . . 63 5.3 Discussion of Goals . . . 63 6 Conclusions 67 6.1 Future Work . . . 68 vi
B.2 Evaluation Form . . . 90
B.2.1 The Rationale of the Tool . . . 90
B.2.2 Visualization . . . 91 B.2.3 Interaction . . . 91 B.2.4 Technical Quality . . . 91 B.2.5 Goals . . . 91 B.2.6 Applicability . . . 92 vii
Introduction
1.1
Background
It is widely agreed that learning to program is extremely difficult. Beginning pro-grammers tend to have serious difficulties in grasping the abstract concepts and notations that programming involves. However, as with any abstract constructs, we can use illustrations to try to convey information about them. Software is commonly visualized in an attempt to facilitate program comprehension and support software engineering activities.
The aim of software visualization is to enable making sense of software structure, dynamics and processes by delivering illustrative and intuitive graphical representa-tions of software concepts and constructs. Depending on the specific task at hand the visualization can, for example, be at a higher level of abstraction with reduced details than the actual data, thereby making the information easier to navigate, analyze and absorb. Software visualization can help with software development activities in facilitating collaborative development, debugging and testing, and with software maintenance activities in facilitating fault and quality defect detection, refactoring, re-engineering, reverse engineering, software configuration management and code reviews. A significant application area of software visualization is programming education. There software visualization techniques are utilized to help students learn programming concepts and algorithms. This area of software visualization will be the focus of this thesis.
Educational software visualization tools are used to give students graphical represen-tations of aspects of software systems that are inherently intangible and hidden from
to passive animations, more engaging visualizations that activate the students appear to be more beneficial. This result has encouraged researchers to create systems that integrate software visualization and automatic assessment: students are given tasks related to a visualization and their answers are automatically evaluated for correct-ness to give them immediate feedback. This way, the systems are able to engage students more effectively. The assignments can, for example, be pop-up questions based on an algorithm animation [66, 95, 111, 112] or a code animation [80, 94], which then forces the students to really stop and think about what is happening, for example, by asking them to predict the next step in the algorithm or the value of a variable. Another example is automatically assessedvisual algorithm simulation assignments, where students construct algorithm animations by simulating the steps of an algorithm’s execution. In TRAKLA2 [89], students interact with visualizations of data structures by clicking and dragging various graphical representations of data, and the correctness is evaluated by comparing the data structures’ state transitions against those created by running an actual implementation of the algorithm. In MA&DA [78] students invoke operations via pop-up menus which are then compared to the correct sequence of operations to evaluate correctness and give feedback. In PILOT [21] graph algorithms are simulated by clicking edges of graphs to express traversal.
1.2
Objectives
Currently, there are several educational tools available that employ software visual-ization and automatic assessment to complement the teaching of programming. They vary much in features and approaches. On the one hand, there are many systems that are geared to simply creating animations of program executions to provide insight into the inner workings of memory and data structures and, on the other hand, there are many systems built for automatic programming exercise assessment. Generally, to make good use of both of these technologies, students have to use two
separate tools. They might install a stand-alone application for visualizing their code, such as an education-orientedintegrated development environment (IDE), and separately submit and get feedback on their answers over a web-based assessment system. This is especially burdensome if we specifically want to drill their elementary programming skills with many small assignments focusing on language constructs and concepts, control flow, data flow and algorithms. In addition, many program visualization systems are primarily intended for use on lectures or in lecture notes and cannot create visualizations directly from running actual code in a visual debug-ging manner, but require manually annotating the code with animation instructions. However, especially for the Java language, there are also implementations that create visualizations automatically or on-the-fly from source code [27,86,93,100,120]. The objective of this thesis is to build an engaging interactive learning tool for novice programmers at the CS1 and CS2 levels that focuses on unit-level Python programming and basic data structures and algorithms. The tool will incorporate and integrate automatic software visualization strategies and automated assessment in creating a programming exercise system intended for rehearsing basic program comprehension, tracing and writing skills. The assignments are to range from a few lines of code to a few dozen in size and they are meant to teach and test the understanding of basic control and data flow. As opposed to most existing systems the solving of exercises and debugging of erroneous programs is to be supported with a closely-integrated debugging and visualization functionality. Furthermore, the new tool is to be integrated into a course management system to be deployed on introductory programming courses.
Our hypothesis is that by providing transparency into the execution of programs through software visualization and practice material in the form of automatically assessed programming exercises, the tool will aid in developing beginning programmers’ skills in basic program comprehension and prevent misconceptions related to control and data flow by facilitating the construction of a viable model of program execution.
1.3
Structure of the Thesis
The structure of the thesis is as follows. Chapter 2 gives an introduction to the software visualization and automatic assessment fields of research as they relate to the teaching of programming. We define the basic concepts and review common visualization and assessment techniques being employed in tools aimed at teaching and learning programming. In Chapter3, we draw upon this analysis to come up
Programming Education
2.1
Introduction
This thesis builds on an extensive existing body of research on computer science education (CSE). In this chapter we review some of the most important results that motivate and form the basis of our research. As discussed in Chapter1, we intend to build a software tool to support the teaching and learning of programming, which will be the focus of discussion. Furthermore, our specific scope is the visualization and automatic assessment of small programs that serve to exemplify elementary programming concepts and constructs and lay the foundation for learning to program on introductory programming courses.
2.1.1 Programming and Program Comprehension
Programming is a core competence in computer science (CS) and is usually the first step in a CS curriculum. At the heart of programming is the concept ofprogram comprehension, which refers to the process of understanding programs and software. Program comprehension research is twofold in that it deals with the theories of how programmers comprehend software and with the tools and methods used to assist in comprehension-related tasks. In essence, what happens in programming is that a programmer constructs amental model, an internal representation of their understanding about a program’s intent, its data and execution, through some cognitive processes, the study of which is the center of program comprehension research. It is good to note that program comprehension in itself is not an end goal, but rather a necessary step in all programming activities. [130]
plied by the programming language’s constructs [38]. On introductory programming courses students are expected to acquire this type of new knowledge, strategies and practical skills in a time span of only a few months and as programming dominates the beginning of any CS curriculum this difficulty can also easily discourage learners from continuing in this field. Indeed, ”none of these issues are entirely separable from the others, and much of the ’shock’ . . . of the first few encounters between the learner and the system are compounded by the student’s attempt to deal with all these different kinds of difficulty at once.” [108] Consequently, many kinds of software tools have been built to aid in developing programming and program comprehension skills. Most of these incorporate some form of visualization in an attempt to better communicate the abstract notions and constructs inherent in programming, and in so doing improve and speed up program comprehension.
2.1.2 Educational Software Visualization
Software visualization (SV) is “the visualization of artifacts related to software and its development process” [35], and is used in the presentation, navigation and analysis of software systems. This wide definition includes, but is not restricted to, the visualization of program code and data, requirements and design documentation, source code changes, bug reports, software quality and other metrics, and testing results. Specific areas of SV, that have been widely applied to programming education, and are therefore most relevant to our discussion, are the branches of program and algorithm visualization.Program visualization (PV) refers to the visualization of thesource code1 and data of a program [105].Algorithm visualization (AV), on the other hand, is understood to mean the visualization of algorithms and programs on a higher level of abstraction, that is, on a more conceptual level [105]. While intuitively program and algorithm visualizations seem like powerful teaching methods this is not necessarily true. Their effectiveness has been suggested to depend on the
1“Source code is any static, textual, human readable, fully executable description of a computer
chosen level of abstraction and how clean the visual presentation is [109]. More recent research on educational AV also indicates that the degree of user interaction with the visualizations,i.e., the learner involvement, is a major factor as far as actual learning is concerned. In an extensive study on existing research on algorithm visualization Hundhausen et al. [62] concluded that the most beneficial uses of AV are those that activate the student, for example, with questions or exercises, as opposed to plain viewing. They suggest that AV is most effective when used in a supporting role of some engaging activity. Naps et al. [96] go as far as to say that educational SV is of little value if it does not engage the students in an active learning activity.
2.1.3 Constructivism in Programming
In his articles [11,12], Ben-Ari applies the dominant theory of cognitive learning, constructivism, to CSE, and concludes that “Given the central place of constructivist learning theory and its influence on pedagogy, computer science educators should . . . analyze their educational proposals in terms of constructivism”. According to constructivism a learner actively constructs knowledge instead of passively absorbing complete models of knowledge from lectures and books. In essence, the theory claims that ”all learning involves the interpretation of phenomena, situations, and events, including classroom instruction, through the perspective of the learner’s existing knowledge” [125]. In other words, a learner builds knowledge by combining observations with their pre-existing models. When applied to programming, this implies what is also intuitively sensible, that in the end, learning to program requires practice along with adequate guidance to avoidmisconceptions and to keep learners on the right path to building aviable model of programming knowledge. To a large extent, rote learning is not possible and while programmers can arm themselves with an array of pattern approaches that can be applied in many situations, ultimately, each problem will have a unique solution composed of several basic building blocks. Learners must first gain an understanding of the basic mechanics and then practice logical reasoning by combining and applying their mental models to solve problems in a variety of contexts.
The models are viable if they prove ”adequate in the contexts in which they were created” [141]. That is, they allow the learner to accurately and consistently explain the mechanics of the constructs. The constructivist view indeed suggests that as learners each construct their own meanings from the materials and instruction they receive, they frequently end up with misconceptions, and that ”the goal of instruction
2.1.4 Computer-Assisted Assessment
Typical tasks for a beginning programmer include writing, extending or modifying a simple program or piece of code. Going through and grading these students’ submis-sions is a time-consuming and mostly monotonous endeavour which quickly becomes a major burden on the teaching staff with their often strict resource constraints. This is wherecomputer-assisted assessment (computer aided assessment, CAA) comes into play. CAA refers to software solutions of fully or partially automating the assessment, feedback and grading of assignments [4]. With the help of automatic assessment (AA) of programming assignments, even the workload on large courses can be kept manageable while still providing students with a reasonable level of guidance in developing their skills through hands-on experience with practical programming tasks.
Next we will take a closer look at topics brought up in this introduction.
2.2
Difficulties of Novice Programmers
2.2.1 Students’ Performance on Introductory Courses
High drop-out rates are not atypical on first programming courses. In a recent study on the reasons behind this problem among CS minors at their institution Kinnunen and Malmi [71] reported a rate of 26 percent on their course, and in general the rate at many institutions is estimated to be at 20–40 percent. In 2007 Bennedsen and Caspersen [14] carried out a survey to internationally quantify failure rates on introductory programming courses. Across the 65 institutions that provided data for the study the rate for CS1 was 33 percent. This is obviously a significant waste of resources if the students have to take the course over and over to be able to pass. So any means of combating this problem are definitely worth of research. Along the same lines, multi-national studies have found that even novice programmers that have
passed their introductory programming courses have great difficulty in implementing and understanding even the simplest of programs [124,135]. In an ITiCSE2 2001 working group study by McCracken et al. [90], a sample of 216 students from 4 universities were assessed after taking their first CS courses. On average they scored a discouraging 22.89 points out of 110 according to the evaluation criteria designed to meet the learning objectives of a first programming course. The overall result of the experiment was that students definitely cannot program at the expected level of competency when they have completed their introductory programming courses. A commonly suggested explanation for the weak performance is that the students lack adequate skills in problem-solving [108]. The McCracken group described five steps that take place in this process: (1) abstract the problem from its description, (2) generate sub-problems, (3) transform sub-problems into sub-solutions, (4) re-compose the sub-solutions into a working program and (5) evaluate and iterate. Another explanation is that they lack required knowledge and skills precursor to this process. An ITiCSE 2004 working group led by Lister [85] set out to find out if, in fact, the real root of the problem is students’fragile knowledge of basic programming constructs, such as arrays and recursion, and their consequent deficiencies in understanding code. Fragile knowledge means that while a student might possess the knowledge to answer direct questions about particular programming items he is not able to apply that knowledge in solving a problem on his own. “[This] may take a number of forms: missing (forgotten), inert (learned but not used), or misplaced (learned but used inappropriately) [knowledge].” [108] Indeed, the working group discovered that many students are hindered by their inability to trace and understand code. That is to say, much of the problem resides in their weak skills in program comprehension which then turns out to be an essential factor even when writing novel code from scratch. Intuitively it does make sense that the cognitive processes of program comprehension always interleave the creative activities. Lister et al. [85] go on to note that, while experts generally employ higher-level skills in the comprehension of real programs, even they resort to meticulously simulating the code if they are unable to grasp the program’s behaviour otherwise. By higher-level skills they refer to, for example, utilizing domain knowledge orbeacons, which are specific recognizable programming patterns, such as the three-step-swap shown in Figure2.1[34]. Consequently, they suggest that it might be appropriate to first teach beginning programming students to properly systematically trace code.
In their study of introductory programming course drop-outs, Kinnunen and Malmi
Figure 2.1: An example of a beacon. Instead of systematically reading the three lines to decipher their meaning, an expert will recognize the three-step pattern that is commonly used to swap the values of two variables.
reported that the students viewed finding run-time errors as the most difficult programming-related issue [71]. With run-time errors even experts tend to resort to systematically tracing code as a debugging strategy, so in light of the discussion above, it is not surprising that students find these particularly hard to debug. The severity of the issue that students find it hard to trace errors to their causes is demonstrated by Kinnunen and Malmi [70], who also reported that students named the difficulty of tracking down even simple errors as one of the reasons behind their decision to drop out. What discouraged them was that finding even a minor error could take hours. Based on the above discussion we can postulate that students are unable to find the errors because they lack the required precise understanding of basic control flow elements to be able to trace through their code. The results of a follow-up study to the Lister working group seem to support this theory. Based on the working group’s data collected from the questions that required students to read code, Fitzgerald et al. [43] looked into novices’ code tracing strategies. They found that students often – in principle – employed good strategies and most of them used walk-throughs, that is, systematic line-by-line tracing. However, their success varied greatly, which indicates a fragile knowledge of programming constructs. A related recent study on novices’ debugging capabilities concluded that locating a bug is the real challenge in the debugging process [42], which is in accordance with earlier studies [69]. Fitzgerald [42] observed that once found, students were able to quickly fix bugs. The most challenging bugs to find were those related to loop conditions, conditional logic, arithmetic errors, and data initialization and updating. With regard to debugging strategies employed, the observations were similar to those of the code tracing study: there was no obvious correlation between the quality of strategies used and the success at debugging. So it appears to be more important how effectively the strategies are utilized. As an example of the ineffective use of a
strategy she explains how some students inserted print statements that printed the same fixed string in two different places, which can be accounted to an incomplete understanding of basic control and data flow.
2.2.2 Misconceptions in Programming
On the matter of what are the particular topics that students struggle with, the extensive literature review by Robins et al. [108] concludes that loops, conditionals, arrays and recursion are language features that are especially problematic for novice programmers. One example given of this is the failure to understand how the loop control variable is automatically incremented in a for-loop. Similarly, in a wide survey of educators about what they felt are the most difficult topics in CS1, in the category of general programming, the instructors mentioned such concepts as parameter passing, arrays, and recursion [30].
Underlying misconceptions about programming constructs are often offered as an explanation of students’ difficulties. For example, students might apply the analogy of a box to variables and based on this metaphor believe that a variable may simultaneously contain many values [12]. However, the role of misconceptions is disputable.
Spohrer and Soloway [127, 128] conducted empirical studies with Pascal where they reported that bugs in students’ programs are not primarily caused by misconceptions but instead stem from problems with plan composition. More recently, on courses taking the objects first approach, object-orientation-related misconceptions are not uncommon as discussed, for example, by Ragonis and Ben-Ari [106], and Sanders and Thomas [118]. In her studies of misconceptions in Pascal’s parameter passing and in Java, Fleury [44,45] noted that the incorrect self-invented rules constructed by the students predicted the behaviour as expected for a large set of programs. Their rules failed and the misconceptions became apparent only in some specific cases. Indeed, ”most, if not all, commonly reported misconceptions represent knowledge that is functional but has been extended beyond its productive range of application” [125]. This brings up the point that even if misconceptions do not in typical cases manifest themselves as bugs, when they exist they are especially harmful. Eventually, when invoked, misconceptions result in bugs that are impossible to debug by the student because they follow from a fundamental flaw in their thinking. For example, in the working group report by Lister at al. [85], the second most difficult question for the students was the only one which involved invoking a return statement inside a loop.
responses formulated.” Milne and Rowe [91] studied what are the most difficult topics in learning C++ programming, and equally stressed the importance of viable models. They concluded that they believe “the most difficult topics are so ranked because of the lack of understanding by the students of what happens in memory as their programs execute . . . the students will struggle . . . until they gain a clear mental model of how their program is working”.
2.2.3 Supporting and Improving Program Comprehension
The implications of the discussion in this chapter are that, at least in the very beginning of learning to program, the hidden aspects of data and control flow should be made explicitly visible to the novices to let them properly learn to trace program state, to find errors effectively and to prevent fragile knowledge from evolving into misconceptions about basic programming constructs. This implies that the learning process should be supported with appropriate program visualizations. Also, while demonstrating programming principles in a passive fashion by explaining code on lectures and in textbooks might let the students absorb some structure of fragile knowledge of the programming constructs, this leaves space for fundamental misconceptions and generally is not enough to teach them to systematically apply this knowledge in tracing and writing code in practice on their own. We believe that to properly learn the basics of programming, students need to solve many small programming assignments that are purposefully designed to demonstrate different aspects of programming, and which require them to read, write and modify programs in a repetitive manner.
2.3
Program Visualization
2.3.1 Classifications of Software Visualization Task-Oriented Taxonomy of Software Visualization
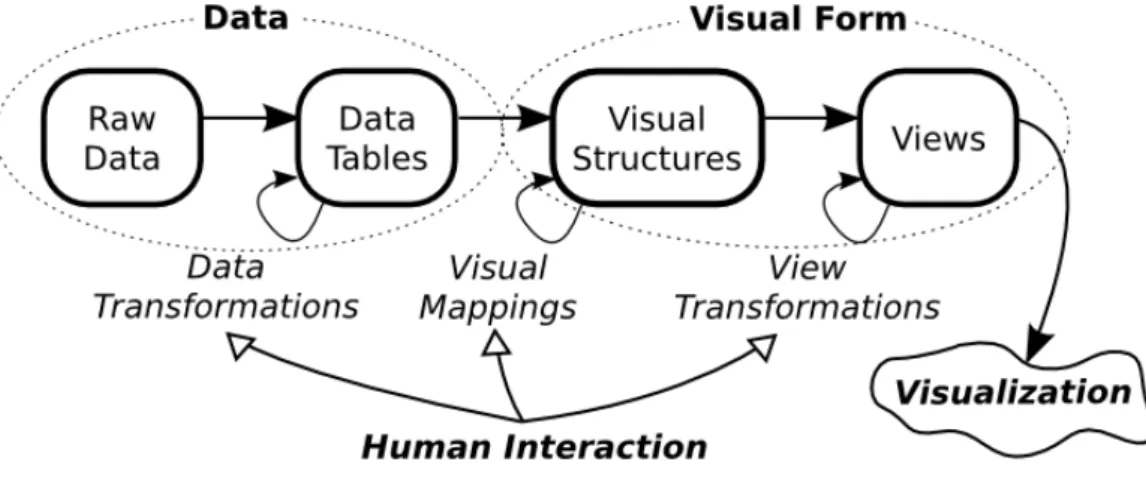
Based on the reference model of visualization given in Figure 2.2 adapted from Schneiderman et al. [123], Maletic et al. [87] define a task-oriented taxonomy of software visualization consisting of five different dimensions as listed below.
Figure 2.2: Reference model of visualization.
1. Tasks – why is the visualization needed? 2. Audience – who will use the visualization? 3. Target – what is the data source to represent? 4. Representation – how to represent it?
5. Medium – where to represent the visualization?
The model of visualization presented in Figure2.2defines visualization as a mapping of data to visual form that can also support interaction for adjusting the data processing step, the visual mappings, or the properties of the final visualization elements. This pipeline can be directly applied to software. Raw data is the source code, execution data or other software artifact. This data can directly or via transformations into
metaphor for representing objects could be to show them as named rectangles and references between them as connecting lines. A view of a complete software would then be a graph of all the objects, which we might, for example, be able to scale to better tell apart the different components. [87]
A software visualization is then characterized in terms of the following five dimen-sions. Thetask dimension refers to what specific tasks are to be supported by the visualization. It could, for example, be meant to enhance understanding for simply educational purposes, debugging or reverse engineering. The audience dimension defines the attributes of the intended users of the visualization. The type of users, whether it be students, instructors or expert developers, has great significance in how the system should be designed: what kind of expertise do we expect the user to possess and how is this reflected in the type of visualizations and controls provided? The target dimension refers to what aspects of the data are to be presented. These can be attributes such as the architecture of a software system, the source code, an algorithm or software metrics. One of the most important elements of a software visualization is the choice of representation. This dimension defines how and what type of visualizations are derived from the target data to present the information. Finally, themedium dimension refers to the environment through which the visual-ization is made available, such as a single monitor, multiple monitors or a virtual reality environment. [87]
Price Taxonomy of Software Visualization
Another popular framework for describing software visualizations is that of Price et al. [105], in which visualizations are classified in terms of six basic categories as listed below. The taxonomy is somewhat outdated in that it is very much focused on the visualization of actual small programs and does not take into account all the aspects of SV that it has evolved to encompass since then, such as, visualizing software evolution (e.g. [24,41,40,140]). Still, put together with the task-oriented
taxonomy it provides a good basis for explicating and evaluating different aspects of SV systems as it offers a somewhat different view.
1. Scope – What is the range of programs that the SV system may take as input for visualization?
2. Content – What subset of information about the software is visualized by the SV system?
3. Form – What are the characteristics of the output (the visualization) of the system?
4. Method – How is the visualization specified?
5. Interaction – How does the user of the SV system interact with and control it? 6. Effectiveness – How well does the system communicate information to the user? Scope refers to the generality and scalability of the visualization system. That is, how wide range of programs in what environments and how large data sets can it display. For example, an educational visualization system aimed at beginning programmers might be restricted to a specific set of programming language constructs and few data items as opposed to arbitrarily complex software.Content defines what is visualized at what level of abstraction. For example, a system could be designed to visualize run-time behaviour at the conceptual level of showing line-by-line execution and the values of variables. The form category refers to the properties of the actual visualizations, such as, what medium is used, what types of graphical objects are there and how are they combined into views.Method category concerns itself with how the visualization is specified. In other words, is it automatically generated from program code or is there a specific language or library for creating it.Interaction defines what kind of controls there are to modify and navigate the visualizations. For example, there could be controls for spatial or temporal navigation of the visualizations. Finally,effectiveness refers to the system’s ability to effectively convey the intended information and thus satisfy its purpose. [105]
As the learning of programming starts by observing the structure and flow of and by writing small programs, we can try to, and should as suggested by discussion in Section2.2, facilitate understanding by visualizing the programs’ structure and behaviour. As mentioned in the introduction of this chapter, this means using the closely-related methods of program and algorithm visualization. In terms of the
implementation of an algorithm but instead the visualization is described, for example, with analgorithm animation language [67] or as a code implementation that contains additional annotations for carrying out the visualization (e.g.[19,25,33,129]). A type of annotation is providing special libraries with visualization capabilities that replace the standard ones to provide visualization somewhat transparently and automatically (e.g.[10,75,81,131,134]. These approaches are generally used to create more abstract visualizations which can, however, be linked to a visualization of an actual code or pseudo code implementation of the algorithm (e.g. [113]) or can be parametrized (e.g. [68]) what gives the impression of a real program visualization. Similarly, program visualizations can include elements typical of algorithm visualizations by providing visualizations of abstract concepts such as data structures that are identified by analyzing the program’s data patterns (e.g.[27,59]). We will focus on the techniques of program visualization, as we’ve defined it, because our intent is to visualize actual student-created code on-the-fly. In the teaching of programming, this type of visualization is made use of, for example, in novice-oriented integrated development environments (IDE) (e.g. [26]) and visual code tracing tools that are designed to support debugging or aid in demonstrating program behaviour on lectures (e.g. [80,93]).
In terms of the representation dimension or the Price’s method category, program visualizations can be divided into those created viastatic analysis and those generated throughdynamic analysis. Dynamic analysis refers to the run-time inspection of a program as opposed to static, compile-time analysis [35]. With static program analysis techniques we analyze the source code so as to compute predictions on the set of values or behaviours that arise dynamically at run-time when executing the code [97]. The input data and environment of a particular execution is not and cannot be taken into account but the result must hold for all executions of the program, which means that approximations must be made [16]. In addition, based on static analysis we can visualize features of the code itself, and not the resulting program, such as the language’s syntax and semantics. On the other hand, with dynamic methods we look to
give representations for the state and execution of running code,i.e.the realized data and control flow in one execution instance. The challenge in software visualization is devising metaphors that effectively map concepts to graphical representations. The aim is to “evoke mental images to better memorize concepts and to exploit analogies to better understand structures” [35]. Next we’ll review representations that have been used to illustrate small-scale programs for educational purposes. Because of our scope we will not go into class-level and component-level architectural visualizations but restrict ourselves to techniques relevant to the visualization of the structure and execution of short pieces of code ranging from a few to a few dozen lines of code. 2.3.2 Static Analysis
As it’s written in a formal language, a program’s source code has a very specific structure and semantics that depend on the programming language. In static methods, based on this well-defined structure, the code is analyzed to visualize features of it and the program it describes.
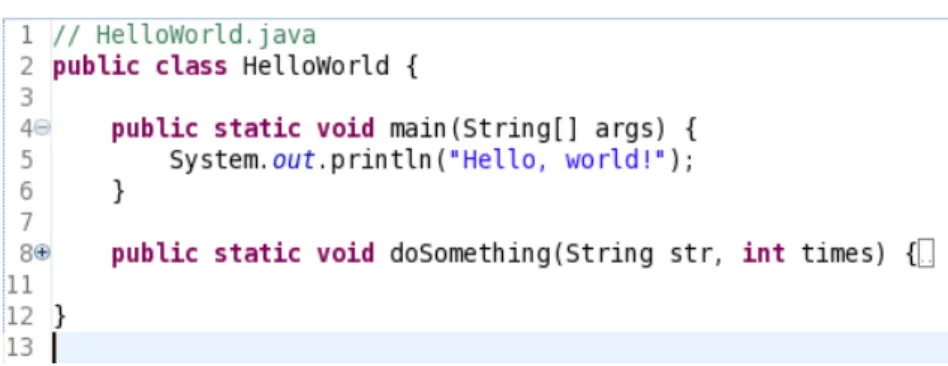
A widely used visualization technique is pretty printing, which originally refers to “the use of spacing, indentation and layout to make source code easier to read in a structured language” [105] but nowadays attributes such as colors and fonts can also be adjusted. In essence, the code is parsed or matched against patterns defined with regular expressions to identify the syntactic or semantic roles of lexical components or groupings of components, which are then illustrated accordingly, for example, by showing string literals in a specific style, by indenting function bodies or other blocks of code in a certain manner or by graphically annotating specific fragments of code, such as beacons or other identifiable patterns. A ubiquitous form of pretty printing issyntax highlighting, where the keywords and literal values of the programming language are colored in distinctive ways to make it easier to discern syntactic constructs. The textual visualization can also be enhanced with visual navigation of code groupings in order to enhance legibility with large programs, for example, by usingcode folding. Figure2.3shows an example of pretty printing and code folding.
The second approach is to augment or replace the textual representation by carrying out program analyses, such ascontrol flow or data flow analysis, to extract information about the defined program. In data flow analysis a program is thought of as a graph, where “the nodes are the elementary blocks (of the program) and the edges describe how control might pass from one elementary block to another” [97] and “the purpose
Figure 2.3: Java syntax higlighting in Eclipse (http://www.eclipse.org). Keywords, such as, “class” and visibility modifier “public”, comments and the string literal are presented in different styles. The plus and minus signs next to the row numbers indicate that the “main” method is collapsed,i.e.fully visible, whereas “doSomething” has been folded and only its signature is shown.
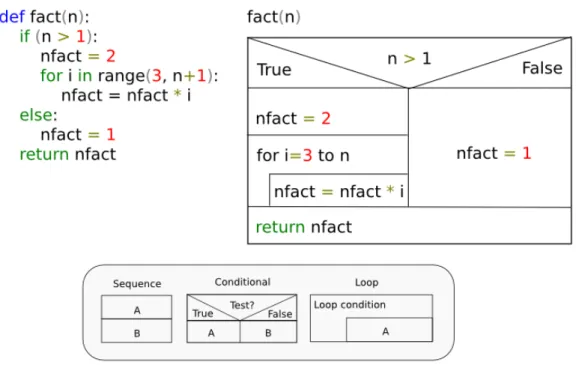
of control flow analysis is to determine information about what elementary blocks may lead to what other elementary blocks” [97]. The results are typically shown in some diagrammatic graph-like form that attempts to illustrate data dependencies and possible execution paths. Examples of such visualizations are theJackson diagram, control-flow graphs,structograms(Nassi-Schneiderman diagram) andcontrol-structure diagrams [35]. Figures2.4,2.5,2.6and2.7show these diagrams when applied to a simple implementation of computing the factorial3.
2.3.3 Dynamic Analysis
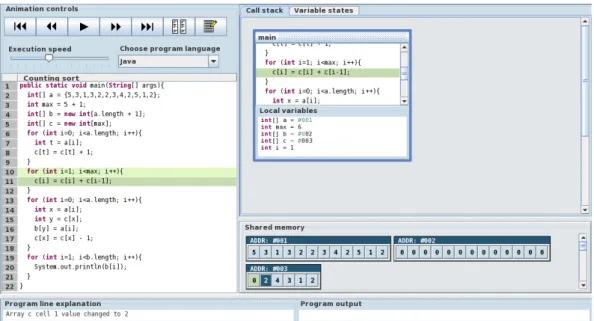
The state of a running program changes as the execution progresses so the visu-alization is not fixed. Therefore the visuvisu-alization is typically an animation, that is, “a sequence of images which are shown one after another” [35]. The transition between images can be continuous, which is also referred to as smooth animation. Alternatively, information can either be accumulated or plotted along a time axis. For example, we might count the times a specific method is called or record what lines have been executed. The visualizations derived from dynamic analyses can be divided into two categories: data and code visualization.Data visualization focuses on memory contents, the data flow, andcode visualization refers to the visualization of instruction executions, the control flow. [35] Figure2.8shows a screenshot of the ViLLE4 visualization tool that features both data and code visualization.
3
The code is constructed the way it is so that it features branching, looping and sequential execution. The examples are adapted from Diehl [35]
4
Figure 2.4: Jackson diagram of a factorial function. In the lower left corner are the building blocks of a Jackson diagram. The first diagram shows a sequence A that consists of actions B and C in that order. The second diagram shows an iteration A that repeats action B while condition C is true. The third diagram shows a branching construct A that consists of actions B and C which are taken according to their respective conditions C1 and C2.
Data Acquisition
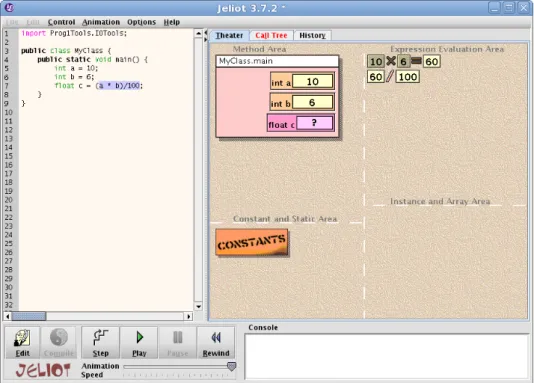
An important aspect with dynamic analysis techniques is thedata acquisitionmethod, i.e., how the run-time information about a program is extracted. Generally, the program is eitherinstrumented,i.e., additional instructions for recording the state are added within the original code (e.g. [86]), or the program is run in a special environment whose changes can be observed, such as a virtual machine or an inter-preter which supportsreflection well, where reflection is “the ability of a program to manipulate as data something representing the state of the program during its own execution” [18]. For example, the JIVE (Java Interactive Visualization Environment) visualization tool [47] collects information about the execution from the Java virtual machine via the Java Platform Debugger Architecture (JPDA)5 application program-ming interface (API), and the Jeliot 3 [93] visualization tool executes programs with a Java interpreter, DynamicJava6. [35]
5
http://java.sun.com/javase/technologies/core/toolsapis/jpda/
Figure 2.5: Control-flow graph of a factorial function. In the lower left corner are the building blocks of a control-flow graph. The first diagram represents a statement which can be combined into sequences by connecting them with arrows. The second diagram represents a branching conditions where T and F indicate the transition that follows from a true or false condition.
Visual Metaphors
The visual representations of a program’s dynamic state are largely tool-specific and in Section3.2 we give more concrete examples of existing solutions, whereas here we only examine some common approaches. In current algorithm and program visualization systems, the code,i.e.the progress of control flow, is typically visualized by simply highlighting the parts of the textual representation of the code’s statements and expressions that have been or are being executed (e.g.[27, 80,93,139]), although all the diagrammatic illustrations discussed above would also be possible. With procedural languages we also usually have a visualization of the execution stack which is used to carry out function invocations. Program data is generally visualized as table-like views of variables’ values or as a graph of data components where nodes are structures and programming constructs such as classes, objects and variables, and arcs represent connections and references between them. More conceptual visualizations of running programs that attempt to capture the same level of abstraction as typical in hand-crafted algorithm visualizations are also possible. These are accomplished either by traversing and analysing memory structures to identify specific patterns (e.g.[77])
Figure 2.6: Structogram (Nassi-Shneiderman diagram) of a factorial function. In the bottom are the building blocks of structograms. The first diagram represents a sequence where A is before B. The second diagram shows a branching construct where the A branch is taken if the test is true and vice versa. The third diagram shows a looping construct where A is repeated as defined by the condition.
or simply by recognizing the use of specific interfaces, classes or modules for which the system can provide abstract visualizations (e.g.[57]). In algorithm visualization an algorithm’s execution is typically visualized as analgorithm animation where the chosen sequence of execution states, theinteresting events, is mapped to appropriate images of data structures creating a visual representation of how the algorithm works [35]. Program visualization tools that dynamically inspect run-time structures to identify data structures can seemingly create algorithm animations on-the-fly with no extra annotation or other visualization instructions.
Visual Debuggers
An important application of dynamically generated program visualizations arevisual debuggers. These are tools that ”reflect code-level aspects of program behavior, showing execution proceeding statement by statement and visualizing the stack frame and the contents of variables” and ”are directed more toward program development
Figure 2.7: Control-structure diagram (CSD) of a factorial function. On the right are some building blocks of CSDs. The first diagram represents a sequence where B is executed after A. The second diagram shows a branching construct. The third diagram represents an iteration where the statement is repeated as defined by the looping condition.
Figure 2.8: A screenshot of the ViLLE visualization tool. On the left is the primary code visualization where the next and the previously executed lines are highlighted. On the right there is a call stack visualization showing the values of local variables and below that there are visualizations of arrays.
rather than understanding program behavior”. [103] In general, the goal of the process of debugging is “to detect the existence of errors in a program, to locate their position or cause, and, finally fix them” [35] and in visual debugging, graphical
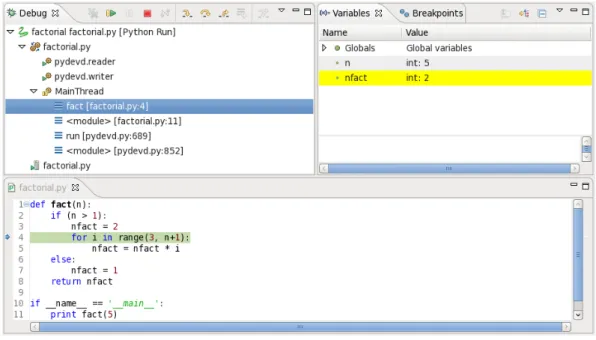
representations of data and execution are used to help locate errors by allowing visual observation, exploration, and navigation of program state. These types of tools typically let the programmer execute software in steps while allowing them to easily follow the flow of data. Figure2.9 has a screenshot of a typical visual debugger. It shows a Pydev7 debugging session in the Eclipse IDE8.
Figure 2.9: A Pydev debugging session in Eclipse. On the left we have representations of the execution threads. The states of variables are shown on the right. The yellow highlighting indicates that the previously executed line changed the value of the variable nfact. The code is on the bottom. The line that will be executed next is highlighted in green.
2.4
Automatic Assessment
Traditionally, the limiting factor in the number of actual programming assignments given to students on a course has been the amount of resources available to manually assess them. Because of this there usually are not that many of them. Of course, we can simply provide optional exercises that are voluntary to complete and are not checked by the course staff. However, the applicability of this approach is very limited. In their discussion of assessing programming assignments on large courses, Alamutka and J¨arvinen [3] note the tendency of students to try to minimize their workload, which
7
http://pydev.sourceforge.net
8
assessment (CAA) the evaluation process is supported with software tools that fully or partially automate the tasks involved in order to reduce effort and speed up the process. Examples vary from facilitating rapid and consistent grading with feedback authoring tools (e.g. [1]) to intelligent tutoring systems (ITS, e.g.[5,92,133]) that simultaneously monitor and model the progress of and guide and give intelligent feedback on the student’s learning.
2.4.1 Assessing Features of Programs
Generally, the assessment of programming assignments is based on the end artifact, the resulting programs and documentation, instead of, for example, the process observed while the student carries out the programming task. We require correct functionality, suitable design and good programming style. Typically, with automatic methods the correctness of the program, that is, its adherence to a given functional specification, is evaluated by examining the program’s dynamic behaviour. In addition, we can also target many other non-functional properties and features of the code and the program it describes, such as, readability, efficiency and general programming style. For example, the program could be subjected to an analysis designed to uncover unnecessary uses of global variables, poor naming of identifiers or improper indentation. However, many of these properties are not readily assessable with automatic methods because they cannot be easily defined formally and require higher level reasoning or are a matter of taste, such as, the sufficiency and quality of comments in a program or the idiomatic use of language constructs and libraries. Thus, often only correctness is tested. In Section2.2 we made the case that our tool must support the delivery of many short programming assignments. Indeed, especially with small assignments, where we only look to teach elementary programming, we can settle for assessing correctness.
2.4.2 Approaches to Evaluating the Correctness of a Program Early automatic assessment systems were based on special tools, such as, modi-fied versions of compilers and operating systems, whereas in all current systems solutions are submitted over the Internet via a web-based interface to a remote machine for assessment [37]. There are two primary approaches of automating the assessment of the correctness of programming assignments, for which we will use the terms programoutput comparison andunit test based assessment. In the first approach the functionality is checked by running the student’s code with test data and comparing its output to the expected output of a working model solution (e.g. TRY [107], ASSYST [63], Goblin9, RoboProf [32], BOSS [65], CourseMarker [60], Online Judge [23]). A typical way of implementing this is requiring the student to print computation results onto the standard output stream in a pre-specified format, and when the code is executed the produced character strings are matched against the set of expected output. In the other approach we drill the student code in a unit testing manner by calling parts of the code and comparing the results to the expected behaviour (e.g.Scheme-robo [114], BOSS [65], Ludwig [121], Javala [83], WebTasks [110]). In a sense, these correspond to the black box and white box (glass box) approaches in testing. In black box testing the test object is viewed as a black box that transforms input to output. We have no knowledge of the inner workings and testing is performed via examining the output generated in response to given valid and invalid input. In white box testing the tests are designed to exercise specific paths of the program fully aware of the internal structure. Therefore, white box testing can lead to more comprehensive tests but at the same time places restrictions on any later code restructuring or other changes. Similarly, the output comparison method allows for somewhat more freedom for students in the implementation details. Typically, each test data or test case set is designed to verify a specific aspect of the functionality, which is then expressed as feedback if a test fails. Similarly, grading or scoring can be based on the number of passed tests, which should reflect the extent of correctly implemented functionality.
Web-CAT [39] takes a somewhat different approach from the other systems. It implements a test-driven approach for automatic assessment. Students both write a program and unit tests for it themselves. The grade is based on three factors: test validity, test coverage and test results. Their tests are run against a reference implementation to assess validity, which is done by comparing the correct and
The advantages of fully automated web-based assessment systems are immediate feedback, the availability of the service regardless of time and place and the objectivity and consistency of assessment. Furthermore, teachers can concentrate on aspects of the curriculum that most require direct interaction with students as opposed to the tedious task of scanning through hordes of more or less trivial programming submissions. Besides its immediacy, automated assessment and feedback may also have other less apparent benefits. Odekirk-Hash and Zachary [99] carried out an experiment where one group of students did programming exercises with a tutoring tool and another group did the same exercises without the help of automatic assessment. Both groups had access to teaching assistants (TA). They observed that while both groups performed more or less equivalently in terms of spent time and in a subsequent test, those who received automatic feedback spent much less time asking questions from the TAs. This implies that automatic assessment can reduce the need for contact learning and hence in tandem with the freedom of time and place of a web-based solution facilitatedistance learning well. A related study comparing classroom exercises to automatically assessed exercises had similar results [74]. Also, TAs have more time for struggling students. In the discussion of their automated tools, Ala-Mutka and J¨arvinen [3] also note that a specific benefit of any, even rudimentary automatic assessment of programming assignments, is checking the format and contents of a submission. That is, even if the system may not flawlessly evaluate the correctness or quality of the solution, and some aspects have to be evaluated or proper feedback has to be compiled manually, there are significant gains with AA. They state that previously when submissions were done directly by e-mail 20 percent of all submissions had basic problems with content and form, such as, the program failing to compile. An important intrinsic property of automatic assessment is that in order to pro-grammatically implement automatic evaluation of an assignment the requirements must be formalized, which puts emphasis on proper design of assignments. So in theory, we come up with better thought out descriptions and specifications for the exercises. During the specification process, we might even gain more insight into the
the pedagogic and cognitive aspects of the assignment. Furthermore, formal require-ments result in consistent and impartial assessment, whereas manual graders often have differing views on good programming style and, more importantly, interpret evaluation criteria differently no matter how exact and unambiguous they might be according to one person.
Current AA systems invariably also incorporate submission management utilities that enable the tracking, monitoring and reporting of students’ progress with regard to the assignments [37]. This allows instructors to early identify students that are having problems or especially difficult subjects, and take action as needed.
Another didactic factor in the use of AA systems is the selection of an assessment policy, that is, how many times an assignment may be submitted for evaluation and how does this affect possible grading. This decision greatly affects the work-ing strategies that students adopt with AA systems. An argument for allowwork-ing a submission-evaluation type offormative feedback loop with unlimited or lots of available submissions instead of one-time summative feedback is that this lets a student incrementally improve their solution and, hopefully, to eventually come up with a correct mental model of the problem, thus, supporting constructivist learning. Students also get more individual feedback than is otherwise possible. The flip side is that this type of instant feedback may encourage them to submit often and with less consideration to the correctness of their solution, leading to a trial-and-error interaction with the system. Ala-Mutka and J¨arvinen [3] mention one approach to combating this problem: in order to force students to analyze their errors their systems only approximately point out the problem in a solution. This is obviously an issue of balance: how do we construct the feedback in such a way that it guides the students in a formative manner in the right direction and prevents them from getting stuck, while at the same time does not reveal too much and that way let them pass the evaluation with the proposed fix without really fully understanding the problem themselves. In addition to limiting the number of submissions, the issue can be mitigated by only allowing a resubmission after some minimum time has passed since the last one. The reasoning is that the student is forced to and will use this time to better understand the problem and the probable fix. However, the downside is that if the student is able to quickly come up with the correct solution based on the feedback he still has to wait for the timer to run out. Depending on the submission policy the use of AA may also have positive effects on student motivation. Malmi et al. [88] analyzed statistics on submissions of their automatically assessed algorithm simulation exercises during 9 years and found that while it appears most
erroneous submissions on a scale relative to their degree of correctness. On the other hand, on large courses where the teaching staff systematically uses rubrics in order to carry out consistent and objective mass grading of programming assignments, the quality of feedback can easily degrade in a similar fashion, as individual feedback is strictly constructed from a prearranged set of replies.
Another special issue with all systems that executeforeign code, that is, outside code not included by the system developers, is security. This was noted early on in the research of AA: Hollingsworth [61] reported that a problem with their automatic grader for programs written on punching cards was that the student programs could modify the grader itself which they then had to try to detect. Indeed, when run to evaluate dynamic behaviour, a student’s submission may inadvertently or intentionally cause undesirable effects in the AA system if it has not been carefully designed to address this problem. Damage can range from disclosure of private data to completely bringing down the system.
Plagiarism
Finally, a significant problem with all non-supervised electronic submission systems is of course plagiarism, that is, passing somebody else’s work as your own. Many studies have shown that cheating is quite commonplace among university students and this is something that must be taken into account in the design of an AA system. For example, Sheard et al. [122] surveyed two universities and 34%/28% of the respondents admitted that they had copied a majority of an assignment from a friend and 53%/42% had worked collaboratively on tasks intended individual. When we are not in full control of the environment where the exercises are done, this can never be fully solved but there are some ways to discourage this type of behaviour. For example, Shaffer [121] explains that in their online system programming assignments are meant to be written using their text editor which is implemented as a Java applet. The applet does not allow the student to paste data from the clipboard in the editor,
which is intended to restrict their ability to easily copy solutions.
While we cannot prevent someone from copying a solution by retyping it, we can try to detect plagiarism. The primary approach to detecting program copies ispairwise comparison [82]. The pool of programs is analyzed in pairs to find commonalities in them. For each pair we get an estimate of the degree of similarity between the programs. Those pairs that much resemble each other in terms of the properties we assume to define the similarity of programs are potential instances of plagiarism. The comparison can make use of various types of software properties. Early systems based the comparison on simple style and software metrics, such as, the number of assignment or loop statements, or the size of a program (e.g. [15,36,52,101]). For each program we get a tuple of these values called a feature vector the closeness of which in an n-dimensional space indicates similarity. The problem with even complex such numerical metrics is that most of the structural information is inevitably lost and, in fact, these types of metrics have been shown to be ineffective [82]. Obviously, another straighforward approach is to carry out different types of pattern and string matching on the character data. For example, in addition to exact duplicates, the Dup [9, 7,8] system attempts to find sections that have gone through systematic substitution but are otherwise equal in a process they call parametrized matching. Currently, the most effective systems are based on first transforming the code into a representative form of canonical string tokens which are then used as the basis for matching [82] (e.g.YAP3 [143], JPlag [104] and Plaggie [2]). These types of systems are not that easily fooled by simple lexical or structural transformations commonly used to try to hide plagiarism.
An obvious shortcoming of pairwise comparison methods is that they are prone to false positives the shorter the programs are. One can argue that with a language, such as, Python that is known for its clean syntax and use of whitespace as a meaningful syntactical element, this is even more likely to become a problem. Daly and Horgan [32] implemented an alternative approach based onfingerprinting student assignments with digital watermarking. They added in every assignment a unique identifier coded into the whitespace, for example, after a function definition given in the boilerplate code for the exercise. This contained information about the exercise and who it was given to. Therefore, if a submission contained the fingerprint from somebody else’s assignment it had been copied. The obvious drawback of this method is that the minute it becomes common knowledge it becomes useless because it is simple to just remove or not copy the whitespace. Surprisingly though, despite the authors’ attempt to discourage plagiarism by informing the students of a plagiarism
Design
3.1
System Goals and Constraints
In brief, we aim to create a tool for distributing small focused programming assign-ments effortlessly on introductory programming courses that are built around the Python programming language. Python is chosen because it will be the language used on future introductory programming courses at the Helsinki University of Technology. The purpose of the exercises is to gradually build students’ skills and confidence in programming and to ensure that they become well-versed in elementary programming before moving on to issues of program design and architecture in subsequent projects and courses. Our hypothesis is that this will also help reduce attrition. This is a direct response to students’ issues in introductory programming as described in Chapter2. It can be argued that such short programming assignments which generally have no real-world application context do not motivate students well. However, as discussed in Sections 2.1.3 and 2.2.3, the reality of it is that some things you just cannot learn but through repeated practice, and with a large set of smaller assignments we can cover a wider range of programs that target a variety of misconceptions and program mechanics than we could with full-blown programming assignments that each take up so much time that there can only be a few. After these types of smaller assignments that provide an efficient platform for practicing basic program reading, writing and tracing skills the focus should eventually shift in the direction of program architecture and composition with larger programming exercises.
Another related matter is the choice of pedagogy on a CS1 course. There is still an ongoing debate in the CSE community on whether the first programming course should start with an object-driven approach that focuses much more on abstract
the first place, or even effective for learning programming.” [115] – and suggests a paradigm where early object-orientation would be combined with a strong initial start in procedural programming [116]. Similarly in an empirical study on the use of BlueJ, which is a popular strictly object-oriented educational tool, on an introductory programming course the authors suggest that ”a minimal amount of imperative (procedural) programming initially would benefit the objects-first approach” [55]. Based on the review and discussion in Chapter2 to effectively support the learning of programming we set the following five primary goals for our tool. We present the arguments for selecting these goals below.
1. Facilitate the development of an accurate mental model of program state and execution through consistent automatically generated visualizations.
2. Aid in tracking down the causes of programming errors and possible underlying misconceptions with reversible visual source code level debugging functionality.
3. Provide automatically assessed programming assignments to enable and support the learning of programming, in the sense of actually writing code, by practice and repetition.
4. In achieving the goals 1-3 add as little overhead as possible to the actual process of writing program code.
5. Minimize the barrier to entry and facilitate wide adoption by implementing the system as an easy-to-use web application, which also allows it to be easily updated and distributed, and to fully support distance learning.
3.1.1 Goal 1 – Visualization
As discussed in Section2.1.1, at the center of learning to program is having an accurate understanding of what constitutes a program’s state and how a program is executed.
In Section2.2we described how beginning programmers generally have great difficulty in forming this understanding. Goal 1is a response to these observations and the general approach to achieving it is utilizing program visualization as discussed in Section2.3. Also, in Section2.2.1it was discussed that novice programmers do not seem to know how to read and trace actual written code. Ultimately, our goal is to aid in learning to read and write code so we limit our approach to visualizing written programs as opposed to the reverse approach ofvisual programming where programs are constructed visually from different types of diagrammatic representations and which is also commonly used to teach basics of programming. In terms of the task-oriented taxonomy of software visualization [87] described in Section2.3, the task is to support learning by facilitating program comprehension and debugging, the audience is beginning programmers, the target is the program’s source code and dynamic state, the medium is a regular color monitor, and the representation depends on how and what properties we choose to visualize as described later. As discussed in Section2.2.2the visualizations must illustrate how such elementary constructs as loops, conditionals, arrays, recursion and parameter passing affect the control and data flow of a program. We are to provide a visual representation of the execution that both conveys the principles of the concept well and still is exact in its representation so that it is a good basis for forming a viable mental model of the subject.
3.1.2 Goal 2 – Reversible Debugging
The visualization can also aid in reaching Goal 2 when it is tied together with debugging functionality. Here, reversible execution is paramount to help with the typical “what just happened” reactions of novice programmers. After all, in the beginning students do not fully understand even the basic building blocks of programs and it can be difficult to follow the progress of a program execution, so we should attempt to reduce the cognitive load by giving them the possibility of backtracking when they get lost. Students’ difficulties in debugging were discussed shortly in Section2.2.1. While it is commonplace in algorithm visualization systems, this type of stepping back in the execution is something that conventional debuggers lack and we feel is very important for being able to properly keep track of the changes in the state of a program. Especially if a tool uses dynamic animations, you are prone to miss something and should at least be able to repeat the last step, that is, review the visualization of the last execution step. Furthermore, while it is generally far less mentally demanding and therefore tempting for students to resort to a trial-and-error strategy in order to overcome a problem, the easily accessible debugging features