Towards AN Efficient Unsupervised
Feature Selection Methods
for High-Dimensional Data
A thesis submitted in fulfillment of the requirements for
the degree of Doctor of Philosophy
Naif Yousef A. Almusallam
M.Sc (Information Technology)Monash University, Australia B.Sc (Computer Science)
King Faisal University (KFU), Saudi Arabia
School of Science
College of Science, Engineering, and Health RMIT University
Melbourne, Victoria, Australia December, 2018
This work is dedicated to the secret behind my success
my parent (Yousef Almuslem and Layla Alshabibi), my wife Jana Alhawas, my little daughter Layla, my sisters (Sarah, Haalah, Mariam and Ghand) and my
Declaration
I certify that except where due acknowledgement has been made, the work is that of the author alone; the work has not been submitted previously, in whole or in part, to qualify for any other academic award; the content of the thesis is the result of work which has been carried out since the official commencement date of the approved research program; any editorial work, paid or unpaid, carried out by a third party is acknowledged; and, ethics procedures and guidelines have been followed.
Naif Yousef A Almusallam December 14, 2018
Acknowledgement
I thank and praise Almighty Allah for granting me the opportunity to undertake this research and giving me the strength, knowledge, and ability to persevere and complete it satisfactorily.
On my journey toward my Ph.D. degree over the past four years, I met not only challenges in work and life, but also many supportive individuals who gave me the confidence to overcome those challenges. I take this opportunity to thank everyone who gave me their valuable assistance during my Ph.D. study for their remarkable guidance and help. Without these people, the completion of this thesis would have been more difficult.
I would like to express my sincere gratitude and appreciation to several people for their kind support and inspiration. First and foremost, I would like to thank my senior supervisor, Professor Zahir Tari, who guided me to accomplish my research goals. His effective supervision, encouragement and continuous support has always kept me motivated during my Ph.D. studies. I would also like to thank my associate supervisor, Dr. Jeffrey Chan, for his advice, support and valuable comments. I would also like to thank my family: my father, Yousef Almuslem, my mother, Layla Alshabibi, my brother and my sisters who always gave me mental strength and courage. I am grateful for the sacrifices they made for me. I will never forget their daily contact with me. Their prayers always motivated me to successfully
v
achieve my goal.
A special thanks goes to my wife, Jana, and my daughter, Layla , who have been my constant companions throughout this journey. I thank them for the support, encouragement, patient and care that I continue to receive. They were the joy of my learning journey. I would like to thank my father-in-law, Fahad Alhawas, and mother-in-law, Maryam Alhawas for their appreciation and prayers. I am thankful to my colleagues, Dr. Abdullatif Al-abdullatif , Dr. Adil Al-harthi and Dr. Abdulmohsen Al-malwawi who helped me with suggestions and materials for my research. I would also like to express my gratitude to all my friends within and outside of RMIT university who directly or indirectly supported me throughout this journey. My appreciation goes especially to Ahmed Al-nuaim. We have been supporting each other since our language course in 2011, during our Master studies and then our Ph.D. journey. Also, many thanks go to my friend Dr. Mohammed Al-nuaim who welcomed me to Melbourne on my first arrival. He helped me a lot, picking me from Melbourne’s airport, organising the hospitality and so on. He really made my adaptation to the lovely Melbourne easier.
Last but not least, I would like to thank my scholarship provider, the Imam Muhammad ibn Saud university for giving me the opportunity to do complete my degrees and further my career. I hope this work will benefit the research community in this area of interest.
Credits
Portions of the materials used in this thesis have previously appeared or under consideration in the following scientific publications:
• N. Almusallam, Z. Tari, P. Bertok, A. Zomaya: Dimensionality reduction for intrusion detection systems in multi-data streams—A review and proposal of unsupervised feature selection scheme. Emergent Computation. Springer, pp. 467-487, 2017. -Chapter 3
• N. Almusallam, Z. Tari, P. Bertok, A. Zomaya: An efficient and Accurate unsupervised Feature Selection From High-Dimensional Data. Future Gen-eration computer systems. - (SJR Rank: Q1)- Submitted in August 2018 - Chapter 3
• N. Almusallam, Z. Tari, J. Chan, A. Alharthi: UFSSF-An Efficient Unsu-pervised Feature Selection for Streaming Features. Pacific-Asia Conference on Knowledge Discovery and Data Mining (PAKDD). Springer, pp.495-507, 2018. - (CORE Rank: A) - Chapter 4
• N. Almusallam, Z. Tari, J. Chan, A. Alharthi: An Efficient Unsupervised Feature Selection for Dynamic Features. IEEE Transactions on Knowledge and Data Engineering (TKDE) - (SJR Rank: Q1)- Submitted in Oct 2018 - Chapter 4
vii
• N. Almusallam, Z. Tari, J. Chan, A. Mahmood: An Online Unsupervised Feature Selection for Dynamic Views. Pattern Recognition. - (SJR Rank: Q1) - Submitted in Nov 2018 - Chapter 5
• Z. Tari, A. Thompson, N. Almusallam, P. Bertok, A. Mahmood: ”Micro-GRID: An Accurate and Efficient Real-Time Stream Data Clustering with Noise. Pacific-Asia Conference on Knowledge Discovery and Data Mining (PAKDD). Springer, pp. 483-494, 2018. (CORE Rank: A)
Contents
Declaration iii Acknowledgement iv Credits vi Contents viii List of Figures xi List of Tables xv Abstract 2 1 Introduction 3 1.1 Motivation . . . 41.2 Existing Feature Selection Problems . . . 6
1.3 Existing Solutions . . . 11
1.4 Research Questions . . . 14
1.5 Summary of Contributions . . . 16
1.6 Organisation of The Thesis . . . 20
2 Background 22
CONTENTS ix
2.1 Dimensionality Reduction . . . 22
2.2 Clustering-Based Methods . . . 27
2.3 Data-Driven Intrusion Detection Systems (IDS) . . . 30
2.4 Conclusion . . . 39
3 AUFS - Towards an Efficient and Accurate Unsupervised Feature Selection 40 3.1 Introduction . . . 41
3.2 Related Work . . . 45
3.2.1 Supervised Feature Selection Methods . . . 45
3.2.2 Unsupervised Feature Selection Methods . . . 46
3.3 Similarity Measures . . . 48
3.4 AUFS - The Proposed an Accurate and Efficient Unsupervised Fea-ture Selection Method . . . 51
3.4.1 The AUFS Method . . . 52
3.4.2 An Illustrative Example . . . 55 3.5 Experimental Setup . . . 56 3.5.1 Datasets . . . 57 3.5.2 Evaluation Metrics . . . 58 3.6 Experimental Results . . . 60 3.7 Conclusion . . . 67
4 UFSSF - An Efficient Unsupervised Feature Selection for Streaming Features 69 4.1 Introduction . . . 70
4.2 Related Work . . . 74
CONTENTS x
4.4 The UFSSF Method . . . 79
4.4.1 The Framework . . . 80
4.5 Experimental Evaluation . . . 83
4.5.1 The Datasets . . . 86
4.5.2 Evaluation Metrics . . . 87
4.6 Results and Analysis . . . 89
4.7 Conclusion . . . 101
5 OUDVFS: Online Unsupervised Feature Selection for Dy-namic Multi-Views 102 5.1 Introduction . . . 104
5.2 Related Work . . . 108
5.3 The Proposed OUDVFS Method . . . 113
5.3.1 The Framework . . . 115
5.4 Experimental Evaluation . . . 121
5.4.1 The Datasets . . . 124
5.4.2 Evaluation Metrics . . . 125
5.5 Results and Analysis . . . 126
5.6 Conclusion . . . 136
6 Conclusion 137 6.1 Future Work . . . 142
List of Figures
1.1 high-dimensional datasets in UCI repository (Bolon-Canedo et al. 2015) 4 1.2 Categorisation of feature selection problems from a data perspective
(Li et al.2017) . . . 7
2.1 An overview of the feature selection process . . . 23 2.2 Deviation of circle points (anomalies/outliers) from the normal
trian-gle ones . . . 31
3.1 Impact of non-representative features in classification accuracy . . . . 42 3.2 Comparison of clusters produced by the method proposed in [1] and
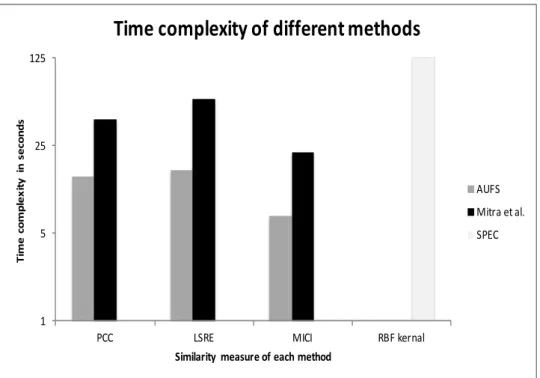
AUFS . . . 44 3.3 Average time complexity of different methods . . . 67
4.1 Framework of UFSSF process . . . 81
LIST OF FIGURES xii
4.2 Comparison of classification accuracy metrics of different methods on Waveform dataset. The average results of Naive Bayes, IB1 and J48 decision tree classifiers are computed. The first, second and third rows of the figure show respectively the results of the FPR, Precision and F-measure evaluation metrics. The columns of the figure show the results when considering different similarity measures. The x-axis denotes the percentage of streaming features while the y-axis denotes the corresponding accuracy metric . . . 92 4.3 Comparison of classification accuracy metrics of different methods on
Spambase dataset. The average results of Naive Bayes, IB1 and J48 decision tree classifiers are computed. The first, second and third rows of the figure show respectively the results of the FPR, Precision and F-measure evaluation metrics. The columns of the figure show the results when considering different similarity measures. The x-axis denotes the percentage of streaming features while the y-axis denotes the corresponding accuracy metric . . . 93 4.4 Comparison of classification accuracy metrics of different methods on
Ionosphere dataset. The average results of Naive Bayes, IB1 and J48 decision tree classifiers are computed. The first, second and third rows of the figure show respectively the results of the FPR, Precision and F-measure evaluation metrics. The columns of the figure show the results when considering different similarity measures. The x-axis denotes the percentage of streaming features while the y-axis denotes the corresponding accuracy metric . . . 94
LIST OF FIGURES xiii
4.5 Comparison of classification accuracy metrics of different methods on Waveform dataset. The average results of Naive Bayes, IB1 and J48 decision tree classifiers are computed. The first, second and third rows of the figure show respectively the results of the FPR, Precision and F-measure evaluation metrics. The columns of the figure show the results when considering different similarity measures. The x-axis denotes different numbers of selected features while the y-axis denotes the corresponding accuracy metric . . . 96 4.6 Comparison of classification accuracy metrics of different methods on
Ionosphere dataset. The average results of Naive Bayes, IB1 and J48 decision tree classifiers are computed. The first, second and third rows of the figure show respectively the results of the FPR, Precision and F-measure evaluation metrics. The columns of the figure show the results when considering different similarity measures. The x-axis denotes different numbers of selected features while the y-axis denotes the corresponding accuracy metric . . . 97 4.7 Comparison of classification accuracy metrics of different methods on
Spambase dataset. The average results of Naive Bayes, IB1 and J48 decision tree classifiers are computed. The first, second and third rows of the figure show respectively the results of the FPR, Precision and F-measure evaluation metrics. The columns of the figure show the results when considering different similarity measures. The x-axis denotes different numbers of selected features while the y-axis denotes the corresponding accuracy metric . . . 98
LIST OF FIGURES xiv
4.8 Comparison of different methods’ running time for three datasets. The first, second and third rows of the figure show the running times on Waveform, Spambase and Ionosphere datasets respectively . The columns of the figure show the results when considering different simi-larity measures. The x-axis denotes the percentage of arrived stream-ing features while the y-axis denotes the correspondstream-ing time (in
sec-onds) taken by the methods to select a set of features . . . 100
5.1 Healthcare application . . . 107
5.2 The framework of OUDVFS method . . . 116
5.3 Illustration of dynamic views proposed structure where instances are rows and features are columns. Each new chunk consists of new in-stances and an additional view . . . 122
5.4 Time complexity of different methods on Handwritten dataset . . . 134
5.5 Time complexity of different methods on Caltech-7 dataset . . . 135
List of Tables
2.1 Search strategies for subset generation . . . 24 2.2 Characteristics of clustering methods . . . 29
3.1 (a) PCC between the centroids and all the features vectors in the feature set. (b) Allocation of a feature to its most similar cluster centroid. . . 56 3.2 Standard Confusion Metrics for Evaluation of Normal/Anomaly
Clas-sification . . . 59 3.3 Classification accuracy using Water Treatment Plant dataset with
Naive Bayes . . . 61 3.4 Classification accuracy using Water Treatment Plant dataset with IB1 61 3.5 Classification accuracy using Water Treatment Plant dataset with J48
Decision Tree . . . 61 3.6 Classification accuracy using Spambase dataset with Naive Bayes . . . 62 3.7 Classification accuracy using Spambase dataset with IB1 . . . 62 3.8 Classification accuracy using Spambase dataset with J48 Decision Tree 62 3.9 Classification accuracy using PAMAP2 dataset with Naive Bayes . . . 62 3.10 Classification accuracy using PAMAP2 dataset with IB1 . . . 63 3.11 Classification accuracy using PAMAP2 dataset with J48 Decision Tree 63
LIST OF TABLES xvi
3.12 The Average Accuracy of Different Similarity Measures Used for Each Method . . . 65 3.13 The Average Classification Accuracy of Different Similarity Measures . 66
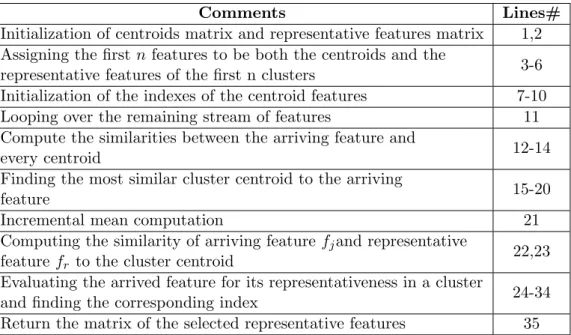
4.1 Characteristics of existing feature selection methods for streaming fea-tures . . . 75 4.2 The comments on the provided pseudo code in UFSSF algorithm . . . 83 4.3 Confusion matrix of the classification results . . . 88
5.1 Characteristics of existing multi-view feature selection methods . . . . 109 5.2 Summary of the proposed and benchmarked methods . . . 123 5.3 Classification accuracy (Recall) using Handwritten dataset with Naive
Bayes . . . 129 5.4 Classification accuracy (Precision) using Handwritten dataset with
Naive Bayes . . . 129 5.5 Classification accuracy (F-measure) using Handwritten dataset with
Naive Bayes . . . 129 5.6 Classification accuracy (Recall) using Handwritten dataset with IB1 . 129 5.7 Classification accuracy (Precision) using Handwritten dataset with IB1 130 5.8 Classification accuracy (F-measure) using Handwritten dataset with
IB1 . . . 130 5.9 Classification accuracy (Recall) using Caltech dataset with Naive Bayes130 5.10 Classification accuracy (Precision) using Caltech dataset with Naive
Bayes . . . 130 5.11 Classification accuracy (F-measure) using Caltech dataset with Naive
Bayes . . . 130 5.12 Classification accuracy (Recall) using Caltech dataset with IB1 . . . . 131
LIST OF TABLES xvii
5.13 Classification accuracy (Precision) using Caltech dataset with IB1 . . 131 5.14 Classification accuracy (f-measure) using Caltech dataset with IB1 . . 131 5.15 Classification accuracy (Recall) using Fox News dataset with Naive
Bayes . . . 131 5.16 Classification accuracy (Precision) using Fox News dataset with Naive
Bayes . . . 131 5.17 Classification accuracy (F-measure) using Fox News dataset with Naive
Bayes . . . 132 5.18 Classification accuracy (Recall) using Fox News dataset with IB1 . . . 132 5.19 Classification accuracy (Precision) using Fox News dataset with IB1 . 132 5.20 Classification accuracy (F-measure) using Fox News dataset with IB1 . 132
Abstract
With the proliferation of the data, the dimensions of data have increased sig-nificantly, producing what is known as high-dimensional data. This increase of data dimensions results in redundant and non-representative features, which pose challenges to existing machine learning algorithms. Firstly, they add extra pro-cessing time to the learning algorithms and therefore negatively affect their per-formance/running time. Secondly, they reduce the accuracy of the learning algo-rithms by overfitting the data with these redundant and non-representative fea-tures. Lastly, they require greater storage capacity. This thesis is concerned with reducing the data dimensions for machine learning algorithms in order to improve their accuracy and run-time efficiently. The reduction is carried out by selecting a reduced set of representative and non-redundant features from the original feature space so it approximates the original feature space. Three research issues have been addressed to achieve the main aim of this thesis. The first research task addresses the issue of accurate selection of representative features from high-dimensional data. An efficient and accurate similarity-based unsupervised feature selection method (called AUFS) is proposed to tackle the issue of the high-dimensionality of data by selecting representative features without the need to use data class labels. The proposed AUFS method extends thek-mean clustering algorithm to partition the features intokclusters based on different similarity measures in order to
accu-2
rately partition the features. Then, the proposed centroid-based feature selection method is used to accurately select those representative features.
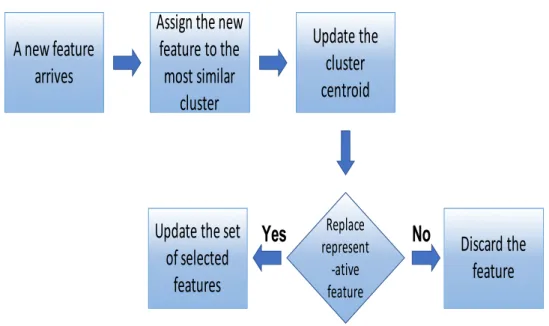
The second research task is intended to select representative features from streaming features applications where the number of features increases while the number of instances remains fixed. Streaming features applications pose challenges for feature selection methods. These dynamic features applications have the fol-lowing characteristics: a) features are sequentially generated and are processed one by one upon their arrival while the number of instances/points remains fixed; and b) the complete feature space is not known in advance. A new method known as Unsupervised Feature Selection for Streaming Features (UFSSF), is proposed to se-lect representative features considering these characteristics of streaming features applications. UFSSF further extends the k-mean clustering algorithm to incre-mentally decide whether to add the newly arrived feature to the existing set of representative features. Those features that are not representative are discarded.
The last research task involves reducing the dimensionality of multi-view data where both the number of features and instances can increase over time. Multi-view learning provides complementary information for machine learning algorithms. However, it results in high-dimensionality as the data is being considered from different views. Indeed, extra views would definitely result in extra dimensions. In particular, existing solutions assume that the number of the views is static; how-ever, this is not realistic when dealing with real applications as new views can be added. Therefore, an Onlline Unsupervised Feature Selection for Dynamic Views (OUDVFS) is proposed. As we are targeting unsupervised learning, we propose a new clustering-based feature selection method that incrementally clusters the views. The set of selected representative features is updated at each clustering step.
Chapter 1
Introduction
The number of dimensions (also called features) of the data has increased signif-icantly in various real applications such as healthcare, social media and online learning [2]. Figure 1.1 depicts the maximum number of dimensions/features of different datasets from 2008 to 2014 in the UCI repository. It shows that the num-ber of features varies from 857 to 3,231,961 which is a very high numnum-ber. Machine Learning (ML) methods have been widely applied to high-dimensional datasets for various learning tasks such as classification, clustering, pattern recognition and recommendation [3]. However, this increase in data dimensions would result in non-representative/irrelevant and redundant features as not all features would be relevant for the machine learning tasks. For example, an application for weather forecasting will have a feature space consisting of a few features such as humidity, temperature, wind and sensor ID. In this case, the sensor ID would mislead the learning task (i.e. overfitting the data) and consequently result in poor learning as the sensor ID is not relevant to the learning task. Note that in all chapters, the termsrelevant andrepresentative are used based on whether the learning is super-vised (i.e. requiring data class labels) or unsupersuper-vised (i.e. not requiring data class
Motivation 4
labels to select features). If the learning is supervised the term relevant/irrelevant is used. Otherwise, the term representative/non-representative is used.
Figure 1.1: high-dimensional datasets in UCI repository (Bolon-Canedo et al. 2015)
1.1
Motivation
The three major factors that play an essential role in ensuring that machine learning algorithms work efficiently in high-dimensional data are: classification accuracy, storage capacity and time complexity [4]. An efficient machine learning algorithm needs to learn from the data so that it is able to accurately classify it. It should store only representative features and not redundant ones. The learning process should be efficient in terms of running time. However, high-dimensional data is more likely to have redundant features as well as features that are not relevant to the learning task, resulting in extra memory usage (i.e. storage waste) and extra running time. Additionally, they would reduce the classification accuracy of the
Motivation 5
learning algorithms when using these irrelevant/non-representative features during the learning task. Hence, these non-representative and redundant features need to be removed and not included during the learning task.
Dimensionality reduction techniques have been proposed in order to remove the redundant and non-representative features to approximate the original feature space well. Therefore, the reduced feature space is used as input for machine learn-ing algorithms instead of uslearn-ing the entire feature space. The intuition is that the reduced selected set of features achieves better or similar results as those using the entire feature space [5]. There are two main approaches to dimensionality reduc-tion, namely feature extraction and feature selection [6] [7]. The former projects the original feature space into a new reduced feature space [7]. As methods of this approach transforms the original features into new features; however, they are not efficient for applications where the original features should be identified prior to further analysis [8]. Text clustering is a real application where the origi-nal text should be maintained for further learning. Also, feature extraction is not as efficient as feature selection in solving the problem of redundancy as redun-dant features might be included in the transformation phase [9]. Representative examples of such methods include, but are not limited to, Singular Value Decom-position(SVD) [10], Linear Discriminant Analysis (LDA) [11] and Deep Learning as in [12].
On the other hand, feature selection methods select a subset from the orig-inal features [13]. Therefore, feature selection methods are preferable and more interpretable for real applications such as text mining because data looses its in-terpretability if it is transformed into a new text. Feature selection can be carried out either by ranking the features based on particular criteria and adopting the top
pre-Existing Feature Selection Problems 6
defined threshold to determine the number of features [14]. The selected features should represent the entire feature space well and not contain redundant features. As a result, dimensionality reduction methods help machine learning algorithms by providing: a) better learning (e.g. better classification accuracy), b) better storage capacity and c) better time complexity. Examples of feature selection methods include but are not limited to Fisher Score (FS) [15], Laplacian score [16] and SPEC [17].
1.2
Existing Feature Selection Problems
There are several ways to organise and categorise existing feature selection prob-lems. For example, they can be categorised based on supervised or unsupervised problems. Another way is to categorise the problems based on the type of eval-uation criteria to filter or wrapper problems. However, with the era of big data, new feature selection problems have emerged when selecting features from new data perspectives such as heterogeneous data, linked data and streaming features application data [18]. In fact, each of these problems has its own characteristics. Therefore, Li et al. (2017) proposed a new categorisation for feature selection prob-lems that is based on the data perspective as shown in Figure 1.2. However, we further have extended that categorisation to also include multi-view data within the streaming environment, a problem which is addressed in Chapter 5.
There are various existing feature selection problems from different data per-spectives. Below, we first describe these problems and then summarise existing solutions and their limitations.
Existing Feature Selection Problems 7
Da
ta
Sta
tic
Ho
mo
ge
ne
ou
s
Da
ta
Tra
dit
ion
al
FS
wi
th
Fla
t
Fe
atu
res
FS
w
ith
Str
uc
tur
al
Fe
atu
res
He
ter
og
en
ou
s D
ata
FS
w
ith
Lin
ke
d D
ata
FS
w
ith
M
ult
i-So
urc
e D
ata
FS
w
ith
M
ult
i-Vie
w
Da
ta
Str
ea
mi
ng
FS
w
ith
Str
ea
mi
ng
Da
ta
FS
w
ith
Str
ea
mi
ng
Fe
atu
res
He
ter
og
en
ou
s D
ata
FS
w
ith
M
ult
i-Vie
w
Da
ta
Figure 1.2: Categorisation of feature selection problems from a data p ersp ectiv e (Li et al.2017)Existing Feature Selection Problems 8
Homogeneous Data
Homogeneous data suffers from redundant and non-representative features, which result in large volume and high-dimensional data. Therefore, it degrades the ac-curacy and the performance of machine learning algorithms [19]. In homogeneous data, both the number of instances and the number of features is fixed. Conse-quently, feature selection has been proposed to reduce the dimensionality of the data. Homogeneous data, in terms of data structure, can be grouped as flat fea-tures andstructured features [20]. Flat features, which are the focus of Chapter 3, are the traditional features where every feature is a column vector and every row is an instance. On the other hand, structured features are a special case of flat features where features form a structure (e.g. tree or graph). Therefore, apply-ing traditional feature selection methods [21, 22, 23, 24] which are designed for
flat features might ignore the structure and therefore result in the selection of non-representative features.
Heterogeneous Data
Traditional feature selection methods are designed to reduce the number of dimen-sions generated from a single source data. However, data can come from multi-ple sources, which brings additional challenges due to the increase in the num-ber of dimensions with redundant and non-representative features. Heterogeneous data faces three problems, namely linked data, multi-source data and multi-view data [25]. Feature selection methods designed forlinked data are limited to appli-cations where link information can be established [26]. An application example of
linked data is Twitter where link information (e.g. hyperlink) can be established between the tweets. Inmulti-source data, the same set of data instances can come
Existing Feature Selection Problems 9
from multiple sources while they have the same set of features. It is often used in gene applications [27].
In multi-view data, which is the focus of Chapter 5, data flows from heteroge-nous sources, which are called views in the literature, and therefore it is more likely to provide complementary information than single-view data [28]. Unlike multi-source data, each instance inmulti-view data is represented by different groups of features. In other words, different views are different representations of the same set of instances and each view is a group of features. For example, in medical applica-tions, patients (i.e. instances) may obtain different groups (i.e views) of laboratory tests (i.e. features) at different clinics. Therefore, performing feature selection on the views can lead to more precise medical diagnostic results. However, not all features in different views are representative and redundancy might occur between the views. Therefore, they would result in the problem of high-dimensionality.
Streaming Data and Streaming Features
Data streaming has become ubiquitous in real applications. However, data streams are more likely to have more redundant and non-representative features than do homogeneous data. Therefore, this would produce high-dimensionality. High-dimensionality presents a major challenge to the efficient performance of machine learning algorithms in data stream environments, as non-representative and redun-dant features decrease the prediction/classification accuracy and the running time of the learning algorithms. Data streams can be broadly classified into stream-ing data and streaming features [20]. In streaming data, the number of features is fixed, while the instances arrive sequentially. Regarding streaming features, how-ever, which is the focus of Chapter 4, the number of instances remains fixed, while the features arrive sequentially and are processed one by one. In real applications
Existing Feature Selection Problems 10
such as Twitter, features such as slang words are dynamically created and therefore need to be processed upon their creation instead of waiting for all features to ar-rive, as required by traditional feature selection methods. It is impractical to wait for the arrival of all features before starting the selection process is impractical, as the number of streaming features is unknown in advance and new features appear over time.
Data streams bring new challenges to traditional feature selection methods, which are methods designed for static data. Traditional unsupervised feature selec-tion methods [29,30,31] are not appropriate forstreaming features as the number of features changes with time and is not fixed compared with static data. They require the full feature space to be known in advance, which can be impractical in
streaming features. Technically, when applied to streaming features, they need to store large amounts of data. However, this can be infeasible due to the tremendous size resulting from the data streams. Traditional feature selection methods have greater computational complexity, which makes them inappropriate when working with high-dimensional streaming features as they require fast and real-time process-ing. Moreover, in streaming features applications, algorithms should read the data only once due to the finite amount of storage space, and then non-representative features should be removed to allow storage. Finally, traditional feature selection methods arestatic by nature, meaning that they do not dynamically update their selected representative features [32]. Therefore, this negatively affects the repre-sentativeness of the selected features. Hence, it is essential to consider the specific characteristics of streaming features when designing a feature selection method for such application.
Existing Solutions 11
1.3
Existing Solutions
The problems highlighted in red in Figure 1.2 are the ones that we are particularly interested to research as they are recent problems of research into feature selection methods. They introduce new challenges for traditional feature selection methods, which need to be addressed for real applications. Below, we summarise existing solutions to the highlighted problems.
Existing Feature Selection Methods for Homogeneous Data
Many feature selection methods [21,22,23,24] have attempted to address feature selection in homogeneous data. Although they reduce the dimensions of the data by filtering out redundant and non-representative features, most of them require la-beled data [26]. These are calledsupervised methods. Most of the high-dimensional data are not labeled, making existing methods unsuitable. The methods proposed in [1] and SPEC [17] are probably the two of the most well-known unsupervised methods(i.e. they do not require data class labels) used to select the representative features. However, they have accuracy and performance limitations. In terms of accuracy, the method proposed by Mitra et al. [1] partitions the feature space using
k-NN clustering. However,k-NN is inefficient when data is not dense as it produces low quality clusters [33]. Therefore, it is not suitable for high-dimensional data be-cause it is mostly non-dense data. Consequently, the classification accuracy will be low because of the badly selected representative features. On the other hand, SPEC [17] has not addressed the issue of feature redundancy because it evaluates individual features and does not consider redudancy, which would negatively affect the classification accuracy.
Existing Solutions 12
experience high computational time complexity. Because the method proposed in [1] uses k-NN, it inherits the computational issues of such an approach because it calculates the distance between k and all its neighbours. On the other hand, SPEC [17] also suffers from high time computational complexity as it is based on spectral graph theory, which is computationally expensive [34]. Although theses two methods can be applied to high-dimensional data, they experience computa-tional complexity.
Existing Feature Selection Methods for Multi-view Data
There are two ways to apply existing feature selection methods on multi-view data, namely indirect and direct approaches. In the indirect approach, all the views are concatenated into one single matrix. Then, traditional/single-view feature selection methods, which are not designed for heterogeneous data, can be applied on this single matrix. An example of such methods includes but is not limited to Fisher Score [35], sparse multi-output regression [36], Laplacian Score [16], SPEC [17] and Multi-Cluster Feature Selection [37]. However, this indirect approach of the aforementioned methods is inefficient for multi-view learning. This is because, by concatenating the views, these methods disregard the correlation among the data views (i.e. lacks of its physical meaning) which would result in an inaccurate representation of the features [38].
In thedirect approach, feature selection methods are designed to select features from multi-views data. There are a few well-known unsupervised feature selec-tion methods for multi-view applicaselec-tions such as AUMFS [39], OMVFS [40] and SRRS [41]. They were designed to tackle the problem of multi-view learning. In addition, none requires data class labels in order to select representative features. OMVFS is the only method that works in an online environment. However, these
Existing Solutions 13
methods assume that the number of the views is static. By static we mean that all the views are completely exist in advance and there are no new views that can be added. However, this assumption is not valid for real applications as new views can be added at any given time. Also, the number of instances can increase too (i.e online). To the best of our knowledge, this is still an open issue that has not been addressed.
Existing Feature Selection Methods for Streaming Features
Several studies have been conducted on feature selection in streaming features ap-plications. Perkins et al. [42] proposed a method, called grafting, which selects a subset of streaming features that have arrived so far as an integral part of a regu-larised learning process. It incrementally and gradually builds the selected subset of features in addition to training the predictive model using gradient descent. Be-cause it works in an incremental way, this method can efficiently cope with the dynamic nature of the streams. However, in order to specify a good regulariser parameter value, this method requires knowledge about the complete feature space in advance. Therefore, it cannot process streaming features of an unknown size. Alpha-investing [43] evaluates the relevance of the arrived feature based on a dy-namic threshold of error reduction (called p-value). In particular, the p-value is introduced to determine whether or not to add a feature to the selected set of features. Although Alpha-investing can process streaming features of an unknown size, no selected features can be removed. However, this can be an issue if the data stream experiences data drifts as the selected feature can no longer be represen-tative. Finally, Online Streaming Feature Selection(OSFS) was proposed in [44] to select relevant features and remove redundant ones in real time. Whenever a feature arrives, OSFS measures its dependency on the available class labels and
Research Questions 14
then adds the feature to the best candidate feature if this meets a specific criterion. OSFS can dynamically remove redundant features using the Markov Blanket.
The methods discussed above require the class label as a guide to select rep-resentative features. However, in real applications most of the data is un-labeled and, moreover, labeling is time consuming. To the best of our knowledge, the only method that is unsupervised (i.e. no labels are needed) and is applicable for streaming features applications is proposed in [45]. Although this method has good performance, it is limited to scenarios where link information must be es-tablished (i.e. a friendship relationship between Twitter users). Also, the authors assume that the link information is stable, which obviously is not true as this could dynamically change.
1.4
Research Questions
This section introduces the addressed research questions based on the limitations discussed in Section 1.3. There are three core research questions in this thesis and they are as follows:
(A) How to design an efficient and accurate feature selection for high-dimensional data without the need of data class labels?
This research question addresses the issue of how to reduce the data dimen-sions for better learning. In particular, it is concerned with how to accurately selecting a reduced set of representative features such that it approximates the original feature space. This set of features should not have any redundant or non-representative features. The significance is that an accurate selection of representative features would help machine leaning algorithms to perform more efficiently (i.e time complexity) and achieve better classification
accu-Research Questions 15
racy. There is a wide range of feature selection methods that have attempted to address this research question. However, when applied to high-dimensional data, they: a) require the data class labels to select the representative fea-tures; b) they experience high time complexity; and c) they are not accurate in selecting representative features. These limitations make existing solutions unsuitable for high-dimensional data.
(B) How to design an efficient feature selection for streaming features applications without the need of data class labels?
This research question concerns the way to apply feature selection for stream-ing features applications. Streamstream-ing features applications have specific char-acteristics, which are different from those of homogeneous data. The number of features can increase and is not fixed compared to homogeneous data. The full feature space is not known in advance and features arrive and are pro-cessed one by one in real-time. Additionally, the selection of representative stream features should be done in an acceptable running time as it requires fast and real-time processing. Moreover, in streaming features applications, algorithms should read the data only once due to the finite amount of storage space, and then non-representative features should be removed to allow stor-age. Feature selection methods for streaming features should dynamically update their selected representative features when new features arrive. Due to the nature of data streaming, most data are not labeled [32]. Therefore, these characteristics need to be taken into account when designing a feature selection method for such applications.
(C) How to design an online feature selection for multi-view data so that the views are dynamic and data class labels are not required?
Summary of Contributions 16
This research question addresses the issue of designing an online feature se-lection for dynamic views in multi-view data. Although multi-view data pro-vides complementary information for machine learning algorithms, it results in high-dimensional data. All existing multi-view feature selection methods assume that the number of views is fixed/static. However, this assumption is not true because in real applications, the same set of instances can be rep-resented by new views at any given time. Also, the instances can increase at any time. The challenge here is to select features incrementally where both features and instances increase over time. In addition, the selection of the features should be done without the need for data class labels.
The above three research questions can be integrated as follows. The first research question addresses the problem of feature selection in a static setting. We mean by static is that both the number of features and the number of instances is fixed. In the second research question, we address the problem of feature selection for streaming features applications where the number of features increase while the number of instances is fixed. In the last research question, we address the problem of feature selection of multi-view data where both the number of features and instances can increase over time.
1.5
Summary of Contributions
This section summarises the main contributions of this work in addressing the research questions. There are three main contributions that focus on reducing the data dimensions from three different data perspectives. The adopted reduction approach is feature selection because we want to select a set of representative and non-redundant features from the original feature space. Unlike feature extraction,
Summary of Contributions 17
feature selection approach does not project the features into new features and therefore it is more appropriate for real applications. In real applications, it is important to identify the features (i.e not to be transformed) for further learning and analysis.
1. Designing an efficient and accurate feature selection for high-dimensional data
Chapter 3 proposes an unsupervised feature selection method for high-dimensional data (called AUFS). To overcome traditional unsupervised feature selection methods, we proposed a feature selection method for high-dimensional data that: a) does not require data class labels in order to select the represen-tative features (i.e. unsupervised); b) is accurate in selecting represenrepresen-tative features. This results in improved classification accuracy; and c) does not re-quire any search for different subset of features. The result is a more efficient run-time. Technically speaking, we proposed a centroid-based methodology for selecting representative features from clusters. The features are parti-tioned into clusters based on different similarity measures. Then, a feature, which has a minimum distance to its cluster centroid, is selected from each cluster. AUFS was tested on real datasets. The following papers have been extracted from this contribution.
• N. Almusallam, Z. Tari, P. Bertok, A. Zomaya: Dimensionality reduc-tion for intrusion detecreduc-tion systems in multi-data streams—A review and proposal of unsupervised feature selection scheme. Emergent Com-putation. Springer, pp. 467-487, 2017. - Chapter 3
• N. Almusallam, Z. Tari, P. Bertok, A. Zomaya: An efficient and Accu-rate unsupervised Feature Selection From High-Dimensional Data.
Fu-Summary of Contributions 18
ture Generation computer systems. - (SJR Rank: Q1)- Submitted in August 2018 - Chapter 3
2. Designing an efficient feature selection for streaming features ap-plications
Chapter 4 proposes an unsupervised feature selection method for stream-ing features applications called UFSSF. UFSSF overcomes feature selection methods for streaming features by: a) selecting representative features with-out the need for data class labels; b) selecting representative features in real time as they arrive (the entire feature space is not known in advance and they arrive sequentially); and c) it is does not require link information in order to select representative features. Therefore, it is more applicable for a wider range of streaming features applications. The UFSSF method extends thek -mean algorithm to cluster a stream of features that are not known in advance. It integrates three linearly-dependent similarity measures, namely Pearson Correlation Coefficient (PCC), Least Square Regression Error (LSRE) and Maximal Information Compression Index (MICI), to incrementally measure the dependency of the newly-arrived streaming features to decide whether or not to add them to the existing set of representative features. The features arrive sequentially and they are processed upon their arrivals one by one in a real-time manner. Linearly dependent measures are used because they are not sensitive to the order and the scatter of the distribution of the features. Additionally, UFSSF incrementally updates the centroids to cope with con-cept drift in streaming features, as one feature might be representative only for a given time. After assigning a feature to its relevant cluster, the mean is updated and we compare the similarity of the arrived feature with the
exist-Summary of Contributions 19
ing representative feature of the cluster. UFSSF was tested on real datasets. We experimentally simulated the streaming features environment where the number of the features increases while the number of the instances is fixed. The following papers have been extracted from this contribution.
• N. Almusallam, Z. Tari, J. Chan, A. Alharthi: UFSSF-An Efficient Un-supervised Feature Selection for Streaming Features. Pacific-Asia Con-ference on Knowledge Discovery and Data Mining (PAKDD). Springer, pp.495-507, 2018. - (CORE Rank: A) - Chapter 4
• N. Almusallam, Z. Tari, J. Chan, A. Alharthi: An Efficient Unsuper-vised Feature Selection for Dynamic Features. IEEE Transactions on Knowledge and Data Engineering (TKDE) - (SJR Rank: Q1)- Sub-mitted in Oct 2018 - Chapter 4
3. Designing an online unsupervised feature selection for dynamic views
Chapter 5 proposes an online unsupervised feature selection method for dy-namic multi-views data (called OUDVFS ). The proposed OUDVFS over-comes existing multi-view feature selection methods in the following ways: a) it does not require data class labels in order to select representative fea-tures from dynamic views; b) unlike existing feature selection methods for multi-view data, the OUDVFS is more appropriate for real applications as it selects features where the views can increase over time (i.e dynamic views); and c) the instances increase as well (i.e.online). The OUDVFS consists of two parts: clustering and feature selection. The chunk can have new instances or new views. If the chunk has only new instances, OUDVFS incrementally clusters the new instances with the clusters resulting from a previous chunk.
Organisation of The Thesis 20
Similarly, when the chunk has a new view (i.e. set of features), the OUD-VFS incrementally clusters the new view with the clusters resulting from a previous chunk. This method relies on clustering to select features as it does not require the data class labels in order to group the data. Specifically, the OUDVFS relies on hierarchical clustering in order to merge the clusters to the required reduction of data dimensions. The selected set of representative features is updated at each clustering step. The OUDVFS was tested on real multi-view datasets and we experimentally simulated the increasing views and the increasing instances to simulate the real multi-view applications. The following paper has been extracted from this contribution.
• N. Almusallam, Z. Tari, J. Chan, A. Mahmood: An Online Unsuper-vised Feature Selection for Dynamic Views. Pattern Recognition. -(SJR Rank: Q1) - Submitted in Nov 2018 - Chapter 5
1.6
Organisation of The Thesis
The contributions of our research are addressed in six chapters including this In-troductory chapter. The remaining chapters of the thesis are structured as follows: • Chapter 2describes three main background components of the thesis, namely
dimensionality reduction, clustering-based methods and data-driven intru-sion detection systems. The integration of these three components facilitate a better understanding of the thesis.
• Chapter 3 proposes an efficient and accurate unsupervised feature se-lection method for high-dimensional data (AUFS). It extends the k-mean clustering algorithm with different similarity measures in order to partition
Organisation of The Thesis 21
the feature space. Then, a centroid-based feature selection method is pro-posed to accurately select a reduced set of representative features. In this chapter, both the number of instances and the number of features is fixed.
• Chapter 4proposes an efficientunsupervisedfeature selection for stream-ing features applications (UFSSF). It processes streamstream-ing features where fea-ture space in not known in advance. Rather, feafea-tures arrive one by one in real-time. The features are clustered incrementally and the selected set of fea-tures is updated dynamically. In this chapter, the number of instances is fixed while the number of features is dynamic.
• Chapter 5 proposes an online unsupervised feature selection method for dynamic views data. In multi-view data, the same set of instances is repre-sented by multiple views allowing a comprehensive look at the data. In this chapter, the number of views is dynamic, which means that new views can be added incrementally. Also, the number of instance increases in the online mode. Therefore, the set of selected features is updated dynamically. In this chapter, both the number of instances and the number of features is dynamic.
• Chapter 6 summarises the main contributions of this thesis. Also, sug-gestions are offered for future research work, which could be conducted for feature selection from various data perspectives.
The three core chapters (Chapters 3-5) are presented in a standalone and self-explanatory manner. Therefore, the relevant contexts including related work, de-scription of method, experimental results and discussion are presented in each of these chapters separately.
Chapter 2
Background
This chapter provides the necessary background which will enable the reader to better understand the various chapters of this thesis. It briefly describes and re-views the progress that has been made in three fields, namely Dimensionality Re-duction, Clustering-Based Methods and Data-Driven Intrusion Detection Systems (IDS). These three areas will hopefully provide the reader with a comprehensive background that will facilitate an understanding of the work carried out in this thesis.
2.1
Dimensionality Reduction
In the era of big data, the dimensions of data increases significantly. In particular, the number of features increases such that not all features arerepresentative for the learning machines. In addition, feature redundancy is more likely to occur. There are various challenges resulting from the existence of non-representative and redundant features in the data. Firstly, they reduce the accuracy of the data min-ing algorithms by misdirectmin-ing the classification and clustermin-ing tasks [46]. Also, the existence of the redundant and non-representative features would negatively affect
Dimensionality Reduction 23
the performance of the algorithms due to the large volume of data [47]. More-over, they increase the processing time of the data mining algorithms, which would result in very expensive complexity [48]. Furthermore, a large storage capacity is required to store the large volume of data [49]. Finally, the curse of dimen-sionality is a challenge for feature selection algorithms due to the sparseness of the data, which would deceive the mining algorithms by appearing to be equal in terms of the distance between them [50]. Consequently, various researchers have proposed feature selection as an efficient technique which would help to address the aforementioned challenges.
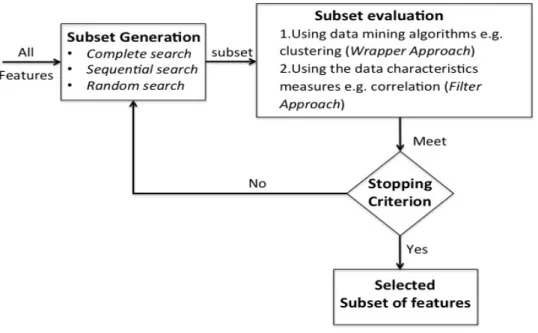
The feature selection process comprises (i) subset generation, (ii) subset eval-uation, (iii) stopping criterion and (iv) result validation [14]. This process is illus-trated in Figure 2.1.
Dimensionality Reduction 24
Subset generation searches for a set of features based on a particular strategy in readiness for the evaluation at the next step. The three main types of search strategy, in addition to their strengths and weaknesses, are illustrated in Table 2.1.
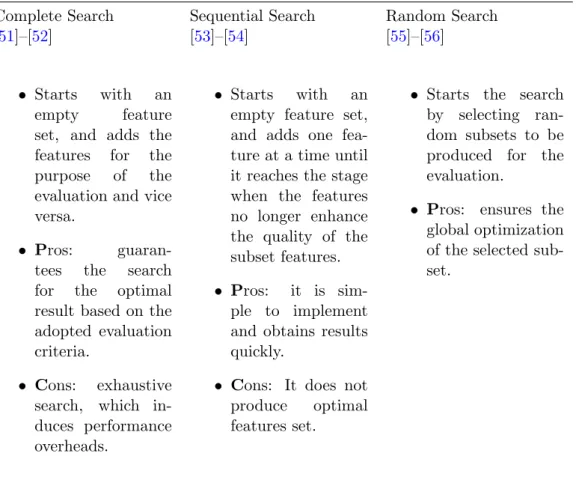
Table 2.1: Search strategies for subset generation Complete Search Sequential Search Random Search [51]–[52] [53]–[54] [55]–[56]
• Starts with an empty feature set, and adds the features for the purpose of the evaluation and vice versa.
• Pros: guaran-tees the search for the optimal result based on the adopted evaluation criteria.
• Cons: exhaustive search, which in-duces performance overheads.
• Starts with an empty feature set, and adds one fea-ture at a time until it reaches the stage when the features no longer enhance the quality of the subset features. • Pros: it is
sim-ple to imsim-plement and obtains results quickly.
• Cons: It does not produce optimal features set.
• Starts the search by selecting ran-dom subsets to be produced for the evaluation.
• Pros: ensures the global optimization of the selected sub-set.
Subset evaluation is the second step of the feature selection process, where every generated candidate features is evaluated for its quality based on a specific evaluation criterion [57]. Evaluation criteria are broadly classified into filter and
wrapper approaches whether or not the data mining algorithms are to be applied in the evaluation of the selected features [58]. The filter approach [59]–[60] relies on the general characteristics of the data to evaluate the quality of the generated can-didate features without involving any data mining algorithm. This includes, but is
Dimensionality Reduction 25
not limited to, distance, information, correlation and consistency measures. Filter-based algorithms have faster processing time than wrapper-Filter-based algorithms, as they do not include any data mining algorithm [61]. Conversely, the wrapper-based algorithms [62]–[63] require the use of specific data mining algorithms such as clus-tering in the evaluation process of the generated candidate features [64]. Despite the fact that the wrapper approach can discover better quality candidate features than does the filter approach, this incurs high computational overheads [49].
Subset generation and evaluation of the feature selection process is iteratively repeated until they meet the requirement of the stopping criterion. The stopping criterion is activated by the completeness of the search, a pre-set maximum itera-tion times or when the classificaitera-tion error rate is less than the pre-set threshold [65]. Then, the selected best candidate features are validated by conducting before and after experiment testing of different aspects such as classification error rate, num-ber of selected features, the existence of redundant / non-representative features and the time complexity [14].
Based on the availability of the class labels, feature selection methods fall into two categories: supervised and unsupervised. The former e.g. [21, 22, 23, 24] as-sesses the significance of a feature by computing the correlation to its class label. It is often difficult to have the data class labels, especially for high- dimensional datasets, as it would take experts a long time to test and label the data. There-fore, unsupervised feature selection methods e.g. [66, 67, 68, 69, 70] have been introduced as a solution to this problem. Such methods are much harder to de-sign due to the absence of data class labels, which guide them in the process of searching for finding the representative features. Initially, traditional unsupervised feature selection methods addressed the problem (of the absence of class labels) by ranking features independently based on certain scores. However, they are not able
Dimensionality Reduction 26
to generate the best features set, as they do not compute the correlation between features [69]. The second of the unsupervised feature selection methods e.g. [71,67] generally uses clustering to partition the features set into distinct clusters, where features in every cluster are similar to each other and dissimilar to the features of other clusters.
Feature selection methods, which are designed for static data, are not capable of efficiently working in data streams. This is because data streams have specific properties that do not exist in static data. A feature selection method should take into account the following properties in order to work efficiently in data streams. It should be restricted to read the data only once as it is impossible to store the entire stream. Also, it should take into account that many stream applications stream the features one-by-one and do not assume the existence of the entire feature space in advance (called dynamic feature space or streaming features). An feature selection method has to incrementally measure and update the representativeness of the features, as one feature might be representative in a timetbut not int+1 (concept drift) [72] [73]. Furthermore, it is not enough to reduce the feature space from the stream; the instances must be reduced as well because they usually contain great amounts of noise, redundancy and non-representativeness. Finally, a feature selection method should not be limited to data class labels; instead, it should be (unsupervised), as the data class labels are not available for most applications.
There are very few feature selection methods that work in data stream applica-tions. Every method contains some properties but not all of them. The OSFS [32] handles a stream of features one by one as they arrive. However, it requires the data to be labeled; it removes irrelevant/redundant features but not instances and only works for a single data stream. By contrast, Kankanhalli et al. [74] selects a subset of relevant features from multiple streams based on the Markovian decision
Clustering-Based Methods 27
problem. However, it requires the full feature space to be known in advance and the data to be labeled, and removes irrelevant/redundant features but not instances. Toshniwal et al. [75] developed an unsupervised feature selection method that does not require the data labels in order to select the non-representative features. It is designed primarily for the purpose of outlier detection. However, it does not handle stream features one by one as they arrive; it removes irrelevant/redundant features but not instances, and works only for a single data stream. Finally, the Zhang et al. [76] method incrementally measures and updates the relevance of the features in order to accurately evaluates their relevance. On the other hand, it requires the full feature space to be known in advance and is designed to work only for a single data stream.
2.2
Clustering-Based Methods
In this section we provide a brief description and categorisation of clustering meth-ods. Clustering is an approach whereby data points are grouped into different clusters, so that points within a cluster are very similar to each other and different from the data points of other clusters. Clustering methods do not require data class labels in order to partition the feature space and therefore they are widely used for unsupervised feature selection [77] [72]. As our proposed feature selection methods, described in Chapters 3, 4 and 5, are intended for unsupervised learning, clustering methods are used to select representative features without the need for data class labels. Clustering methods can be broadly categorised into partition-ing methods where data is portioned into groups based on similarity or distance, density-based methods where data is partitioned into groups based on the density of the data, hierarchal methods where groups data based on either agglomerative
Clustering-Based Methods 28
or divisive strategy, and grid-based methods where data is assigned to cells and clustering is performed on each cell. Table 2.2 provides a categorisation of these methods as well as their characteristics.
Clustering-Based Methods 29
Table 2.2: Characteristics of clustering methods Methods Characteristics
Partitioning [78]–
[79] •
Use mostly a distance-based, where the dataset is par-titioned into nparts, each representing a cluster with minimum data points.
• Each object is allocated to only one cluster. • Does not maintain any hierarchal structure.
• Adopts iterative relocation mechanism in the parti-tioning to produce “optimal” results.
• Works efficiently with small to medium size datasets. • k-means is an example clustering algorithm used as a
partitioning method. Hierarchical [80]–
[81] •
Clustering is maintained based on hierarchal decom-position of the dataset.
• It is either agglomerative or divisive decomposition. • Uses either distance-based or density-based.
• Clusters cannot be corrected when they have been merged or split.
Density-based [82]–
[83] • Has been defined under proximity-based methods. • Has good accuracy in detecting outliers.
• Capable of discovering clusters with arbitrary shape as it is based on density, not distance.
• DBSCAN clustering algorithm used as density-based algorithm.
Grid-based [84][85]–
[86] • The feature space is divided into a limited number of cells to form the grid.
• Clustering operations are performed inside the cells. • Has fast processing time, as complexity depends on the
Data-Driven Intrusion Detection Systems (IDS) 30
2.3
Data-Driven Intrusion Detection Systems (IDS)
Feature selection is a pre-processing step that helps to optimise the performance of machine learning algorithms in achieving their tasks. For example, when grouping the data into normal and outlier groups as in intrusion detection applications, the existence of redundant and non-representative features would reduce the accuracy of classifying the data points and would also increase the processing time. There-fore, feature selection is applied as a pre-processing step for IDS in order to increase the classification accuracy and reduce the running time. This section provides an overview of IDS as we used IDS datasets in Chapters 3 and 4.
There are various security mechanisms (e.g. firewalls, cryptography or access controls), which have been designed mainly to protect computer or information systems from malicious attacks. In addition to those security mechanisms, IDS has been developed as a second-line defence to discover attacks after they have been successfully launched [87]. IDS can be host-based (e.g. to monitor the logs),
network-based (e.g. to monitor the networks traffic flow) or data-driven (e.g. to detect any deviations from the normal pattern of the data), which is the focus of our interest.
Broadly, IDS is classified in terms of detecting intrusions into signature-based and anomaly-based [88]. The signature-based ID approach [89]–[90] discovers sus-picious behaviours by comparing them with pre-defined signatures. Signatures are patterns associated with attacks, which are verified in advance by the human ex-perts and used to trace any suspicious patterns. If the suspicious patterns and the signatures match, an alarm is activated to warn the administrators or to take a pre-defined actions in response to the alarm [84]. The algorithms that are signature-based ID are efficient in detecting known attacks with low false alarms and are
Data-Driven Intrusion Detection Systems (IDS) 31
reasonably quick to do so. Despite the fact that most existing commercial IDs are signature-based, most of them cannot detect new types of attacks (also called
un-known attacks), as their signatures are new and not known in advance [91]. Unlike the signature-based IDS algorithms, anomaly-based IDS algorithms [92]– [93] can identify new attacks because they “appropriately” model the ‘normal’ behaviour of a non-attacked system. They can therefore identify serious deviations from the normal profile to be considered as anomalies(also called outliers) [94]. Anomalies can emerge as a result of fraudulent behaviour, mechanical faults or attacks [95]. Figure 2.2 illustrates how the majority of the data points (triangle points) have a particular distribution, while the circle points have a significant deviation from the rest. The circle points are considered asoutliers.
Figure 2.2: Deviation of circle points (anomalies/outliers) from the normal triangle ones
Anomaly-based IDS techniques can be categorised under three approaches based on the form of the input data they use : supervised anomaly detection[96][97],
Data-Driven Intrusion Detection Systems (IDS) 32
semi-supervised anomaly detection[98][99] andunsupervised anomaly detection[100][101]. Supervised-based anomaly detection approaches require training data in advance along with their class labels for both normal and abnormal data, so as to accurately detect anomalies. The model is then trained with both classes and applied to un-labeled data to determine the class to which it belongs. Although there are plenty of classification methods that could be applied in this category, the classes of the data are un-balanced because the “normal class” is much bigger than the “anomaly class”, which therefore negatively affects the detection recall. Additionally, it is challenging to find accurate and representative data class labels, particularly for the anomalies, as they emerge periodically and they are uncountable [102]. On the other hand, semi-supervised anomaly-based detection approaches require only one class label, which is eithernormal oroutlier. The corresponding model is trained with the normal class only, and then any instance that does not belong to that class would be classified as an outlier. These approaches are much more applicable than supervised ones because they do not require the specification of anomalous behaviour. In addition, as the models for semi-supervised techniques could also be trained with anomaly class only, this provides substantial limitations because it is difficult to recognise all anomalies for the training of the data [103].
Both of the aforementioned approaches are limited as they rely on the avail-ability of labeled data. Hence, they are restricted for specific applications such as spacecraft fault detection and therefore they are not generic. On the other hand, the unsupervised anomaly detection approach is generic and widely applicable as it does not need the data to be labeled [104]. This approach assumes that the normal data has a pattern that is significantly different from the pattern of the outliers. For instance, the normal data should form groups with instances that are very sim-ilar to each other and different from the outliers. Although this approach is widely
Data-Driven Intrusion Detection Systems (IDS) 33
applicable, the related techniques experience a high rate of false alarms [105]. Anomaly-based ID can mainly be categorised into classification methods, sta-tistical methods, proximity-based methods and clustering methods. Classification methods [106][107] are supervised by nature, and they are applicable only if there are class labels in the training data. The classifier is trained with the labeled data and then applied for the testing of un-labeled data. The test data is then classified as an outlier if it is not classified as normal by the classifier. Classification methods seem to provide good accuracy in distinguishing between data and their related classes. Although such methods demonstrate good performance during the testing phase in comparison to the other methods, their detection accuracy depends on the accuracy of the labeled data [88].
Statistical methods [108][109] are another type of approach, which observe the activity of the data so as to create profiles representing acceptable behaviour. There are two kinds of profiles: current and stored profiles. The former regularly logs and updates the distribution of the data as long as the data is processed. Additionally, the data is assigned with an anomaly score by comparing them with the stored profile. If any anomaly score exceeds a pre-defined threshold, it is labeled as an outlier. Statistical methods do not need knowledge about labeled data or attack patterns in advance. Hence, they seem to be efficient in detecting recent attacks. On the other hand, it is difficult to establish a threshold that balances the occurrence of false positives and false negatives [110].
Proximity-based methods use distance metrics to calculate the similarity be-tween data. It assumes that the proximity bebe-tween an outlier and its nearest neighbour is different from its proximity to the remaining data. Such methods can be either distance-based or density-based. Distance-based methods [111][112] search for a minimum pre-defined number of neighbours of a data point within a
Data-Driven Intrusion Detection Systems (IDS) 34
specific range in order to decide its normality. The point is labeled as an outlier if the neighbours within the range are less than the pre-defined threshold. On the other hand, density-based methods [113][114] compare the density of data with its neighbour densities so to decide its normality. The point is labeled as an outlier if its density is considerably less than the density of its neighbours. Generally, the effectiveness of proximity-based methods varies depending on the adopted measure as it is challenging to ensure effectiveness in particular situations. Furthermore, proximity-based methods seem to be inefficient in detecting outliers that form groups and are close to each other.
Lastly, clustering methods [115][116] work in unsupervised mode to recognise patterns of un-labeled data by grouping similar instances into groups. They cluster data by examining their relationships with other clusters. Indeed, normal data are those data that belong to clusters that are dense as well as large. On the other hand, outliers can be identified based on the three assumptions [95]: 1) outliers are objects which have not been allocated to any cluster. In fact, the initial goal of clustering is to find clusters in particular, not the outliers; 2) outliers are objects that are far, in terms of measured distance, from their closest cluster centroids. Indeed, every object is given a score based on its distance to its closest cluster centroid and it should not exceed a pre-defined distance in order to be considered as normal. The limitation of this assumption is that outliers cannot be found if they have already formed a cluster. The aforementioned assumptions have a common limitation in that they seem to detect only individual outliers but not groups of outliers, which form clusters by themselves [102]. To overcome this limitation, 3) the last as

![Figure 3.2: Comparison of clusters produced by the method proposed in [1] and AUFS](https://thumb-us.123doks.com/thumbv2/123dok_us/380422.2542057/61.892.171.702.164.583/figure-comparison-clusters-produced-method-proposed-aufs.webp)