Copyright by
Carmen de las Mercédez 2015
The Dissertation Committee for Carmen de las Mercedez Certifies that this is the approved version of the following dissertation:
Patterns of Persistence of Latinas in Science, Technology, Engineering,
and Mathematics (STEM) Degree Programs:
A Mixed Methods Study
Committee:
Victor Saénz, Supervisor Richard Reddick Edwin Sharpe Angela Valenzuela Mark Daniels Margarita Arellano Aileen Bumphus
Patterns of Persistence of Latinas in Science, Technology, Engineering,
and Mathematics (STEM) Degree Programs:
A Mixed Method Study
by
Carmen de las Merc dez, B.A., M.A.
Dissertation
Presented to the Faculty of the Graduate School of The University of Texas at Austin
in Partial Fulfillment of the Requirements
for the Degree of
Doctor of Philosophy
The University of Texas at Austin
May 2015
Dedication
This dissertation is dedicated to my mother, my first teacher, who taught me early in my life to love mathematics and who taught me the value of a good education. She would remind me often, that she left her country, her husband and all that she loved to save me from a life in communism; my duty was to live the American dream and make her sacrifice “worth it”. As a Cuban refugee, she struggled much to survive in a country so foreign to her; her work ethic lives on in me. She is the voice in my head, always pushing me farther. To my five children and aspiring scientists, Austin (physics), Skyler (engineering), Jordan (chemistry), Mackenzie and Madison (yet to be determined, but mom thinks it will be pre-med and mathematics!), thank you for supporting me through this educational journey. I love you all so much; you were my strength and motivation through it all. To Eliza Marrotta, my 5th grade teacher, who took the time to notice me, who believed at a very young age, and taught me to believe in myself--thank you! To Dr. Stephan, Dr. Sullivan, my Upward Bound Director, and Dr. Garbe, my favorite BYU mathematics professor and to Dr. Mark Daniels and Dr. Efraim Armendariz, my two most favorite UT-Austin mathematics professors. To all my past teachers, professors, and academic mentors---thank you for pushing me onward and for making a difference in my life, and finally to my students, past, present, and future… I dedicate this dissertation.
Acknowledgements
Pursuing (and obtaining!) a PhD has been a lifelong dream---something a young, Cuban refugee from a single-parent home like me never thought could be made into a reality. My life has been filled with many challenges, but also with so many blessings. The road to my PhD has had many bumps and detours, but without the love and support of my family and friends, it would never have been possible..it truly DID take a “village”!
First and foremost, I thank my Father in Heaven for granting me the strength needed to persevere when I thought I had nothing else to give; for sending me guardian angels and surrounding me with loving friends and family throughout my educational journey. Thanks also to my family who have been a strong support system through it all. To my sons Austin, Skyler and Jordan, my aspiring scientists, I admire your inner strength and passion for learning. To my daughters, Mackenzie and Madison may you too find a passion and love of math and science and never shy away from showing your competence in these areas. Mami, yo sé que estas en el cielo, vigilándome, gracias por tu grán ejemplo y apoyo. Gracias por todos tus sacrificios y por enseñarme desde niña a valorarme por mi misma. Permaneces en mi mente y en mi corazón. Le doy gracias a Dios por ti.
To my DREAM TEAM – my committee—mi familia académica--Dr. Victor Saénz, Dr. Richard Reddick, Dr. Edwin Sharpe, Dr. Angela Valenzuela, Dr. Mark Daniels, Dr. Aileen Bumphus, and Dr. Margarita Arellano. Needless to say, I had no idea what a HUGE favor I was asking each of you in being part of my dissertation committee. Each of you has made a strong impact on my life and I thank you from the bottom of my heart for your love and support through this PhD journey. You have been my mentors,
my exemplars to follow; I have literally stood on the shoulder of giants and feel so honored to have you on my team. Dr. Saénz, from our first phone call (when you called to personally let me know that I was accepted into the PhD program at UT-Austin) to endless late night emails and numerous conversations on ways to improve upon my study—eres my “campión” para siempre! You are in my heart forever and I will be your greatest admirer forevermore. My debt to you for your countless hours of dedication may never be repaid, but I will die trying. To Dr. Reddick, who has taught me much about good qualitative work and has always supported me in thought, word and action, I thank you. To Dr. Sharpe, I love you dearly. Thank you for your one-on-one’s and your gentle, loving nature; I have learned so much from your words of wisdom and your example. To Dr. Valenzuela, I admire your strength and your willingness to raise your voice and bring difficult conversations to the table such as subtractive schooling; you have been a powerful voice for those who often go unheard. I look forward to partnering with you on future projects. To Dr. Daniels, who truly exemplies what mathematics teaching and learning should look like at the university level---I am grateful for all that I have learned from you. To Dr. Bumphus, you know the special place you hold in my heart; you have been my academic mother, my guardian angel through some of the most challenging times in my life, something that I will forever cherish and remember. To Dr. Arellano, who early in graduate school took me under her wing and affirmed within me my resolve to pursue a PhD. Another amazing academic mother and guardian angel in my life, gracias mil, Doctora Arellano, por su gran ejemplo, apoyo y cariño. You are in my heart forever--I feel so blessed to know each of you---you have truly made a difference in my life, and I promise to pay it forward.
Thanks also all other faculty and staff in PHEL, Dr. Somers, Dr. Ovando, Dr. Holmes and Dr. Gooden –each of you has been influential in my life and I am better for
knowing you. To Hortensia Palomares and Linda Overton who have answered my silliest questions and have literally held my hand through it all. Thank you from the bottom of my heart! To Helen, Heidi, and Anne Steele who have helped me with my TA questions, and of course to my HEASPA peeps—you totally ROCK!
To my DDCE family, from Dr. Vincent who has been my rock and strong source of support through it all (and who gave me a good “work out” through challenging me in Equity and Access and Higher Ed Law courses to professionally). Thank you for being there for me in so many ways---I’m loyal to you forevermore. To Dr. Leonard Moore, who taught me that if I do what I love, I will never work a day in my life. Thank you for sharing your passion and love of learning to us all. To Charles Lu, who has been a true friend even when I drove him crazy; your willingness to “be there” for me on numerous occasion will always be appreciated. To Tiffany Tillis, my sister and wonderful friend, thank you for your strength and for believing in me. To Dr. Guraraj, Dr. James Brown and Dr. Darren Kelly, you ROCK (and Dr. Brown, no one makes physics seem “cool” like you!). To my academic daughters, Veronica, Oneidi, Katelyn and recently “adopted” Lauren thanks for being on my research team I love you all dearly and am so grateful for ALL of your hard work--without you, I would still be transcribing! To Elena Payne-Weins, Dr. Chen, and Dr. Russell Hodges (from Texas State University) you are always in my heart, even though we are far apart. To Katie Pritchett who has been my right arm in so many ways---thank you….I owe you much…SO happy to have you as my academic sister. To Heather Elias and Tina Jackson, thanks for “being there” like no one else could be. To Anthony, Martin, Neil, Devin, Ashley, Aurora, Diane, Ryan, Stella, and Dallawrance thank you for putting up with my O.C.D. To the Project MALES team (new and old), thanks for guiding me through the research process Dr. Bukoski, Sarah Rodriguez, Claudia Louis, and Milly Lopez, we are hemanas para siempre. To
Kye-Hyuong Lee who stepped in with her keen statistics skills to ensure my statistical analyses were dead on----and stepped up to answer questions when I needed her most, many, many thanks! I will always be grateful! To Dr. Smita Ruzicka my first contact at UT PHEL who met with me to discuss what to take/not take my first semester, to Robert Penman, who stepped in to help with formatting just in the nick of time.
Finally to both my UT and non-UT friends such as Ravi, Juan, my old BYU bestie, Kenneth Gonzalez, Sarah Harris Braisel, Patricia Hernandez, Sara Hernandez, Cathy Watson, Katherine Garrett, and all my “superheros and heroines” along the way— thank you. You put up with me and stuck with me even when I hid in my little cocoon--. I’m certain I have inadvertedly forgotten someone, please forgive me and know that each one of you has made a difference in my life. Now, it’s my turn to change the world!
Patterns of Persistence of Latinas in Science, Technology,
Engineering, and Mathematics (STEM) Degree Programs:
A Mixed Methods Study
Carmen de las Mercédez, Ph.D. The University of Texas at Austin, 2015
Supervisor: Victor B. Saénz
The U.S. demographics are changing, with Latinos leading the nation in population growth. Meanwhile, reports of a nation lacking a strong STEM (Science, Technology, Engineering, and Math) workforce flood the media. With claims that the fastest growing careers will require some sort of mathematical, technological or scientific training, it is not surprising that national attention has been focused on increasing the number of STEM graduates through policies such as The America Competes Act (2007) and initiatives such as Race to the Top (2014). Trends in postsecondary enrollment are changing; Latina/o enrollment has increased, with many Latinas/os choosing a STEM major upon entry, but failing to persist to graduation in these degrees.
An increased body of research has focused on minorities in STEM, Latinas/os in higher education, and STEM graduates, yet the literature specific to Latinas in STEM fields is lacking. Latina females outnumber males in postsecondary enrollment and graduation, yet few enroll and even fewer graduate in STEM fields. The limited number of Latinas seeking careers in STEM thus raises questions about why Latinas fail to enroll
in STEM majors and what needs to be done to increase their enrollment and persistence in STEM careers. As such, this study will conduct a thorough analysis using a mixed methods approach to examine the factors and experiences that can positively impact enrollment and persistence for Latinas seeking STEM careers.
Table of Contents
List of Tables ……….xiv
List of Figures ………xvi
Chapter 1: INTRODUCTION...1
Problem Statement ...7
Purpose of Study ...10
Research Questions ...11
Contribution and Significance of the Study ...12
Methodology ...12
Definitions of Key Terms ...15
Scope and Limitations of the Study ...17
Limitations of Study ...17
Delimitations ...19
Overview of Study ...19
Summary ...20
Chapter 2 REVIEW OF THE LITERATURE ...22
Review of Relevant Research Literatures ...22
Theoretical Framework: Community Cultural Capital and Its Impact on Persistence...57
Theoretical Framework I: Community Cultural Wealth ...58
Theoretical Framework II: Women of Color and Science Identity ...65
How Science Identity Impacts Persistence for Latinas in STEM majors ...67
How Community Cultural Wealth Impacts the Development of Science Identity………...70
Summary ...74
Chapter 3 METHODS...77
Research Design...78
Overview of the Study ...81
Quantitative Methods ...99
Qualitative Methods ...117
Validity Concerns ...122
Researcher Positionality...128
Summary ...133
Chapter 4 QUANTITATIVE RESULTS ...135
Counting on Change: What the Numbers Say ...145
Science Identity Constructs...152
Additional Findings ...167
Summary ...171
Chapter 5: QUALITATIVE RESULTS...177
Participant Backgrounds ...177
Amber: “I don’t consider myself a scientist.” ...178
Elena: “Science Is So Much Fun.” ...181
Faith: So, it’s a weird. Engineers aren’t very friendly. ...183
Laura: “I think for me, it was like I can’t fail I have to be like I have to do but I have to do it, my way.” ...184
Luna: “Well, I’m really nosy, I hate to admit it, like when I was a child I wanted to know how things worked… so I don’t know if that’s being a scientist.” ...185
Monica: “Learn what you want to learn, but you need to give it back at the end of the day and you need to be helping people with it.” ...186
Vicky: “ I actually get told a lot that I look Asian [so] I feel like a lot of people think I’m Asian and maybe because of that they probably don’t judge me as bad as like if I was Mexican… [so] it’s okay for [me] to be here you know.” ...190
Why Testimonios ...190
Discussion ...191
Summary of Chapter 5 ...236
Chapter 6: DISCUSSION AND RECOMMENDATIONS ...234
Connecting the Dots ...250
A Call To Action ...263
Implications……….... 266
Transforming Undergraduate STEM Education Programs……….… 271
Limitations and Delimitations………. 282
Recommendations and Future Research………. 284
Researcher Reflections...287
Appendix A Variables ...296
Appendix B Background/Intake Questionnaire ...299
Appendix C Codebooks ...302
Appendix D Sample Focus Group Questions ...330
Appendix E Sample Interview Questions ...332
Appendix F Participants’ majors ...334
Appendix G Student survey ...335
Appendix H GeoFORCE Demographics ...344
Appendix I Invitation to Participate in Study ...347
Appendix J Corrrelation tables and Scree Plots ...354
Appendix K Testimonios of Participants……….…………356
List of Tables
Table 3.1 Study Design ...80
Table 3.2 Research Design Model, Phases I thru III ...81
Table 3.3 Research Design Model, Phases IV thru V ...84
Table 3.4 Research Design Model, Phases VI ...85
Table 3.5 STEM Degrees Conferred by College, Level, Ethnicity/Race and Gender Academic Year 2012-2013 – at PWI in central Texas ...90
Table 3.6 Bachelor’s Degrees Conferred by College, Selected Areas of STEM-related Studies and Gender, 2012-2013 – PWI in central Texas ...92
Table 3.7 Target Population by the Numbers, Fall 2014, 12th class day ...94
Table 3.8 Underrepresented Ethnic and Female Undergraduate Student Enrollment, School of Engineering, 12th Class Day, Fall 2013 ...96
Table 3.9 TIP Scholars, Hispanic Females, Juniors, and Seniors, as of Fall 2014, 12th class day ...97
Table 3.10 Quantitative Research Question Matrix ...108
Table 3.11 Sample Survey Items and Relationship to Theoretical Frameworks ...110
Table 3.12 Sample Survey Questions ...111
Table 3.13 Constructs Extracted from Exploratory Factor Analysis ...115
Table 4.1 Cross-tabulation of Participants by Race and Gender...137
Table 4.2 Frequencies of Participants, by Major Breakdown ...138
Table 4.3 Cross-tabulation of Participants by College Major and by Gender ...139
Table 4.4 Demographics of Participants by Major, College GPA, SAT Composite and Year in School...140
Table 4.5 Demographics of Participants Parent’s Income Levels & Highest Level of Education ...141
Table 4.6 Cross-Tabulation of Parental Income Levels, By Race ...142
Table 4.7 Parental Level of Education Frequencies and Percentages ...145
Table 4.8 Community Cultural Wealth Aspirational Capital Factor Loadings and Communalities ...147
Table 4.9 Means and Standard Deviations on Community Cultural Wealth: Aspirational Capital ...148
Table 4.10 Community Cultural Wealth Familial Capital Factor Loadings and Communalities ...149
Table 4.11 Removed Variables from Community Cultural Wealth Familial Capital Factor Loadings and Communalities ...150
Table 4.12 Means and Standard Deviations on Community Cultural Wealth: Familial Capital ...151
Table 4.13 Community Cultural Wealth Navigational Capital Factor Loadings and Communalities ...152
Table 4.14 Means and Standard Deviations on Community Cultural Wealth: Navigational Capital ...153
Table 4.15 Science Identity Development Factor Loadings and Communalities (Science)
...157
Table 4.16 Science Identity Development Factor Loadings and Communalities (Math) ...157
Table 4.17 Means and Standard Deviations on Community Cultural Wealth: Latina Science Identity-Competence ...158
Table 4.18 Science Identity Development Factor Loadings and Communalities- Competence...160
Table 4.19 Means and Standard Deviations on Community Cultural Wealth: Latina Science Identity-Recognition ...161
Table 4.20 Science Identity Development “Recognition” Factor Loadings and Communalities ...163
Table 4.21 Means and Standard Deviations on Community Cultural Wealth: Latina Science Identity-Performance ...165
Table 4.22 Science Identity Development “Performance” Factor Loadings and Communalities ...167
Table 4.23 Reliability Information for Community Cultural Wealth and Science Identity Constructs ...168
Table 4.24 Constructs: Means and Differences of Latinas, standardized ...169
Table 4.25 Financial Consideration Factor Loadings and Communalities ...170
Table 4.26 Means and Standard Deviations on Community Cultural Wealth: Latinas’ Financial Considerations ...171
Table 4.27 Level of Satisfaction with Math/Science Community Factor Loadings and Communalities ...172
Table 4.28 Means and Standard Deviations on Community Cultural Wealth: Latinas’ Satisfaction ...173
Table 5.1 Participant Demographics, Qualitative Results...189
Table 6.1 Frequencies and Descriptives of Quantitative Findings ...246
Table 6.2 Mixed Methods Research Design Results...257
Table 6.3 Goals and Agenda for Transforming Undergraduate Education in Science, Technology, Engineering, and Mathematics Programs ...279
List of Figures
Figure 1.1.STEM enrollment by race/ethnicity and sex. ...2
Figure 1.2. Percentage of Bachelor’s degrees conferred to women in the U.S., by major (1970-2012). ...4
Figure 1.3. Latina Bachelor Degrees in STEM Fields 2012. ...5
Figure 1.4 Sequential Mixed Methods Design QUANT QUAL...15
Figure 2.1 Model of Community Cultural Wealth. ...59
Figure 2.2 Theoretical Framework for Science Identity. ...69
Figure 2.3 Conceptual Framework for the Study ...74
Figure 3.1 Sequential Mixed Method Design QUANT QUAL ...79
Figure 4.1 Parental Income Levels of Participants ...143
Figure 4.2 Parental Levels of Education ...144
Figure 6.1 Sequential Mixed Methods Design QUANT QUAL...244
Chapter 1 Introduction
The U.S. Department of Labor predicts that by 2018, 9 out of the 10 fastest careers will require some type of mathematical, technological or scientific training (National Science Board, 2010). In fact, the U. S. Department of Commerce (2010) claims that “STEM jobs are the jobs of the future,” (p. 1). The National Action Council for Minorities in Engineering (NACME, 2010) predicts employment opportunities in STEM will triple the rate of other fields within the next ten years. Recent reports claim that STEM careers are projected to grow by 17% between 2008 and 2018 compared to 9.8 % for non-STEM majors with STEM workers averaging 26% percent higher wages than non-STEM majors. STEM degree holders also tend to earn higher wages than their non-STEM counterparts (U. S. Department of Commerce, 2010). Yet, the number of U.S. graduates in science, technology, engineering, and mathematics (STEM) fields has reached critical levels of attrition (Chen, 2013). This paradox of high demand but low supply of STEM workers has brought national attention to the goal of increasing the number of students seeking STEM careers (U.S. Department of Commerce, 2010; National Science Foundation [NSF], 2006).
Pursuing science-related careers provides opportunities for social and economic mobility, especially for students of color (Russell & Atwater, 2005). Historically, students of color have struggled to find success in mathematics and science courses, leaving these fields for the nation’s elites (AAAS, 1998). Taking into account the
growing Latina/o population, recruiting STEM majors from this population (and graduating them) is key to remaining competitive in global markets (NACME, 2010).
Figure 1.1. STEM enrollment by race/ethnicity and sex. Adapted from Riegle-Crumb and King, 2010.
STEM enrollment by race, ethnicity and sex reflect a clear gender gap amongst all races, but particularly amongst Hispanic males and Hispanic females (see Figure 1.1, STEM enrollment by race/ethnicity and sex, p. 4). Recent studies show enrollment of Latinas/os into four-year institutions in STEM fields are similar to that of their peers, yet Latinas/os persist at lower rates than their counterparts (Anderson & Kim, 2006). In 2006, the Latina/o population was 44.3 million people; this accounted for 15% of the entire U.S. population (NSF, 2009). From 2003 to 2013, Latina/os were the fastest growing population in STEM awards (over 117.4 percent), increasing the number of
0% 5% 10% 15% 20% 25% 30% 35% 40% White Male White Female Hispanic Male Hispanic Female Black Male Black Female 30% 13.10% 33.90% 12.70% 35.50% 15.90%
STEM-related degrees from 19.0 to 30.2 percent (THECB, 2014). Excelencia in Education (2015) reports an increase in the Latina/o population from 13 percent of the population in 2004 to 17 percent of the population in 2012—an increase of over 9 million people. Latina/o enrollment in postsecondary education was the second highest of all racial/ethnic groups. In fact, over 16% of undergraduate students are Latina/o [NCES, 2013]. In 2013, 22 percent of Latina/os ages 25 and over earned an associate degree or higher with Asians reportedly at 60 percent, Whites at 46 percent and African Americans at 31 percent. The number of Bachelor degrees conferred to Latinos increased 63 percent, with 3.1 million Latina/os earning Bachelor’s degrees as their highest degree in 2013 (Excelencia, 2015). Despite efforts to increase the number of Latinas/os seeking bachelors’ degrees in STEM fields, the National Action Council for Minorities in Engineering (NACME) found that out of 74,387 Bachelor degrees granted in engineering, only 3 percent (2,189) of bachelor degrees in 2009 were granted in STEM fields to underrepresented female populations (NACME, 2010).
Considering gender, national statistics show that women outnumber men in Bachelor’s degree attainment in several majors, but continue to be underrepresented in several STEM-related majors, earning 3 percent of all bachelor degrees, 1 percent of all master’s degrees, and 1 percent of all doctoral degrees earned in STEM (Excelencia, 2015, p. 19).
Using race as a lens, Excelencia (2015) reported that of all bachelor degrees earned by Latinos in 2011-2012, Latinas earned 45 percent of degrees conferred in mathematics, 21 percent of degrees in engineering, and 19 percent of degrees conferred
in computer science. As Figure 1.2 indicates, women continue to be underrepresented in three specific STEM majors: mathematics, engineering and computer science (Excelencia, 2015). In fact, in computer science classes, men will outnumber women as
Figure 1.2. Percentage of Bachelor’s degrees conferred to women in the U.S., by major (1970-2012). Adapted from NCES (2013); Olson, R.S. (2014).
much as 8 to 2 (20% women) (NCES, 2013; Olson, 2014). From 2001 to 2010, the number of Latinas graduating with degrees in physical science increased from 414 to 563, yet these numbers represent less than 1% of all graduating Latinas; only 620 Latinas earned doctoral degrees in science or engineering in 2010 (NSF, 2011). Excelencia in
57% 9% 16% 2% 7% 9%
Latina Bachelor Degrees in STEM Fields 2012
Biological and Biomedical Sciences Computer and Information Sciences Engineering
Engineering Technologies Mathematics and Statistics Physical Sciences
Education (2015) reports that “in 2011-2012, 8 percent of all women earned bachelor’s degrees in STEM compared to Whites (61%), Asians (14%), African Americans (9%), and other groups (7%)” (p.19).
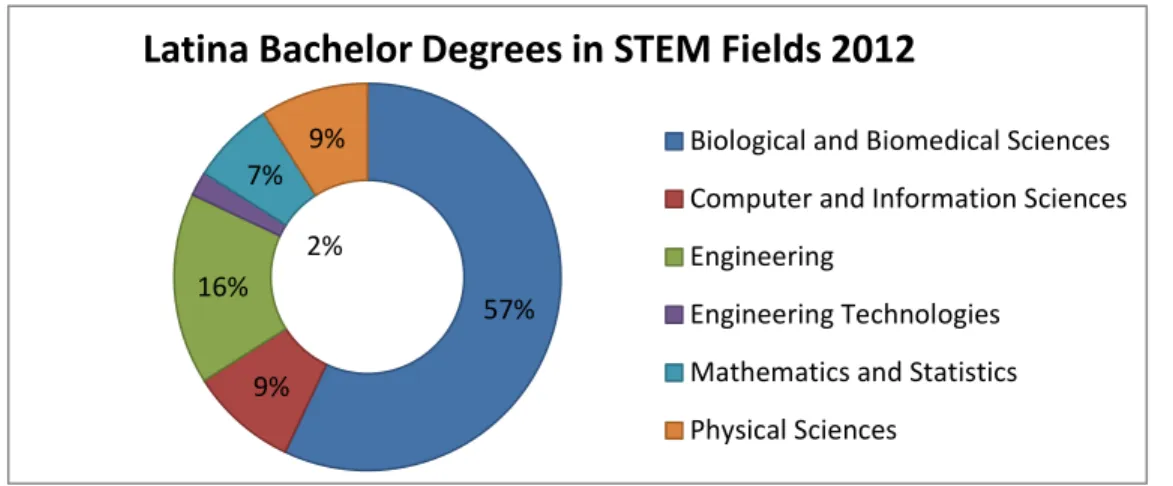
Figure 1.3. Latina Bachelor Degrees in STEM Fields 2012. Adapted from Excelencia in Education, 2015.
Specifically, Latinas earned more bachelor degrees in biological and biomedical sciences than other STEM fields. Of all Latinas with degrees in STEM in 2011-2012, 57% had degrees in biological and biomedical sciences, 16% in engineering, 9% in computer and information sciences, 9% in physical sciences, 7% in mathematics and statistics, and 2% engineering technologies (Excelencia, 2015).
As Figure 1.2 (see page 8) indicates, Latinas earned 60% of all bachelor degrees conferred to Latinas in 2011-2012, but only 37 percent in STEM majors (Excelencia, 2015). In fact, only 5 percent of Latinas have jobs in science or engineering related fields compared to Whites (70 percent) and Asians (19 percent) (Excelencia, 2015; NSF, 2014). Statistics such as these indicate significant leaks along the educational pipeline (NACME, 2010; NSF, 2009; Suarez, 2003).
Various policymakers, scholars, and national leaders have raised awareness about the importance of increasing the number of skilled science, technology, engineering, and mathematics (STEM) workers in the United States (Dancy, 2010; Fries-Britt, Younger, & Hall, 2010; Guess, 2008; Moore, 2006; Museus, Palmer, Davis & Maramba, 2011; Palmer, Davis, Moore, & Hilton, 2010; Palmer, Davis, & Thompson, 2010). In 2007, President Bush launched the “American Competitiveness Initiative” to ensure and maintain a well-developed workforce in STEM fields. The intent of this initiative was to increase participation and persistence in STEM, particularly for minorities and women who enter STEM (Flores, 2011). President Obama quickly followed with a national campaign seeking qualified students to meet the nation’s current and future needs of the global marketplace with the “America Competes Act” (President’s Council of Advisors on Science and Technology [PCAST], 2012).
According to the Organization for Economic Cooperation and Development, “the United States ranks 27th among developed nations in the proportion of college students receiving undergraduate degrees in science or engineering [STEM degree programs]” (p. 70). Thus, the need to increase the STEM workforce in the U.S. persists, especially among the fastest growing group of students, Hispanics.
As the nation seeks ways to develop a robust STEM workforce, answers to questions related to why Latinas fail to enroll or enroll then leave STEM majors persist. While significant research has been done on STEM students and women of color in STEM, there is little known on what it takes for Latinas to persist in STEM fields. For
this reason, identifying the factors and experiences that impact persistence1 of Latinas
seeking STEM degrees is essential to increasing the number of Latinas pursuing STEM careers (Suarez, 2003). Multiple research studies have shown a strong correlation between high school, college GPA, standardized test scores and persistence college (Al-Hattami, 2015; Cohn, Cohn, Balch, & Bradley, 2004; Kuncel, Credé, & Thomas, 2007; Kuncel, Hezlett, & Ones, 2004; Russo, 2014). Family support, teachers, as well as internal factors such as drive and determination are strongly connected to student persistence in college (Crisp, et al., 2009; Irvine, 1990; Russell & Atwater, 2005; Yosso, 2005).
However, since high schools use a different GPA scales, while others do not use GPA at all, this study used college GPA as reported by institutional data and levels of satisfaction, as reported via the online/paper survey as an proxy for persistence (Russo, 2014). Other measures such as satisfaction with academic advising, courses, and professors will also be used to create a dummy variable satisfaction. Research studies have shown that college GPA and satisfaction have strong, positive associations with persistence (Al-Hattami, 2015; Cohn, Cohn, Balch, & Bradley, 2004; Kuncel, Credé, & Thomas, 2007; Kuncel, Hezlett, & Ones, 2004; Russo, 2014).
Problem Statement
Latinas/os continue to be the largest and most rapidly growing ethnic minority in the United States (Cárdenas & Kerby, 2012; Gándara & Contreras, 2009). In fact,
1 Persistence-the firm continuance in a course of action in spite of obstacles or difficulty (Webster, 2014).
For the purposed of this study, persistence in STEM is defined as declaring a STEM-related major and continuing to remain in the specified major through graduation.
between 2000 and 2010, “the Hispanic population grew by 43 percent, rising from 35.3 million in 2000 to 50.5 million in 2010” (U.S. Census Bureau, 2010, para. 3). The U.S. Census Bureau (2010) reported more than half of the growth in the total U.S. population between 2000 and 2010 was due to the increase in the Hispanic population alone. Yet, only half of all Latina/o students graduate from high school—even less enroll in postsecondary education (Gándara & Contreras, 2009). While other ethnic groups have gradually increased their college graduation rates, Latinas/os have failed to progress for the last three decades (Gándara & Contreras, 2009). In fact, data on Latina/o graduation and persistence show that many Latinas/os remain stalled at high school completion levels for decades (Gándara & Contreras, 2009). Reports from the Bureau of Labor Statistics (BLS, 2012) showed that Latinos are “less likely to drop out of high school than they were in 2000” (Fry & Taylor, 2013, p. 10). Still, the absolute number of Latinos dropouts has risen (Fry & Taylor, 2013). In the year 2000, “only 49% of Hispanic high school graduates immediately enrolled in college the following fall” (Fry & Taylor, 2013, p. 4). By 2012, 69% of Hispanics2 of graduating seniors immediately matriculated (Fry
& Taylor, 2013). Subsequent reports show positive trends in Hispanic college-going patterns (Fry & Taylor, 2013). For the first time in history3, Latinos (69%) surpassed
whites (67%) in immediate enrollment in postsecondary education (Fry & Taylor, 2013).
2 Please note: The term Hispanic will be used interchangeably with Latina/Latino to maintain the integrity of the authors, especially since most government/official documents use the term Hispanic to refer to the Latino population comprised of individuals from Mexico, Cuba, Puerto Rico, South or Central America, or other Spanish culture or origin regardless of race, which we are referring to throughout this document.
Despite changing trends in high school graduation rates, most fail to persist in postsecondary education (Anderson & Kim, 2006; Valenzuela, 1999).
Data collected on Latina/o degree attainment shows only 10% of Latinas/os between 25 and 29 years of age earned a bachelor’s degree in 2009 (Cerna, Pérez, & Sáenz, 2009; Ryan & Siebens, 2012). Experts claim a major national catastrophe is inevitable should current trends continue (Gándara & Contreras, 2009; Sáenz & Ponjuan, 2009). Gándara and Contreras (2009) stated: “Never before have we been faced with a population group on the verge of becoming the majority …that is also the lowest performing academically” (p. 18).
Research on high school girls reveal that many “perceive themselves as less proficient than boys in mathematics, even with comparable performance (Correll, 2001; Riegle-Crumb & King, 2014, p. 658). Latina females outnumber their male counterparts in both enrollment and graduation, while Latino males continue to “vanish” from postsecondary institutions (Saenz & Ponjuan, 2008, p. 54). Latinos males who do enroll in higher education were three times more likely to pursue a STEM-related major than their female counterparts (Riegle-Crumb & King, 2010). Unfortunately, Latino males fail to persist (Saenz & Ponjuan, 2009). Studying women seeking STEM careers, particularly Latinas at the undergraduate level, is critical to changing practice and improving access to STEM careers.
Educational researchers have documented Latina underachievement for years (Flores, 2011). Multiple studies show that many Latinas experience an education that is remedial, unchallenging, and void of personal relevance; these educational inequities
significantly impact their opportunity to excel in academic contexts (Friere & Macedo, 1987; Flores, 2011; Kozol, 1991; McPhail, 2011; Noguera 2003; Oakes, 1985).
Using a strength-based model4, this dissertation seeks to fill a significant gap in
the current research by seeking answers to questions related to what factors lead to Latinas’ enrollment and persistence in STEM careers. For the purpose of this study, Latina persistence in STEM is defined as students who declare a STEM major, and remain in a STEM major throughout their postsecondary studies and plan to graduate in a STEM major. This study explores what factors and experiences impact persistence, using a sample of Latinas enrolled in STEM majors at a Predominantly White Institution (PWI) research university in central Texas. Many studies reflect the incongruence between PWIs and racial minorities; many claim PWIs stifle students’ of color participation and persistence in STEM majors (Bonous-Hammarth, 2000; Chang, Cerna, Han & Saenz, 2008). Since this study seeks to identify how Latinas overcome barriers and persist in STEM majors, understanding ways they negotiate (or refuse to negotiate) aspects of their own identity is imperative; thus, a PWI in Texas was the ideal location for this study.
Purpose of Study
The limited number of Latinas seeking careers in STEM has raised important questions about why Latinas fail to enroll in STEM careers and what needs to be done to increase their enrollment in STEM courses and persistence of STEM careers (PCAST,
4 Strength-based model-shifts the focus from “what is wrong” and causal factors/attempts to “fix”
inequities or problems to a focus on working relationships, empowering individuals to impact change, collaborate and draw upon personal resources to overcome obstacles. It does not ignore difficulties, but it identifies a positive resource base to address challenges (Hammond, 2010).
2012; U. S. Department of Commerce, 2010). This study investigated how the following seven factors influenced the development of a science identity that ultimately lead to Latina persistence in STEM careers: (1) pre-college experiences, (2) student perceptions, (3) participation in STEM-related activities, (4) campus culture, (5) familial and cultural factors, (6) teacher-student interactions, and (7) community cultural wealth. Taking a closer look at these factors will help inform scholars and practitioners on what it takes for Latinas to enroll and persist in STEM majors.
Through a series of semi-structured interviews, focus groups, and quantitative data collected through an online survey, this study unraveled the factors that impacted persistence for Latinas pursuing STEM careers. Ultimately, the purpose of this study was to determine what factors impacted persistence for Latinas seeking STEM careers.
Research Questions
To better understand the college experiences that support Latinas in STEM careers, the proposed study was guided by the following research questions:
1. What patterns5 and influences impact Latinas’ persistence in STEM fields? 2. In what ways do Latinas’ pre-college/college math/science experiences impact
their science identity?
Here, the first question was addressed primarily through quantitative methods, while the second question was answered qualitatively through pláticas and testimonios conducted
5For the purpose of this study, patterns will refer to the combination of characteristics, beliefs, actions
throughout the course of this study. These two overarching questions guided the study and provided a way to identify what it takes for Latinas to persist in STEM majors.
Contributions and Significance of the Study
Significant research has been done on minorities in STEM, Latinas in higher education, women in STEM, and STEM graduates, and women of color in STEM, yet there is little known on what it takes specifically for Latinas to persist in STEM fields. Herein lay the significance of this study.
This study produced a more thorough analysis of what it takes for Latinas to select a STEM major and remain in the major through graduation by combining both quantitative and qualitative data. Additionally, through sharing the testimonios and experiences of Latinas who have been successful in their pursuit of STEM careers, the author hoped to inspire other Latinas to follow in their footsteps and accept the challenges of pursuing careers in historically male-dominated fields. Findings from this research study identified (a) what pre-collegiate and collegiate factors and experiences influenced the decision to seek and persist in STEM majors, (b) the role of family and other factors (e.g. community cultural wealth) in the development of science identity, (c) how these influences impacted Latina enrollment and persistence in STEM majors; additionally, this study contributed to the lacking body of mixed methods persistence research in the higher education setting.
Methodology
This study used a QUANTQUAL research design. Using this methodology, quantitative data was collected first using the online survey followed by the qualitative
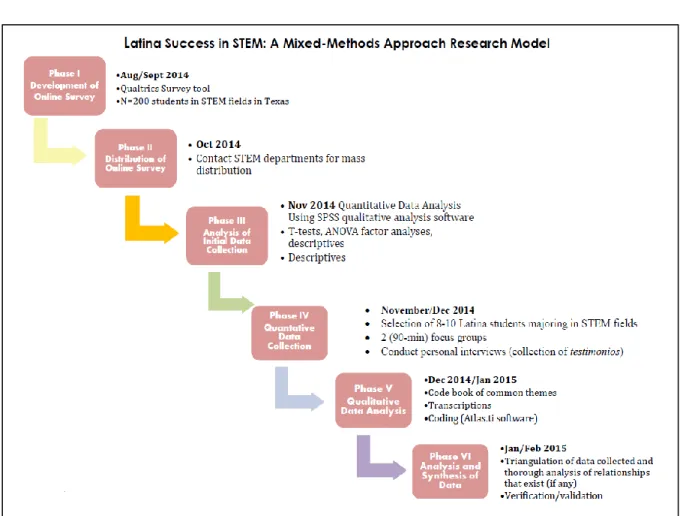
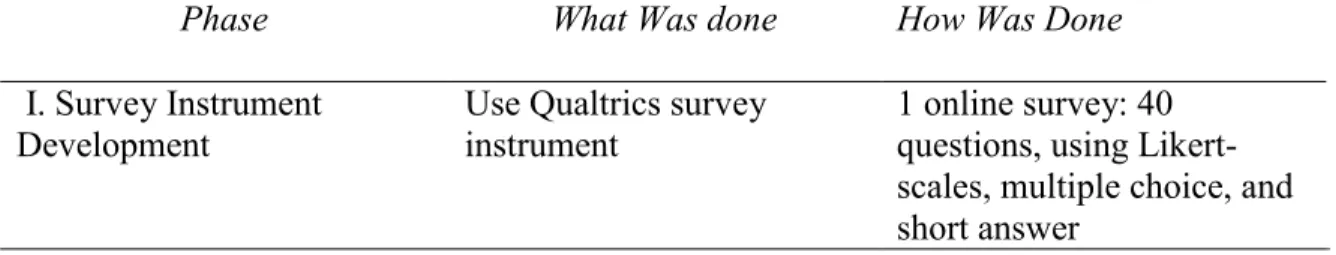
data using testimonios and pláticas (see Figure 1.1. Latina Success in STEM: A Mixed Methods Approach Research Model, p. 15). Based upon prior literature on persistence in STEM, various factors were examined to determine whether similar patterns of persistence emerged for Latinas in STEM and their STEM counterparts. Data was collected related to overall high school GPA, SAT/ACT scores, courses taken, and college GPA via an online survey; this data was then verified using institutional data. ACT scores were converted to estimated SAT scores using the ACT concordance chart which collected both quantitative and qualitative data. Familial income level and socio-economic status (SES) were also disclosed, along with parental levels of education. Descriptive statistics were run along with several factor analyses to compare results between Latinas and the rest of the sample population. Randomizing samples were used to detect average differences in the effects of particular variable (e.g. parental level of education, SES, GPA). Math and science perceptions were also measured using Likert scales. Due to limitations on the collection and type of data available, a variety of tests were conducted using Statistical Program for Social Sciences (SPSS), including scree plots and Bartlett’s to assess the validity and statistical power of the results. Since this author was attempting to fill a specific gap in the research—factors that impacted persistence for Latinas in STEM—a focus on course-taking patterns and the interactions between these patterns, student GPA, and student perceptions were included in this study. The qualitative side of the research used testimonios to collect personal stories from eight Latinas majoring in STEM; data was collected via focus groups (pláticas) and individual interviews (testimonios). Using testimonios, the life experiences that shaped each
participant’s decisions to pursue careers in STEM was recorded with common themes identified and coded. Testimonios from the participants were collected in an effort to impact future Latinas entering STEM careers to help them shape and secure their own academic success in STEM careers. All focus groups and interviews were recorded and stored for confidentiality purposes via a password-protected file. Finally, since sophomores, juniors and graduating seniors in STEM are the primary data source for the study, qualitative data was analyzed using Dedoose software and triangulated to ensure validity of the conclusions. This study sought to fill a specific gap in the research---determining what factors and experiences contributed to Latinas persistence in STEM—a mixed methods approach provided the most comprehensive analysis of these issues.
This study used a sequential mixed methods QUANTQUAL to answer the two overarching research questions. It was conducted in a six-stage process. Figure 1.4, Sequential Mixed Methods Design, reflects a visual model of the six phases of the study as well as the timeline of the study. Both theoretical models were used to design the instrument based upon the HSLS:09, College Senior Survey, and Social Capital Survey (with permission) items. For each subsequent phase, special consideration was taken to consider aspects of each theoretical model to help interpret the data collected. As Figure 3.1 displays, Phase I – Instrument design; Phase II – Quantitative data collection; Phase III – Quantitative data analysis; Phase IV- Qualitative data analysis; Phase V-Qualitative data analysis; and Phase VI-Synthesis. This study hopes to have a profound effect on informing its readers on the nature of the crisis developing related to lack of women, particularly Latina females, in STEM fields.
Figure 1.4. Sequential Mixed Methods Design. QUANT QUAL. This figure illustrates the six phases of the research process that will be utilized in this study.
Definitions of Key Terms
The following list and definition of key terms can be used to facilitate discussions of this paper:
Latina(s) - participants who identify as female and Hispanic and/or Latina (i.e. from Mexico, Cuba, Puerto Rico, South or Central America, or other Spanish culture or origin regardless of race). (U.S. Bureau, 2010).
Non-STEM Fields – any and all fields not list in the STEM Fields list (compare to list on page in this report
Self-efficacy – the self-perceptions of an individual about his/her ability to perform/excel (Bandura, 1982; Hutchinson et al., 2006).
STEM attrition rate – the number of STEM leavers divided by the total number of STEM entrants
STEM entrance – the point at which student reports or declares a STEM major
STEM Fields – Science (Biology, Chemistry, Physics and their variations), Technology (Computer Science), Engineering (varied types), and Mathematics. A detailed list of fields designated as STEM, see page 18.
STEM leavers – a subgroups of STEM entrants who leave STEM fields by switching their major to a non-STEM field or leaving postsecondary education without earning a degree or certificate
STEM persisters – a subgroup of STEM entrants who remain in STEM fields or majors until graduation. Students who do not graduate in STEM field but continue
to enroll in STEM major in subsequent semesters are also defined as STEM persisters.
Scope and Limitations of the Study
Participants for this study were selected from a predominantly white, Tier I research institution in Central Texas. Phase I of the study includes a sample of 200 juniors, seniors and graduating students in STEM fields who were identified were willing to participate in an online or paper survey. Data collected from this survey was analyzed using SPSS to examine what patterns and influences impacted persistence in for students seeking STEM careers. Students from a variety of STEM majors were selected for this study in order to have a control group to compare responses between the control group and Latinas’ in STEM. Following the initial data collection from the online survey, Phase II of the study involved selecting 7 undergraduate Latinas and one recent graduate to participate in a focus group and individual interviews. The intent of the qualitative phase of the study was to collect testimonios or personal stories of Latinas who have persisted in their respective STEM majors. A cross-section of majors was studied to identify patterns and influences for students majoring in STEM careers.
Limitations of Study
Limitations of this study are many. The major limitation of the study was its data collection process. Initially, purposeful sampling was used for both the qualitative and quantitative data collection phases. However, finding only 20 respondents for the online survey after two weeks of its release, this researcher opted to use snowball sampling (discussed in greater depth in Chapter 3 of this study) and convenience sampling. Using
the latter two approaches severely impacted the validity and generalizability of the data collected based upon current research standards (Biernacki & Waldorf, 1981; Faugler, & Sargeant,1997; Shafie, n.d.). No weighting was attempted to adjust for the sampling bias introduced through snowball sampling, nor was a linear regression was attempted since the data collected was deemed an inadequate representation of the population without used of weighted measures. Instead of a linear regression, only frequencies and descriptives were shared, with the mean differences and standard deviations of Latinas compared with the other participants in this study. Additional limitations:
1. First, there will be a small n due to the limited number of women who persist in STEM majors. The small n will only reinforce and further validate the fact that we are reaching critical levels of non-participation and high levels of attrition for students seeking STEM careers. The small n also limits the statistical power and generalizability of the results since it is too small to make big assumptions. Still, the anecdotal data was worth noting. Future studies should examine these constructs on a larger scale to have greater generalizability of the findings.
2. Lack of generalizability of the quantitative results. The biggest limitation was its data collection method with resulted in unreliable data collection measures. For this reason, instead of sharing the results of the factor analyses conducted, this researcher will share mean differences and standard deviation through disaggregating the data collected from the Latinas and other non-Latinas in
this study. The qualitative data will also be integrated to provide a greater picture of the findings of this study.
3. Only mean differences and standard deviations could be used to identify patterns and influences in the quantitative data. Qualitative data provided additional information to provide the story behind the numbers.
Secondly, since we will only interview those who are juniors, seniors or who are graduating in STEM majors, we miss the story behind those who have left STEM majors to pursue other degrees. These limitations were strongly considered when completing the final analyses of this study.
Delimitations
Delimitations of this study include data collected on a predominantly white institution in Central Texas. Due to the nature of the study, data was collected on females seeking STEM careers. Male data was collected as comparative measure. Data collected from juniors and seniors seeking STEM careers was the primary source of the study; no data on freshmen was collected since a large percentage of females leave STEM majors by the end of their sophomore year (Griffith, 2010).
Overview of Study
This dissertation is organized into six distinct chapters. This chapter (Chapter 1) focuses on the overview of the problem and includes the purpose and significance of the study. Additionally, a brief description of the methods used is included. Here, the definition of key terms used throughout the paper as well as the limitations and delimitations is shared. Chapter 2 includes a review of the relevant literature related to
barriers to STEM persistence, and also includes a review of how race, ethnicity and gender play a role in persistence for Latinas in STEM. Chapter 2 explains in greater detail the theoretical frameworks used and why it was important to combine two frameworks to best answer the question of what it takes for Latinas to persist in STEM majors. Chapter 3 provides a more detailed description of the mixed methods approach used to collect and analyze the data collected and explains why a mixed methods approach was imperative to more fully answer the research questions. Research design, participant selection and data collection are also included in Chapter 3. Chapters 4 describes the quantitative findings and major patterns and influences that impact Latinas’ persistence in STEM fields (RQ 1), with a critical eye towards the results; while Chapter 5 shares the discussion of the qualitative analysis of the testimonios of the eight Latinas in this study and a discussion of the findings using a LatCrit lens, finally Chapter 6 synthesizes the findings from the quantitative and qualitative results to make a more thorough analysis of the connections (similarities, differences and even the surprises of the study). Additionally, Chapter 6 summarizes the study, highlighting key findings and sharing implications for future research and practice, including a section on recommended policy and educational reforms. Final reflections from the research will conclude the dissertation.
Summary
Latina success in STEM careers is critical to meeting the needs of our global economy. As researchers assess various methodologies to increase retention and persistence, it is difficult to deny the strong call to action to implement changes in present-day schools before the Latina/o education crisis turns into a national catastrophe.
There is no denying the leaks along the pipeline; there is still much work to be done. Fortunately, efforts are being made across the nation to raise awareness, change policy, transform curriculum, and revolutionize teaching practices to strengthen the educational pipeline and meet the demands of our changing demographics. Knowledge gained from this proposed study establishes a framework for expanding the participation levels of Latinas in STEM disciplines and inform stakeholders on best ways to engage and recruit Latinas into STEM disciplines. As researchers and practitioners work together to solve the problem of Latina enrollment and persistence in STEM fields, this author eagerly awaits her chance to be a key player in finding the solution.
Chapter 2
Review of Relevant Research Literature
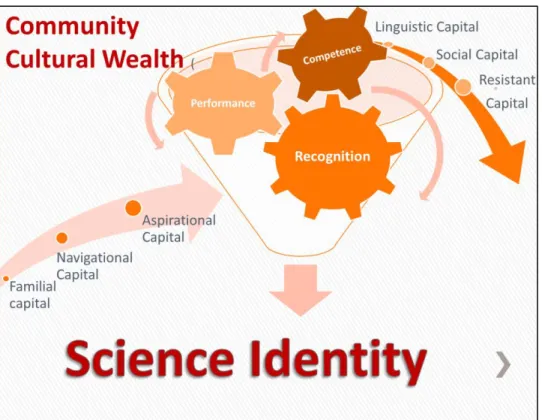
What follows is a critical review of the literature related to Latinas in STEM. Females enrolled in science, technology, engineering, and technology (STEM) courses navigate through their post-secondary experience, develop their science identities, graduate in STEM majors, and ultimately pursue STEM careers. Summarizing the existing literature, this chapter will (a) give an overview of the existing literature specific to the challenges and experiences women of color in STEM; (b) identify the varied characteristics of STEM persisters; (c) take a closer look at cultural factors specific to Latinas/os that impact persistence; and (d) provide a summary of the theoretical frameworks of science identity and community cultural capital to ultimately explain the impact of community cultural capital in shaping of Latina’s science identity.
Women of Color in STEM
NRC (2006) reports that women of color are “virtually absent from the nation’s leading science and engineering departments” (p. 4). This raises the question: Why?
Pre-college experiences of women of color in STEM. Enrollment in rigorous coursework has been identified as a strong indicator for degree completion (Green, 2006). Moreover, college culture and climate play a vital role in minority achievement, particularly for first-generation students (Green, 2006). In their research on persistence, Russell and Atwater (2005) found that African American students attending predominantly White institutions “were grossly underrepresented in the more advanced level science and mathematics courses, and their high school course-taking patterns can
have a significant impact on career choices and academic achievement in the sciences” (p. 692). Enrollment in advanced math and science courses in high school is crucial to academic success in quantitative science majors at the postsecondary level; students who feel competent in science and mathematics are more likely to pursue careers in STEM (Brown, 2000; Carnoy, 1994; Parham & Austin, 1994).
Gender bias. Gender differences in engagement in STEM courses are evident, emerging at middle school then expanding throughout high school (Bacharach, Baumeister, & Furr, 2003; Jones, Mullis, Raaizen, Weiss, & Weston, 1992). Critical gender theorists posit that “gender is a multi-tiered system” with connections on the macro level of politics, economics and culture; the micro-level of” aggressions is problematic to Latinas seeking STEM careers (Eisenhart & Finkel, 1998, p. 167). In fact, women of color must navigate through the STEM culture, which is generally “characterized by white, masculine values and behavioral norms, hidden within the ideology of meritocracy” (Eisenhart & Finkel, 1998; Johnson, 2001; Nespor, 1994; Seymour & Hewitt, 1997; Traweek, 1988). Seymour and Hewitt (1997) found several science departments with masculine norms, unfriendly professors and a competitive weed-out mentality directed at students of color and women. Johnson (2007) examined 16 women of color and determined that three distinct issues in science classes prove to be particularly discouraging for women in STEM: 1) the size of the lecture classes, 2) class discussions—particularly asking and answering questions, and 3) engaging in undergraduate research.
As recently as January 2005, Harvard president, Lawrence Summers actually “suggested that the underrepresentation of women in the sciences might be due to biology, or rather, that genetics should be explored as one possible explanation” (Johnson, 2007, p. 805). Fortunately, the American Association for the Advancement of Science (AAAS) quick countered Summer’s statement by declaring: “We wish to make clear that while historically, gender has predicted participation in S&E careers, there is no evidence—nor has there ever been—that it predicts aptitude in science” (AAAS, 2005).
Charles & Bradley (2002) claim that the U.S. still revolves around the premise that both genders are fundamentally “equal but different” and continue to push distinct affinities between male and female identities. Blickenstaff (2005) compared the lack of women in STEM to a sex-based filter within the pipeline that sorts women out of STEM-related fields.
Research has shown distinct gender differences in course taking patterns with females taking biology and chemistry with males have higher likelihood of taking physics. Women of color continue to show strong interest in science and engineering, but few fail to stay in those majors (NSF, 2009). In fact, though some gains have been made across certain subfields, such as biology, “women continue to be underrepresented in many STEM fields, including computer science and engineering” (National Science Foundation [NSF], 2006, p. 129). Despite comparable levels of achievement in STEM courses, more females transfer out of STEM than males (Bae & Smith, 1997; Strenta, Elliott, Matier, Scott, & Adair, 2010). England (2010) found that cultural and
institutional factors impact women’s progress in both educational and occupational sectors. In a study of minority women, Malcolm and Malcolm (2011) found:
In 1975, no minority women earned an engineering doctorate compared to ninety-one in 2008 (only about 2.9 percent of the total number of engineering doctorates awarded to U.S. citizens and permanent residents). The pattern is similar in physics, the geosciences, and mathematics and statistics (p. 166).
This small improvement in engineering doctorates amongst minority women shows continued leaks in the academic pipeline, in spite of targeted interventions to increase enrollment in computer science, engineering, and other math-intensive STEM fields. Women, who do enroll in male-dominated majors, tend to choose subfields that are consistent with “tacitly gendered” notions (p. 161). Fields such as the physical sciences, computer science, and engineering show significantly larger gaps in Latina enrollment, raising questions of why (Reigle-Crumb & King, 2010)? In fact, in most computer science classes, men outnumber women as much as 8 to 2 (20%) which stands as a stark contrast to many other college majors where women outnumber men 3 to 2 (NCES, 2013; Olson, 2014).
For this reason, the role of gender and how it is related to persistence in STEM careers has been the focus of numerous research studies (Carlone & Johnson, 2007; Huang, Taddese, & Walter, 2000; Leslie, McClure, & Oaxaca, 1998; Sax, 1994). Findings in several studies indicate that men and women pursue science for different reasons and their success in science results from a variety of factors (Farmer, Wardrop, & Rotella, 1999; Fenske, Porter, & Dubrock, 2000; Sax, 1994; Wyer, 2003). This brings to question the STEM culture itself and what it is about certain fields that entice or deter
Latinas from them. This study will investigate these perplexities in an effort to find ways to recruit more Latinas in these male-dominated fields.
Pathways to Enrollment in STEM majors. Women of color in STEM are more likely to enroll in community colleges and less selective institutions than their White and/or male counterparts (Malcolm & Malcolm, 2011). Women of color continue to show strong interest in science and engineering, but few fail to stay in those majors (NSF, 2009). Many underrepresented minority women find multiple and even “unconventional” pathways to enrollment in STEM majors (Malcolm & Malcolm, 2011, p. 165). Chang, Cerna, Han, and Saenz (2008) found that institutional type, campus climate, policies and practices matter.
Taking on the challenges of moving outside of both societal and cultural norms thus results in the double bind of defining who they are as opposed to what others expect them to be. Malcolm et al. (1976), continue:
Minority women…perceived their earlier experiences with sexism were superseded by problems with racism….When this situation arises it becomes difficult if not impossible to determine which “ism” is in force. In such a case, it does not matter whether one is being hit with the club of sexism or racism – they both hurt. And this is the nature and essence of the double bind. (p. 3)
The realities of the double bind are real; minority women who are unprepared for the challenges of being a minority female in a male-dominated world, leave STEM (or college altogether) with feelings of inadequacy, incompetence and not belonging.
Financial barriers. Rising tuition costs and reduced levels of financial aid in the form of grants or scholarships pose an additional barrier to Latinas seeking STEM careers (Heller, 1996). Continued budget cuts in federal and state funding for postsecondary
education have resulted in significant gaps between grants and financial assistance awarded and the costs of college attendance; this places most students of color at higher risk of taking out loans to pay for their college education (Gladieux & Perna, 2005). Price (2004) found a strong relationship between student borrowing patterns, debt burden, and family background, race, ethnicity, and gender. Low-income students had 7.2 times greater risk than upper- income students to exceed the 8% threshold of educational debt (Price, 2004). Multiple studies warn of the increasing danger of substituting loans for grants and support the argument that loans actually penalize low-income students since they impose a “regressive tax” on Black and Latino students (Gladieux & Perna, 2005; Heller, 2005, Price, 2004, p. 722).
Compared to Whites, students of color have a greater risk of accumulating excessive educational debt (Grodsky & Jones, 2004; Hamrick & Stage, 2004; Heller, 2008; Price, 2004). Even after controlling for family income, being Black or Latino had a statistically significant effect on educational debt burden in 1997 (Price, 2004). Ultimately, this means that Black and Latino students paid more for their college degree than their White counterparts (Kim, 2007; Perna, 2001; Price 2004).
STEM-specific Barriers. Research on persistence of women and minorities in STEM majors is broad (ETS, 2006; Green, 2006; Griffith, 2010). Tensions encountered in the double bind are exacerbated by the heavily male-centered STEM environment. The literature investigating gender differences in STEM fields have reported that women in STEM careers still claim it is “difficult” to persist in male-dominated fields (Miller,
Blessing, & Schwartz, 2013, p. 363). Ong (2002) conducted a six-year longitudinal study on women of color in physics. Findings from her study led to her conclusion that:
…young women of color in science have to carry out a tremendous amount of extra…invisible work in order to gain acceptance from their male physics peers and faculty. These women must also pay more careful attention and learn to articulate for themselves the unspoken rules of membership in the physics culture, then learn creative ways to access and maintain this membership. In doing so, they come to understand and learn to negotiate the multiple aspects of the seeming invisibilities of science culture, whiteness, and gender. (p. 43)
Developing a strong science identity involves learning to negotiate the unique dynamics of the STEM culture. To become enculturated within the STEM culture often involves either letting go of certain aspects of your cultural identity or changing the STEM culture; the former is usually what takes place and “acting White” becomes the norm for many Latinas seeking STEM careers (Roseberry, Warren, & Conant, 1992). Becoming active members of the science community is often thwarted by members who are distant and unwelcoming (Carlone & Johnson, 2007). Many students major in STEM courses, only to change majors during their sophomore year; this trend is even more pronounced for women and minorities (Griffith, 2010). As the nation seeks ways to develop a robust STEM workforce, answers to questions related to why Latinas leave STEM careers persist. For this reason, identifying and repairing the leaks along the educational pipeline is essential to increasing the number of Latinas pursuing STEM careers (Suarez, 2003).
Griffith (2010) discovered that the type of undergraduate program as well as difference in backgrounds significantly impact persistence rates. Still, specific factors
related to continuing in STEM majors during college are not well understood (Griffith, 2010).
Institutional climate for women of color in STEM. Institutional climate is important when studying college student persistence. For many students, college is their first major interracial context (Rankin & Reason, 2005). Campus climate influences student learning and social engagement, thus it ultimately impacts persistence (Pascarella & Terenzini, 2005). Moreover, college culture and climate play a vital role in minority achievement, particularly for first-generation students (Green, 2006). Oftentimes, women in STEM experience a “chilly climate” filled with both micro and macro-aggressions (Allen & Madden, 2006).
According to the National Research Center (NRC) (2006):
With each step up the academic ladder, from high school through full
professorships, the representation of women in science and engineering drops substantially. As they move from high school to college, more women than men who have expressed an interest in science or engineering decide to major in something else; in the transition to graduate school, more women than men with science and engineering degrees opt into other fields of study; from the doctorate to the first position, there are proportionately fewer women than men in the applicant pool for tenure-track positions. (p.4)
Racialized assumptions from Friere (1973) to Bordieau (1977) to Garcia and Guerra (2004) generally rely on deficit thinking that results in prejudices that permeate our educational system and policies. Students of color often experience prejudiced attitudes from faculty and staff and discriminatory experiences in the classroom (Ancis, Sedlacek, & Mohr, 2011). “Historically, women of color have faced overt discrimination in science settings” (Johnson, 2007, p. 806). Women of color have been found to fit less
easily than White women in university science classes (Johnson, 2007). Many claim feeling “loneliness, frustration, and self-doubt that often result from discrimination and the relative isolation of women in science and engineering” (Ambrose, Dunkle, Lazarus, Nair, & Harkus, 1997). Carnvale and Fry (2000) predict that in 2015 in Texas, the number of undergraduate students of color on college campuses is expected to be nearly 50 percent, taking into account the increased diversity in college students, higher education institutions have a responsibility to find ways to ensure successful college transitions (Maton & Salem, 1995; Staton-Salazar, 2010). Rankin and Reason (2005) found students of color
Experienced harassment, defined as any offensive, hostile, or intimidating behavior that interferes with learning, at higher rates than White students,
although White students reported higher incidence of gender harassment. Further, students of color perceived the climate as more racist and less accepting than did White students. (p. 43)
This leads to a double bind for women of color as they experienced both the gender and the racial bias. Subsequent studies confirm the importance of student perceptions of institutional support and student learning outcomes (Aguirre & Messineo, 1997; Cabrera, Nora, Terenzini, Pascarella, & Hagaderon, 1999; Flowers & Pascarella, 1999; Whitt et al., 2001). Many reports outline the detrimental effects to student learning due to perceived notions of lack of support and institutional inequities (Feagin, Vera, & Imani, 1996; Watson, Terrell, Wright, & Associates, 2002). Using data from the 2004 National Study of Living-Learning Programs, Johnson (2007) found a significant relationship between the perception of positive racial climate and overall sense of belonging for students of color and multiracial/multiethnic women. Similarly, women of