Development of ECE/ECEI diagnostics and MHD-related studies on HL-2A
tokamak
Z.C. Yang1, M. Jiang1,∗, Z.B. Shi1, X.T. Ding1, N.C. Luhmann, Jr.2, W.L. Zhong1, W. Chen1, P.W. Shi1, Y. Xu3, J. Wen1, A.S. Liang1, Y. Liu1, Q.W. Yang1and HL-2A team
1Southwestern Institute of Physics, P. O. Box 432, Chengdu 610041, China.
2Department of Electrical and Computer Engineering, University of California, Davis, California 95616, USA
3Institute of Fusion Science, School of Physical Science and Technology, Southwest Jiaotong University Chengdu 610031, China
Abstract.A novel 60-channel electron cyclotron emission (ECE) radiometer has been designed and tested for the measurement of electron temperature profiles on the HL-2A tokamak. This system is based on the intermediate frequency division technique, and has the features of wide working frequency range (60−90 GHz) and high temporal-spatial resolution (3µs, 1 cm), which covers almost the entire plasma region. Also, an electron cyclotron emission imaging (ECEI) system has been developed for studying two dimensional electron temperature fluctuations. It is comprised of several front-end quasi-optical lenses, a 24 channel heterodyne imaging array with a tunable RF frequency range spanning 60−135 GHz, and a set of back-end ECEI electronics that together generate two 24×8 array images of the 2nd harmonic X-mode electron cyclotron emission from the HL-2A plasma. The measurement region can be flexibly shifted due to two independent local oscillator sources, and the field of view can be adjusted easily by changing the position of the zoom lenses as well. The temporal resolution is about 2.5µs and the achievable spatial resolution is 1 cm. The ECE/ECEI diagnostics have been demonstrated to be powerful tools to study MHD-related physics including the multi-scale interaction between macro-scale MHD and micro-scale turbulence on the HL-2A tokamak.
1 Introduction
Electron temperature (Te) is one of the basic parameters
in fusion plasma, and its measurements are essential for successful completion of the fusion device mission. At present, it can be diagnosed in various ways, including laser Thomson scattering, soft x-ray using silicon drift de-tector, Langmuir probes, and electron cyclotron emission (ECE). However, for Thomson scattering the time reso-lution is about several to tens of millisecond, and for the Langmuir probe, the measurement can only reach the edge region. The interpretation for silicon drift detector mea-surements are tricky since they depend on the electron temperature, density and impurity. In contrast, ECE di-agnostic is an effective method to determine theTe
pro-file andTefluctuation ˜Tewith good temporal and spatial
resolution, and therefore would become a routine tool to detectTeevolution in ITER [1]. ECE electron
tempera-ture data will be important for evaluating the radial depo-sition profile of EC heating and the time evolution of the alpha particle heating. Furthermore, real-time ECE mea-surements will be used to identify magnetohydrodynamic (MHD) modes, such as neoclassical tearing modes that can often be deleterious to plasma performance.
Under the condition of optically thick emission, the 2nd harmonic of ECE can be considered as Blackbody emis-sion, which is described by Planck’s law in the
Rayleigh-∗e-mail: [email protected]
Jeans limit. Consequently, the intensity of ECE for the optically thick case is expressed by Eq.1 [2, 3].
IECE=
ω2T
e
8π2c2 =CTe (1)
By calibrating the coefficient C, theTeprofile can be
ob-tained. The previous ECE radiometers on HL-2A toka-mak had a finite working frequency range which limits the available measurement coverage in the plasma especially when the toroidal magnetic field changes. In addition, the spatial resolution was about 2−3 cm, which makes it diffi -cult to identify the accurate locations of some events, such as ECH deposition, sawtooth inversion radius, and tearing modes. Also, the linear operating range needs to be ex-tended to satisfy the higher heating power condition during the discharges. Hence, a novel 60 channel ECE radiometer has been developed to measure theTeprofile of the entire
pre-sented in Section 3. In Section 4, two examples regarding MHD-related studies by using ECE/ECEI are presented. Last, a summary is presented in Section 5.
2 60-channel ECE with intermediate
frequency division technique
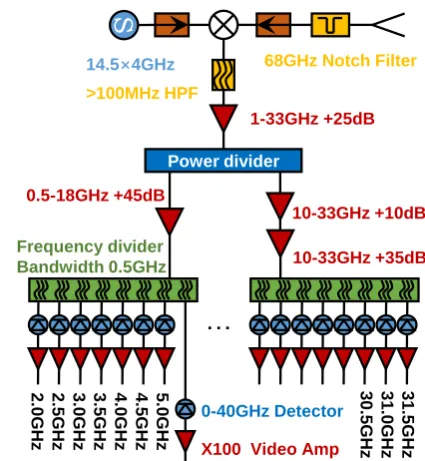
FIG.1 shows the schematic of the newly developed 60-channel ECE diagnostic. Compared to the previous ECE radiometers, this system is based on the direct interme-diate frequency (IF) filtering and detection technique by using several multiplexers instead of the second frequency down-converting (mixing) and power division technique [5]. Note that the power divider will introduce large in-sertion loss and is quite expensive especially at high fre-quency. This direct frequency filtering technique has three advantages: lower cost, wider working frequency range, and higher IF output power. The local oscillator (LO) source can be tunable between 50 and 90 GHz at a power level of 10 dBm, and the ECE signal from plasma is down converted to an IF signal with a frequency of 1−33 GHz. In the IF modules, the signal is divided by a 2-way resistive-type power divider, and then amplified by the wide-band low noise amplifier (LNA) separately. Af-ter that, the signals are split into 60 channels (2 to 31.5 GHz with a step of 0.5 GHz and bandwidth of 0.5 GHz) by eight-frequency multiplexers, and then detected, video amplified and low pass filtered with a bandwidth of 300 kHz.
S
Power divider
…
1-33GHz +25dB
10-33GHz +35dB 0.5-18GHz +45dB
68GHz Notch Filter
>100MHz HPF 14.5×4GHz
10-33GHz +10dB
Frequency divider Bandwidth 0.5GHz
5.
0G
H
z
4
.5
G
Hz
4
.0
G
Hz
3
.5
G
Hz
3.
0G
H
z
2
.5
G
Hz
2
.0
G
Hz 0-40GHz Detector
X100 Video Amp
3
1
.5
G
Hz
3
1
.0
G
Hz
30
.5
G
H
z
Figure 1. Schematic of the newly developed 60-channel ECE
radiometer.
The system was tested in the laboratory before instal-lation on the HL-2A tokamak. Figure 2(a) shows the fre-quency response of the LNA used in the IF module af-ter the two-way power divider as illustrated in Fig.1. The LNA can amplify IF signals by 30-40 dB over the whole
frequency band. The high IF output power improved the signal to noise ratio significantly. Shown in Fig.2(b) is the frequency response of the filter for each IF channel. The frequency interval between adjacent channels is 500 MHz and the bandwidth of the filters is also 500 MHz. The test result shows that there is almost no overlap between neigh-boring channels, and a relatively flat response is obtained over the full working band. The utilization of the narrow band filter guaranteed a high spatial resolution ofTe
mea-surement, i.e.,∼1 cm/0.5 cm in theBt =1.3/2.4 T
oper-ation. Fig. 2(c) shows the power response of a detector with fIF=23 GHz. The detector works over a very wide
linear region with input IF power less than 1.1 µW and output power within -2 V−2.5 V. In this case, the detec-tor output voltage is proportional to the electron tempera-ture. Base on the system performance introduced above, the ECE system can provide reliable profiles even with megawatt electron cyclotron resonance heating (ECRH). For the routine discharge on the HL-2A tokamak, the mea-surement range will cover about 66 cm on the midplane, with a spatial resolution of 1.1 cm and temporal resolution of 3µs.
3 ECEI on HL-2A and the optical
optimization
Although the 1D ECE measurement can provideTeprofile
with high temporal and spatial resolution, it cannot pro-vide the global quantities of the instabilities in the plasma, due to the fact that the MHD physics is always multi-dimensional. To capture the 2D characteristic of the MHD mode, we have developed two 24×8 ECEI array under the collaboration with University of California, Davis. ECEI is an advanced extension of the traditional ECE radiome-try with the same basic principle; however, it can image the plasma onto a vertically aligned antenna array by us-ing a set of quasi-optical lenses with the heterodyne fre-quency capability yielding 2D images. The ECEI diag-nostic has been proven to be a powerful tool for MHD physics through electron temperature fluctuation measure-ments, providing invaluable images on core/edge physics [6–11]. The ECEI instrument includes four subsystems, i.e., quasi-optical system, antenna array, microwave re-ceivers and digitizers. The detailed introduction of each subsystem, its laboratory calibration, upgrade and prelim-inary experimental results are described in previous pub-lications [12, 13]. According to different physical re-quirements, the system can work in narrow zoom pattern (higher spatial resolution) and wide zoom pattern (larger spatial coverage) by adjusting the relative positions of the zoom lenses. Using two separate LO sources, the measure-ment regions of the two 24×8 ECEI arrays can be shifted flexibly in the radial direction. It has 16 channels in the horizontal direction and 24 channels in the vertical direc-tion, covering a rectangular area of 40−55 cm (vertical)× 12−17 cm (radial). The temporal and spatial resolutions are 2.5µs and 1−3 cm, respectively.
Figure 2.(a) the gain of the wide-band low noise amplifier in the IF module, (b) the frequency response of each IF channel, and (c) the power response of the detector.
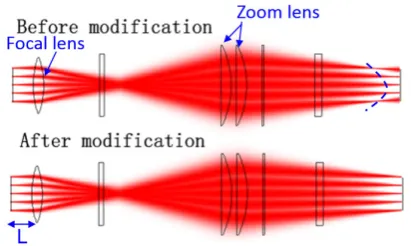
field side (LFS) region of the plasma, but not the high field side (HFS) region; (ii) the focal plane is very curvy. The curved focal plane indicates that the edge vertical chan-nels are out of focus, leading to a low signal to noise ratio of the signals. Consequently, last year, we have optimized the quasi-optical system to obtain better focal performance by changing the curvature radius of the focal lens, the sur-face type of the zoom lenses, and the relative distance be-tween the lenses. Figure 3 shows the results of the Gaus-sian beam tracing of the radio frequency optics before and after optimization. The focal lens, zoom lenses, and the distance between the antenna and the focal lens (L) are marked in the figure. The zoom lenses are used to ad-just the coverage of the vertical field of view. By moving the focal lens, the radial location of the focal plane can be shifted. It can be seen that before the modification of the optics, the focal plane is very curvy, while after the modi-fication it becomes much flatter.
Figure 3. Gaussian beam tracing of the radio frequency optics
before and after the optics modification.
Shown in Figure 4 are distributions of the focal planes with differentLvalues under narrow zoom and wide zoom patterns, calculated from the real ray tracing. In the wide zoom pattern, the vertical field of view is larger than that in the narrow zoom pattern. It was found that in both narrow and wide zoom patterns, the field curvature of the focal plane (4R between the core channel and the edge chan-nel) is within 6 cm. In addition, the focal area can reach the high field side plasma region. The optimized optics
were fabricated, tested and finally installed on the HL-2A tokamak for the 2018 spring experimental campaign. The quality of the ECEI signals were highly improved in this experiment.
R (cm)
140 160 180 200
Z (cm)
-20 -10 0 10 20
(a) Narrow zoom focal surfaces
R (cm)
140 160 180 200
Z (cm)
-20 -10 0 10 20
(b) Wide zoom focal surfaces
450 mm L=150 mm
L=150 mm300 mm
450 mm
300 mm
600mm
550 mm
Figure 4.Focal plane with different positions of focal lens under
narrow zoom and wide zoom patterns.
4 MHD-related studies by ECE/ECEI
4.1 Calibration of the ECE system
Normally, due to the different electronic response of each channel, the ECE measurement has to be calibrated to rep-resent theTeprofile. As we know, the detection locations
of ECE depend on the working frequency and magnetic field. Hence, the ECE radiometer can be relatively cal-ibrated by changing the working frequency or magnetic field slightly in two similar discharges with the assumption of a stiffTeprofile. The absolute values of theTecan be
obtained through cross comparison with the core Thomson scattering data. The calibration method by hopping work-ing frequency has been introduced in [5]. Here we show one example of the ECE calibration by shifting the mag-netic field, which is the routine way to obtainTeprofiles
in HL-2A. The calibratedTeprofiles are shown in figure
5(a). As we mentioned in Section 2, this ECE radiome-ter can work in a wider, linear input region compared with previous systems; it has been verified that even under high power ECRH the system can still work well. Fig. 5(b) in-dicates that with on-axis ECRH, the plasma center shifted outward by 5 cm and the coreTewas increased by 150%
R (cm)
120 140 160 180 200 Te (keV) 0 0.4 0.8 1.2 32823 32821 R (cm)
130 150 170 190
Te (keV) 0 0.5 1 1.5 2 2.5 Ohmic ECRH (b) (a)
Figure 5.(a) CalibratedTeprofiles obtained by shifting the
mag-netic field in two similar discharges, and (b)Te profiles under
ohmic and ECRH heating conditions.
4.2 Analysis of radial mode structure
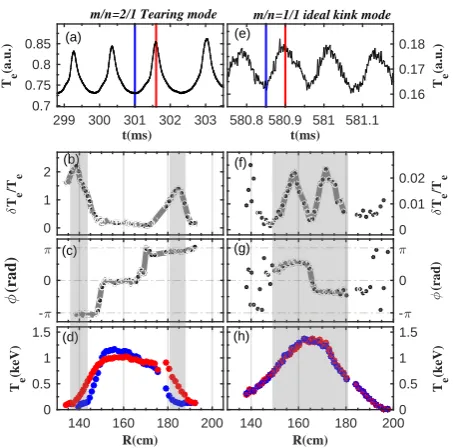
The newly developed ECE system basically covers 90% of the plasma along the midplane with a spatial resolu-tion of∼1 cm. Consequently, it represents a good tool to detect the radial structure of MHD modes, such as the accurate location and width of the tearing mode (TM). In the experiment, the mode rotates past the ECE detector position, so ECE signal variations can be used to distin-guish between kink and tearing modes. Plotted in figure 6 is a representative comparison of the features between them/n=2/1 TM and them/n=1/1 ideal kink mode. Fig. 6(a) illustrates the time history of theTelocated inside, but
near theq=2 surface, and Fig. 6(e) showsTenear theq=1
surface. The ideal kink mode produces sinusoidal temper-ature variation near the resonant surface (see Fig. 6(e)), while for the tearing mode, due to the flat profile near the O-point of the island, the Te variation near the resonant
surface will be deformed when the island structure passes by (see Fig. 6(a)), which is clearly illustrated by the car-toon in Reference [14]. For the position inside, but near theq=2 surface, the more flattened trough of theTe
vari-ation indicates that the O-point of the island is across the probed location (blue vertical line), while the more peaked crest means the X-point is through there (red vertical line). Figures 6(b), 6(c), 6(f) and 6(g) show the ampli-tude and phase of relative electron temperature variations (δTe/T¯e) using fast Fourier transform analysis for TM and
ideal kink mode, respectively. The shaded area illustrates the locations of the modes. The TM mode is located at 136 cm<R<144 cm in the HFS and 180 cm<R<188 cm in the LFS, which corresponds to the two peak areas in Fig. 6(b) and the flatTeprofile with the O-point of island
pass-ing by (blue circles in Fig. 6(d)). For the 1/1 ideal kink mode, the mode structure is encompassed by theq=1 sur-face, which isR=150 cm in the HFS andR=180 cm in the LFS. TheTeprofile is not flattened for the kink mode (see
Fig. 6(h)), demonstrating that there is no magnetic recon-nection. In addition, for TMTeperturbation takes on the
same phase (2π) between the HFS and LFS (see Fig. 6(c)), consistent with the even behavior ofm=2, whereas for the internal kink mode an opposite phase associated with odd structure was observed (see Fig. 6(g)), in agreement with m=1. It was also found that the coreTeprofile becomes
m/n=2/1 Tearing mode
t(ms)
299 300 301 302 303
Te (a.u.) 0.7 0.75 0.8 0.85
m/n=1/1 ideal kink mode
t(ms)
580.8 580.9 581 581.1
Te (a.u.) 0.16 0.17 0.18 / Te /T e 0 1 2 / Te /T e 0 0.01 0.02 ? (rad) -: 0 : ? (rad) -: 0 : R(cm)
140 160 180 200
Te (keV) 0 0.5 1 1.5 R(cm)
140 160 180 200
Te (keV) 0 0.5 1 1.5 (a) (c) (f) (e) (b) (h) (g) (d)
Figure 6.(a) time evolution ofTeinside but near theq=2 surface,
(b-c) the amplitude and phase of the relativeTevariationδTe/T¯e
with anm/n=2/1 tearing mode, (d)Teprofiles at two moments
(O-/X-point passing-by) marked by the blue and red vertical lines in (a), (e) time evolution ofTe near theq=1 surface, (f-g) the
amplitude and phase of the relativeTevariationδTe/T¯ewith an
m/n=1/1 ideal kink mode, and (h)Teprofiles at two moments
marked by the blue and red vertical lines in (e). The locations of the mode were shaded in the figure.
much flatter when there exists a TM compared to without TM cases, probably due to the impurity accumulation in the core plasma region.
4.3 Multi-scale interaction between TM and turbulence
In HL-2A, the ECEI diagnostic has been extensively used to detect the 2D structure of large scale MHD modes [10, 11, 15, 16], such as tearing mode, fishbone, and saw-tooth crash. Figure 7 shows the mode structure of the m/n=2/1 tearing mode. The phase ofTevariations is
op-posite on two sides of theq=2 surface. The X-point and O-point of the island are indicated with the black X and O marks in the figures 7(a) and 7(b), respectively. Recently, multi-scale physics such as the interaction between mag-netic islands and turbulence was found to play an impor-tant role in regulating the turbulent transport [15, 17–23], and therefore has become an important topic in fusion re-search. ECEI was demonstrated to be a powerful tool for analyzing such multi-scale physics. On the one hand, from the ECE images, the rotation frequency and direction, X-/O-point, the location and width of the island can be iden-tified accurately. On the other hand, it can also provide information of high frequencyTefluctuations, ˜Te.
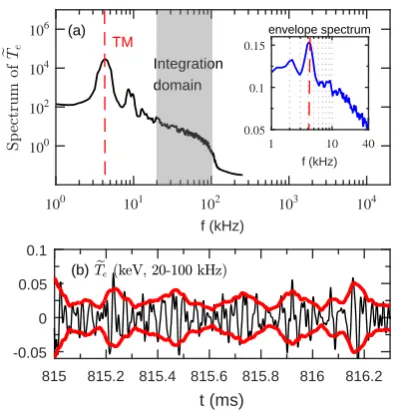
Figure 8 is a typical example of the interaction be-tween the magnetic island andTeturbulence. In Fig. 8(a),
f ≈4.3 kHz indicates the modulation on the local elec-tron temperature by the island rotation. To gain further insight into the effect on broadband turbulence, we ana-lyzed the envelope of temperature fluctuations (ξT˜e(t)) in the frequency range of 20-100 kHz (see shaded areas), i.e.,
ξT˜e(t) = (
1 2π
R100kHz
20kHz T˜e(f)e
i2πf td f)2, where ˜T
e(f) is the
Fourier transform of ˜Te(t). The frequency spectra ofξT˜e(t) is shown in the inset of Figs. 8(a). The envelope spectrum exhibits clear peaks at the rotating TM frequency, signi-fying the modulation of broadband turbulence by rotating islands. Fig. 8(b) further display the time traces of ˜Te
(integrated from 20−100 kHz), where the envelope of ˜Te
was calculated via the Hilbert transform and depicted by the red curves. The amplitude in ˜Teis modulated during
the rotation of the island, i.e. minimum at the O-point and maximum at X-point, which is consistent with gradient-driven turbulence. Furthermore, using two vertically ad-jacent ECEI channels, the poloidal flow velocity could be deduced from the vertical pattern velocity. Thus, the poloidal flow shear in the island region can be investigated. It was reported on KSTAR that the combined effects of the Tegradient and the poloidal flow shear determine the
two-dimensional distribution of theTeturbulence [22].
R (cm) 150 160 170 180
Z (cm)
-20 -10 0 10 20
R (cm) 150 160 170 180
Z (cm)
-20 -10 0 10 20
-0.2 -0.1 0 0.1 0.2
X
O
/T e/Te q=2
(a) (b)
Figure 7.2D mode structure of them/n=2/1 tearing mode
mea-sured by ECEI. The white dashed curves denote theq=2 surface, and the X-point and O-point of the island are indicated with the black X and O marks, respectively.
5 Summary
A novel 60-channel ECE radiometer has been developed for measuringTeprofile andTevariations on the HL-2A
tokamak. It is based on the direct intermediate frequency division technique by utilizing several multiplexers which ensures high IF output power, and hence high signal to noise ratio of the signals. The measurements of this sys-tem can cover almost 90% of the plasma along the mid-plane, and the temporal and spatial resolutions are 3 µs and 1 cm for the routineBt=1.3 T operation. Two 24×8
ECEI arrays have been developed by incorporating quasi-optical lenses and vertical aligned antenna array for two dimensional ˜Temeasurements. The rectangular coverage
of the two arrays can be flexibly shifted due to two inde-pendent LO sources, and the field of view can be adjusted easily by changing the position of the zoom lenses as well.
f (kHz)
100 101 102 103 104
S
p
ec
tr
u
m
of
eTe
100 102 104 106
f (kHz)
1 10 40
0.05 0.1 0.15
t (ms)
815 815.2 815.4 815.6 815.8 816 816.2 -0.05
0 0.05 0.1
(a) envelope spectrum
e
Te(keV, 20-100 kHz)
(b) TM
Integration domain
Figure 8. (a) Power spectrum of ˜Temeasured atR=182.14 cm
andZ=3.46 cm. The inset in (a) shows the amplitude spectrum of the corresponding envelope signal,ξT˜e(t) in the frequency range
∆f=20-100 kHz (shaded in (a)). (b) Time histories of ˜Te
(inte-grated from 20−100 kHz)and the envelopes of ˜Tedepicted by the
black and red curves, respectively.
The time and maximum spatial resolutions are 2.5µs and 1 cm, respectively. The optics of ECEI has been modified to cover broader plasma region and improve the imaging quality. The broad coverage and high spatial resolution of the ECE make it a powerful tool to study MHD-related physics, such as distinguishing the tearing mode from the kink mode, the location and width of magnetic island. In addition, multi-scale interaction between TM and high fre-quency turbulent ˜Tehas been investigated by ECEI
diag-nostic.
This work is partially supported by the National Natural Science Foundation of China under grant No. 11705051, 11475057, 11775069 and 11705049, partially supported by National Key R&D Program of China (Grant Nos. 2017YFE0301201 and 2017YFE0301203), and partially supported by Sichuan Science and Technology Program (Grant No. 2018RZ0123).
References
[1] G. Taylor, et al., EPJ Web of Conferences87, 03002 (2005)
[2] M. Bornatici, et al., Nucl. Fusion23, 1153 (1983) [3] I. H. Bornatici, Principles of Plasma Diagnostics
(Cambridge University Press, Cambridge,1987), Chap-ter 5.
[4] H. J. Hartfuss, T. Geist and M.Hirsch, Plasma Phys. Controlled Fusion39, 1693 (1997)
[5] Z.B. Shi, et al., Rev. Sci. Instrum.85, 023510 (2014) [6] H.K. Park, et al., Phys. Rev. Lett.96, 195003 (2006) [7] I.G.J. Classen, et al., Phys. Rev. Lett. 98, 035001
[8] I.G.J. Classen, et al., Plasma Phys. Controlled Fusion 53, 124018 (2011)
[9] J. Lee, et al., Phys. Rev. Lett.117, 075001 (2016) [10] M. Jiang, et al., Phys. Plasmas24, 022110 (2017) [11] M. Jiang, et al., Nucl. Fusion58, 026002 (2018) [12] M. Jiang, et al., Rev. Sci. Instrum.84, 113501 (2013) [13] M. Jiang, et al., Rev. Sci. Instrum.85, 076107 (2015) [14] V. Igochine et al., Nucl. Fusion57036015 (2017) [15] W. Chen et al., Nucl. Fusion57114003 (2017)
[16] L.M. Yu et al., Nucl. Fusion57036023 (2017) [17] Bard ´oczi L.et alPhys. Rev. Lett.116215001 (2016). [18] Bard ´oczi L.et alPhys. Plasmas24056106 (2017). [19] Ji X. Q.et alSci. Rep.632697 (2016).
[20] Ida K.et alSci. Rep.516165 (2015).