Copyright 0 1995 by the Genetics Society of America
Spatial Structure of Two-Locus Genotypes Under Isolation
by
Distance
Bryan K. Epperson
Department of Forestry, Michigan State University, East Lansing, Michigan 48824 Manuscript received April 13, 1994
Accepted for publication January 19, 1995
ABSTRACT
Extensive Monte Carlo simulations are conducted of spatial distributions of two-locus genotypes in large, continuous populations under isolation by distance models. The results show that substantial patches of double homozygotes are present in the spatial structures, even when loci are unlinked. The stochastic spread of identical two-locus genotypes largely outpowers the tendency for recombination to decouple patterns for separate loci. A spatial patch is a large area containing mostly one double homozy- gous genotype in a highly contiguous constellation. This patch structure is reflected in high positive spatial autocorrelations and large excesses of pairs, or joins, of identical double homozygotes at short- to-intermediate distances of spatial separation. Although spatial patches of double homozygotes are the dominant spatial feature, and the major contributors to overall high levels of autocorrelations among two-locus genotypes, other substantial features include areas of concentrations of identical genotypes heterozygous at only one locus. One implication of the patch structure is the presence of high levels of linkage disequilibrium, caused by isolation by distance even for unlinked loci, at some spatial scales; yet the disequilibrium in the large total populations is near 0. Thus linkage disequilibrium produced by isolation by distance is highly dependent on spatial scale. Another implication is that high degrees of
spatial structuring and autocorrelations are produced for genetic variation controlling quantitative traits, at least when the number of loci is relatively small, under a wide range of situations, even if the trait is
selectively neutral. The significance of the results to field studies is also examined.
I
N classical theoretical models of genetic isolation by distance within large continuous populations, the effects of limited dispersal and mating by proximity are expressed in terms of inbreeding and consanguinity coefficients (WRIGHT 1943; -COT 1948). More re- cently, simulation studies have been conducted on com- plex models that generate explicit spatial distributions of single-locus genotypes, and these have incorporated important stochastic sampling events that occur as indi- vidual genotypes disperse (i.e., “stochastic migration”) within a population. These studies have shown that large spatial patches (see Figure l ) , or areas of concen- trations of one homozygous genotype, are the domi- nant spatial features of the distributions of genotypes for single loci (RHOLF and SCHNELL 1971; TURNER et al.1982; SOKAL and WARTENBERG 1983; SOW et a2. 1989; EPPERSON 1990a). However, the spatial distributions of multilocus genotypes have not been characterized.
Views on the spatial structure of multilocus spatial distributions range widely. On the one hand, it has been suggested that the spatial patterns for two unlinked loci might be essentially completely decoupled by recombi- nation
(Sow
and WARTENBERG 1983; EPPERSON 1990b). Large spatial patches of singlelocus homozygotes would exist, but not large patches of multilocus homozygotes. One apparent implication of this view is that generallyAuthor e-mil: [email protected]
Genetics 140: 365-375 (May, 1995)
there should be little spatial autocorrelation for
quantita-
tive traits that are controlled by more than a few loci (EPPERSON 1993). In contrast, other results for the very different models on the spatial correlations among d i s Crete populations support the view that the correlations should be similar regardless of the number of loci (ROCERS and HARPENDING 1983; LANDE 1991; NAGYLAKI 1994). The spatial distribution of multilocus genotypes is of immediate theoretical and experimental interest, in ad- dition to its implications for quantitative traits. For exam- ple, linkage disequilibrium can arise from overlapping spatial structures for two loci (PROUT 1973). Such spatial crosscorrelations are involved in the formation of novel combinations of genes and thus may affect the evolution of species (WRIGHT 1943). Moreover, theoretical and experimental results on spatial structure provide hypoth- esis testing frameworks, that are particularly powerful when applied to multiple locus data (LEWONTIN and
KRAKAUER 1973; SOKAL 1979,1988; SOKAL andJACQUEZ 1991; SOKAL and ODEN 1991; EPPEMON 1990b, 1993).
366 B. K. Epperson
andJACQuE2 1991) and in real populations (SOKAL and ODEN 1978a; EPPERSON and CLECG 1986; SOW 1988). Isolation by distance with stochastic migration results in autocorrelations in terms of pairs of diploid geno- types, which includes some information that is used in join-count statistics but not in Moran’s I-statistics. In the stochastic migration case, the join-count statistics use ad- ditional information that is in a sense similar to that used in GILLOIS’ set of identity measures in contrast to a single coefficient of consanguinity (GILLOIS 1966). This infor- mation is intimately connected to other important pa- rameters, such as diploid mating-type frequencies and levels of biparental inbreeding. Join-count statistics have also provided important experimental tools and, in a multilocus context, they may meet the repeated calls for the development of efficient measures for analyzing spatial multilocus data in real populations. One goal is to describe the overall degree of multilocus genotypic isolation by distance. One promising summary join- count statistic is based on the total number ofjoins be- tween nonidentical multilocus genotypes (EPPERSON and
A
L
w
1989; EPPERSON 1993).The aim of the present study is to quantify the spatial structure of multilocus genotypes and quantitative traits, using join-count and I-statistics, in theoretical models of limited dispersal and mating by proximity. In addition, we address several aspects of how the values of these statistics are changed by dispersal, recombina- tion, and allele frequency parameters.
Join-count statistics are test statistics that compare the numbers of each type of pair of genotypes, separated by a given distance, with the expected number under the null hypothesis that the distribution is random (SO-
KAL and ODEN 1978a; CLIFF and O m 1981). The com-
putations involve counting all joins or pairs of geno- types, which for a population or sample of size n are on the order of d . This presents computational difficulties when n is very large, and in the present study of large populations ( n = lO,OOO), this difficulty is faced through the use of supercomputers.
Join-count statistics have been used to efficiently char- acterize spatial structure and isolation by distance in sam- ples of much smaller sizes (e.g., n = 50-400) in popula- tions of several species (SOKAL and ODEN 1978b; EPPERSON and CLEGG 1986; EPPERSON and &LARD 1989; SCHOEN and LATTA 1989; WAGNER et al. 1991 ; reviewed in EPPERSON 1993), and to detect selection among pat- terns for multiple loci (EPPERSON and CLEGG 1986). They have been applied to multilocus data of popula- tions of lodgepole pine (EPPERSON and
ALLARD
1989), and Moran’s I statistics were applied to quantitative traits in Impatiens capensis (ARGYRES and SCHMITT 1991).MATERIALS AND METHODS
Simulations: Each simulated population consisted of 10,000 individuals with diploid two-locus genotypes, located
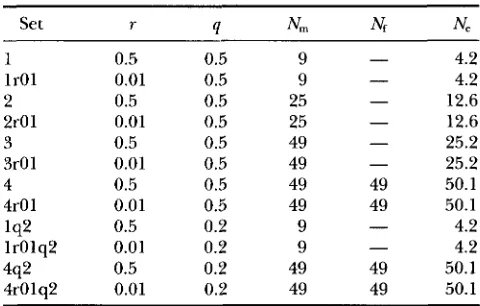
TABLE 1
Parameters for the various simulation models
Set r 4 Nm Ne Nf
1 0.5 0.5 9
-
4.2lrOl 0.01 0.5 9
-
4.22 0.5 0.5 25 - 12.6
2r01 0.01 0.5 25 - 12.6
3 0.5 0.5 49 - 25.2
31-01 0.01 0.5 49 - 25.2
4 0.5 0.5 49 49 50.1
4r01 0.01 0.5 49 49 50.1
-
4.2lr01q2 0.01 0.2 9 - 4.2
4r01q2 0.01 0.2 49 49 50.1
Parameters of different simulation models include recombi- nation rate, r, frequency of a and b genes, q, and dispersal in terms of the number of nearest of neighbors (including self) from which male and female parents are randomly chosen,
N, and Nf, and Wright’s neighborhood size, Ne.
on a 100 X 100 square lattice. Initially, each simulation con- sisted of individuals with randomly assigned two-locus geno- types (for two diallelic loci, A / a and B / b ) , with probabilities according to Hardy-Weinberg equilibrium, 0 linkage disequi- librium, and allele frequencies of the a and b alleles, qa and
q b , respectively, set variously at 0.5 or 0.2. Generations of mat-
ing and other features of life cycles were simulated using standard Monte Carlo methods, and details of the simulation Fortran source code program, including how matings near the boundaries were “reflected,” were described previously (EPPERSON 1990a). The sets of simulations included three different levels of dispersal, and either members of only one sex dispersed (.g., male or pollen dispersal, no female or seed migration) or both sexes dispersed. Each dispersing par- ent was stochastically chosen (with replacement) from either the nearest 8, 24, or 48 locations with uniform probabilities,
‘/,th, 1/25th, or I/&, respectively (N, or
Nf
= 9, 25, or 49 respectively), and there was additionally chances of no dis- persal with probabilities ‘/,th, 1/25th, or ‘/qgth, respectively, which also equals the rate of selfing (EPPERSON 1990a). Next, gametes were stochastically sampled from the two chosen par- ents according to equal segregation rules and the recombina- tion rate, r. Then the two gametes were combined to form the offspring which remains at the same location for the next generation. Sets of five replicate simulations were conducted for each combination of r, qa,qa, and Nm,Nf (Table 1). For each simulation, discrete (nonoverlapping) generations of the life cycle were repeated for 200 generations (because previous results show that quasistationarity is established within this time period; e.g., SOKAL and WARTENBERG 1983), and the spatial distribution of the 10 different two-locus genotypes was output at every 10 generation increments, using the codes in Table 2.Statistical characterization: To characterize the spatial d i s tributions of genotypes during the quasistationary phase (SO- KAL and WARTENBERG 1983), the join-count statistics were computed for each simulation at generation 200. For each surface, a vectorized Fortran program (EPPERSON 1990b), run on a CRAY C90 at the San Diego Supercomputing Center, was used for classifting the 10,000 X 9,999/2 or ca. 50 million pairs of individual genotypes. Pairs or “joins” were classified according to the two two-locus genotypes and the distances
l q 2 0.5 0.2 9
Two-Locus Spatial Structure 367
TABLE 2
Two-locus genotypes, their codes and converted genotypic values for quantitative traits
Code Genotype Genotypic value
1 AABB 0
2 AaBB 1
3 aaBB 2
4 AABb 1
5 AaBb“ 2
6 AaBb’ 2
7 aaBb 3
8 AAbb 2
9 Aabb 3
10 aabb 4
a In coupling phase. In repulsion phase.
classes, D, in multiples of lattice units ( D = 1-138). With 10 different two-locus genotypes, there are 55 different types of joins. The number of joins between genotypes i and j for distance class 0, nV(D) minus the expected number under the null hypothesis, H,, of randomly sampling pairs without replacement (from the sample population), divided by the SD under Ho forms a test statistic, SND+(D), which has a closely approximate standard normal distribution under Ho for large samples ( S o w and ODEN 1978a; CLIFF and ORD 1981). A negative value less than -1.96 indicates a statistically signifi- cant deficit of a type ofjoin at a distance, and positive values indicate excesses. Effects of events near the boundaries are negligible because the populations are very large (SOKAL and WARTENBERG 1983).
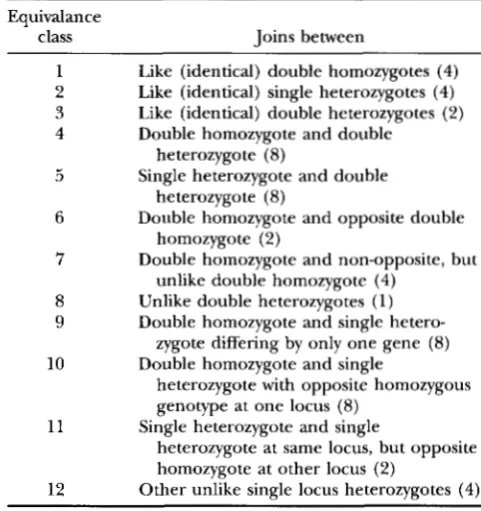
Among the various types of joins, there are 12 “equiva- lence” categories, which are based on symmetries of geno- types (Table 3). For examples, equivalence category 1 in- cludes all four types of joins between double homozygotes
(i.e., joins AABB X AABB, AAbb X AAbb, aaBB X aaBB, and
aabb X aabb), and category 6 includes the joins AABB X aabb
and AAbb X aaBB. We would expect all members of an equiva- lence category to respond on average equally to changes in process parameters (or in category 4 approximately equally), although stochasticity will cause some differences in a particu- lar simulation run. Thus, a concise way to characterize the structures under various models, is to present the averages of SND’s for each equivalence category, for each set. The most striking statistics are those for joins between pairs of identical genotypes. Another important statistic is based on the total number of joins between unlike genotypes, and a SND test statistic for Ho was formed, again for each distance class. The set of SND statistics for a type of join for various distance classes is termed a SND-correlogram.
Analyses of the spatial autocorrelations of genotypic values of a quantitative trait that might be controlled by the two-
locus genotypes, were also conducted. First, the individual genotypes were converted to genotypic values, by adding 0, one, or two (if an individual had genotype A A , Aa, aa respec- tively at locus A / a ) to 0, one, or two (if an individual had genotype BB, Bb, Ob, respectively, at locus B / b ) . This transfor- mation (Table 2) represents additive effects within and be- tween loci, with equal weighting of loci. Next, the average genotypic value was calculated in 400 contiguous quadrats, each of size 5 X 5 (25 individuals). This is the same quadrat system used for autocorrelations of gene frequencies in previ- ous simulation studies ( S o w and WARTENBERG 1983; S o w
TABLE 3
Types of joins for each equivalence class (see text)
Equivalance
class Joins between
1 Like (identical) double homozygotes (4)
2 Like (identical) single heterozygotes (4) 3 Like (identical) double heterozygotes (2) 4 Double homozygote and double
5 Single heterozygote and double heterozygote (8)
heterozygote (8)
homozygote (2)
unlike double homozygote (4) 8 Unlike double heterozygotes (1) 6 Double homozygote and opposite double
7 Double homozygote and non-opposite, but
9 Double homozygote and single hetero-
10 Double homozygote and single
zygote differing by only one gene (8)
heterozygote with opposite homozygous genotype at one locus (8)
heterozygote at same locus, but opposite homozygote at other locus (2)
11 Single heterozygote and single
12 Other unlike single locus heterozygotes (4)
Number of each type in parentheses.
et al. 1989; EPPERSON 1990a). Then, for every loseneration increment, these values were used to calculate unweighted Moran’s I-statistics ( S o w and ODEN 1978a), using distance classes in multiples of quadrat lengths (one length equals five times the distance between nearest neighbor individuals, i.e.,
five lattice units), and I-correlograms were formed.
Exact tests for statistical differences among correlograms are not available (e.g., SOKAL and WARTENBERG 1983). This paper is concerned with the effects of process parameters on the populational spatial autocorrelations. Stochastic variation (SLATKIN and ARTER 1991) in the SND- and I-statistics is low throughout the range of studied processes, for the (more informative) short to intermediate distance classes (e.g., Fig- ure 6). Statistical significance of the contrasts described in this paper generally would certainly obtain. However, statistical significance is largely beside the issue, because the simulated populations are much larger than samples collected from real populations. Issues of statistical significance for purposes of making empirical inferences will be more appropriately ad- dressed in further studies where substantial statistical varia- tion is added through sampling.
RESULTS
368 B. K Epperson
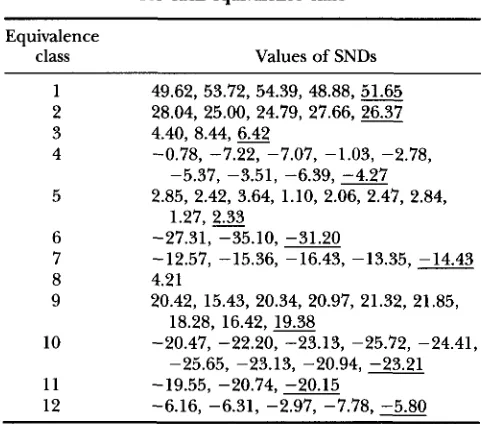
TABLE 4
Example of values of joincount SND statistics
for each equivalence class
Equivalence
class Values of SNDs
1 49.62, 53.72, 54.39, 48.88,
51.65
2 28.04, 25.00, 24.79, 27.66,26.37
3 4.40, 8.44,
6.42
4 -0.78, -7.22, -7.07, -1.03, -2.78,
5 2.85, 2.42, 3.64, 1.10, 2.06, 2.47, 2.84,
-5.37, -3.51, -6.39,
-4.27
1.27,
2.33
6 -27.31, -35.10, -31.207 -12.57, -15.36, -16.43, -13.35, -14.43
8 4.21
9 20.42, 15.43, 20.34, 20.97, 21.32, 21.85,
10 -20.47, -22.20, -23.13, -25.72, -24.41,
11 -19.55, -20.74, -20.15
12 -6.16, -6.31, -2.97, -7.78,
-5.80
18.28, 1 6 . 4 2 , m-25.65, -23.13, -20.94, -23.21
Listed are the SND values for joins of each type in each equivalence class, for one simulation of model 1, for distance class 1.0 at generation 200. Underlined value is the average for that equivalence class.
like (identical) double homozygotes. Complementary large deficits of joins between opposite double homozy- gotes are observed. Deficits in joins between nonoppo- site but unlike (nonidentical) double homozygotes are more moderate. There are moderate excesses of joins between like (identical) single heterozygotes (single ho- mozygotes). In general, SNDs for joins in all categories (3-5 and 8) involving the double heterozygotes have consistently small absolute values. Similarly, values for joins between unlike single heterozygotes were close
to 0. Somewhat larger excesses are indicated for joins between double homozygotes and single heterozygotes differing at only one gene (9), and similar size deficits when the single heterozygotes have the opposite homo- zygous genotype (10 and 11). The results indicate a connection between the single-locus and two-locus dis- tributions, but the dominant spatial autocorrelations are, perhaps surprisingly, those positive autocorrela- tions between double homozygotes. We note that the rankings among categories with specific types of unlike joins might differ when allele frequencies are changed.
Below we will focus on joins between like types.
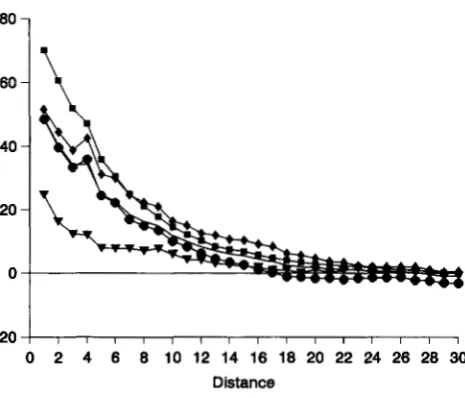
Patch structure: Remarkably, after -50 generations, the correlograms for joins between identical double ho- mozygotes indicate the presence of patches of double homozygotes (analogous to patches of single locus ho- rnozygotes"EPPERs0N 1990a; B. EPPERSON, u n p u b lished data), even when there is free recombination. The statistics are very large at short distances, and then decrease, and finally become negative as distances in- crease to ca. 15-30 (Figure 2). It is evident from inspec-
tion of the surfaces that large contiguous areas of dou- ble homozygotes develop within -50 generations and then persist (e.g., Figure 1).
SNDs forjoins between like (identical) single heterozy- gotes exhibit a similar panern, only the values are not as extreme (Figure 3). This indicates that single-locus heterozygotes occur in concentrations. However, these concentrations differ from the patches of double homo- zygotes, within which there are very high levels of conti- guity. Matings and segregation reduce the contiguity in the former. The concentrations are associated with patches of double homozygotes (such that both geno- types have the same single-locus homozygous genotype). In contrast, the values of SNDs for joins between like double heterozygotes are quite small when there is free recombination (Figure 4), and apparently any patchi- ness is at most very fine grained. However, weak levels of concentrations apparently extend over large areas, because the X-intercepts are large. When recombina- tion is highly restricted, the values are greatly increased, resulting in concentrations similar to those for single heterozygotes.
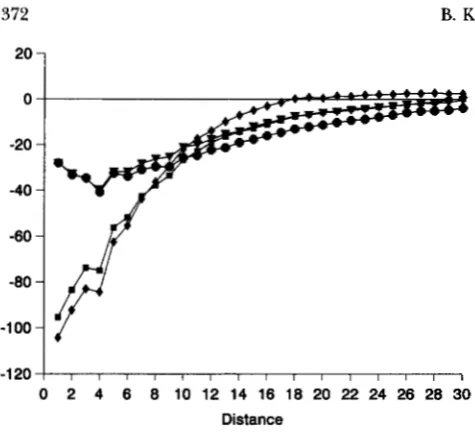
The excesses between like double homozygotes are larger than those for any other category, indicating that these constitute a major contribution to the large defi- cits for the total number of unlike joins (Figure 5). Patches of double homozygotes dominate the spatial structure. Restricting recombination only slightly inten- sifies this structure. It is worth noting that the correlo- grams generally appear to have a mode at distance class 4, but no biological interpretation of this is obvious.
Stochastic variation in SNDs was generally small. For example, the differences among values for different double homozygotes are shown in Figure 6. These dif- ferences are similar to those observed among simula- tions within the same set. Thus, the results are quite predictable for a given pair of loci.
Effects of process parameters: A marked decrease in SNDs for very short distances occurs when Ne is in- creased from cu. 4 to 12 (Figures 2-4). Steady but lesser decreases occur as Ne is increased further. The greatest decreases are observed for joins between like double homozygotes, and this is interpreted as resulting from greater degrees of mixing of double homozygotes with other genotypes, in areas including those outside the patches of double homozygotes, when dispersal is in- creased. The X-intercepts are somewhat increased, al- though only slight changes in values for intermediate distances ( D equals -4-20) are observed. This indi- cates that the patch sizes of double homozygotes are only slightly affected by relative large increases in dis- persal. Similar but smaller changes occur in other like joins (Figures 3 and 4).
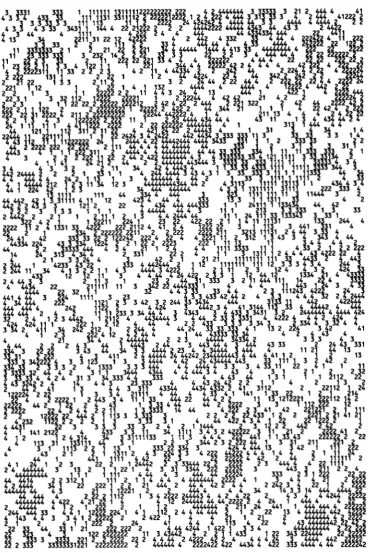
Twc-Locus Spatial Structure 369
FIGURE 1.-Spatial distributions of the four double homozygotes (Nos. 1-4) for one simulation run of set 1, at generation 200. Blank spaces represent other genotypes.
when T = 0.01 the joincount statistics for like double primarily reflecting increases in the numbers of joins heterozygotes are substantially increased, to values near between like double heterozygotes.
370 B. K. Epperson
*
40 30
' ] Y q k
301
20
10
0
- 1 o ~ I I I I I I I I I I I I I I I
0 2 4 6 8 10 12 14 16 18 20 22 24 26 28 30 Distance
FIGURE 2.-Average SND correlograms for joins between like (identical) double homozygotes for each set, at genera- tion 200: +, set l;
.,
set 2;.,
set 3;V,
set 4 (solid lines); graphs with dashed lines represent the values for sets with equivalent dispersal parameters, but with r = 0.01, instead of r = 0.5 (.g.,+
- - -+,
set lr01).homozygote and decreased for the least common. Similar trends are observed in the two more common single heterozygotes compared with the two less com- mon (Figure 9). Little change was observed in the
SNDs for total unlike joins (compare Figure 10 with Figure 5).
Linkage disequilibrium: Average values of linkage disequilibrium for each set were all very close to 0, as expected. The SD of the various linkage disequilib- rium coefficients (total, within and between; WEIR
1979) and the average of the absolute values of the coefficients, for each set, are shown in Table 5 . All values are small, although those for models with r =
30
25
20
15
10
5
0
-5
1
- 5 ! 1 1 1 1 1 1 1 1 1 1 1 , 1 1 1 0 2 4 6 8 10 12 14 16 18 20 22 24 26 28 30
Distance
FIGURE 4.-Average SND correlograms for joins between like (identical) double heterozygotes for each set, at genera- tion 200: symbols for sets same as in Figure 2.
0.01 are considerably larger than those with free re- combination. Moreover, the values fluctuate positive and negative among simulations within sets, and even during the time course of a single simulation run, espe- cially for runs with free recombination. The within
versus between gamete components (WEIR 1979)
showed no obvious connection.
Spatial autocorrelations for genotypic values for quantitative
traits:
Correlograms of I-statistics for aver- age genotypic values for quantitative traits (using the conversions indicated in Table2)
in the quadrats, are very similar for all sets (Figure 11). Moreover, they are very similar to those observed for gene frequencies in single-locus models. Thus, to the resolution of the quad- rats, the spatial structure of quantitative traits is robust to changes in dispersal in the low-to-moderate range,0 2 4 6 8 10 12 14 16 18 20 22 24 26 28 30 Distance
FIGURE 3.-Average SND correlograms for joins between like (identical) single heterozygotes for each set, at generation 200: symbols for sets same as in Figure 2.
20
0
-20
4 0
-60
-80
-1 00
-1 20
-140 -
-
-
-
-
-
-_ , , , , . , . . . .
0 2 4 6 8 10 12 14 16 18 20 22 24 28 28 30 Distance
Two-Locus Spatial Structure 371
60
Ad
4 0 1
i"t\
20
I5I
T
30
20
10
0
-10
15
10
5
0
- 2 O ! I I I I I l I I I I I I I I I
0 2 4 6 8 10 12 14 16 18 20 22 24 26 28 30 Distance
FIGURE 6.-SND correlograms for an individual simulation run of set 1, at generation 200, for like joins for each of the four double homozygotes
(A),
four single heterozygotes ( 0 ) , and two double heterozygotes ( W ).
moderate skewing of allele frequencies (Figure 12), and degree of linkage.
The small changes tied to dispersal follow those ob- served for Moran's I-statistics for allele frequencies in single-locus models (SOW et al. 1989).
As
dispersal is increased from low to moderate, the correlations for short distances generally increase, as do the X-intercepts (SOKAL et al. 1989).DISCUSSION
The simulated life cycles of limited dispersal generate spatial distributions of two-locus genotypes with striking
80 1 I
60
I\
-20
0 2 4 6 8 10 12 14 16 18 20 22 24 26 28 30 Distance
FIGURE 7.-Average SND correlograms for set lq2 (with
N, = 9 and gene frequencies q., qb = 0.2) at generation 200, separately for each of the four double homozygotes: W, AABB;
+
, UUBB; 0 , AAbb, 'I, uabb, line without symbols is the average among these four.-5
0 2 4 6 8 10 12 14 16 18 20 22 24 26 28 30 Distance
FIGURE &-Average SND correlograms for set 4q2 (with
N, = 49, Nf = 49 and gene frequencies qa, qb = 0.2) at genera- tion 200, separately for each of the four double homozygotes: W, AABB; +, auB& 0 , AAbb, 'I, aabb, line without symbols is the average among these four.
structural features and high autocorrelations. The dom- inant features of the spatial structure are large patches of double homozygotes, which occurs for wide ranges of gene frequencies, and amounts of dispersal, even when loci are unlinked. Here we discuss these and other more subtle aspects, including possible estimators of dispersal based on standing population genetic data; spatial correlations of other genotypes; properties of the total number of unlike joins for multilocus data;
3 5 1
0
-5 1 1 1 1 I I I I I I l l I I I
0 2 4 6 8 10 12 14 16 18 20 22 24 26 28 30 Distance
FIGURE 9,"Average SND correlograms for each type of like join between single heterozygotes or between like double heterozygotes for sets with skewed gene frequencies (qa, qb = 0.2) at generation 200: symbols
-
W, -- -
W,372 B. K. Epperson
0
-20
-40
- 6 0 1
-80
d
- 1 2 o ~ l l l l , l l , l I l I I , I
0 2 4 6 8 10 12 14 16 18 20 22 24 26 28 30
Distance
FIGURE 10.-Average SND correlograms for the total num- ber of unlike joins for sets with skewed gene frequencies, at generation 200: H, set lq2;
+
, set lr01q2; 0 , set 4q2;V,
set 4r01q2.the nature of spatial structural differences caused by changes in gene frequencies, recombination rates, and dispersal; and some implications for spatial correlations of quantitative traits and levels of linkage disequilib- rium caused by spatial structure.
Analyses of the SND joincount correlograms, together with inspection of the surfaces, reveal that large patches, or areas of highly contiguous distributions, of double homozygotes develop within ca. 50 generations, and then the patchy structure persists as a highly stable or quasista- tionary state. These patches appear to be functionally analogous to those for single loci (SOW and WARTEN- BERG 1983; B. K EPPERSON, unpublished data). Remark- ably, the tendency of the regional spread of a “lucky” gamete type
(e.g.,
ab) in double homozygotes (aabb)largely overcomes the decoupling tendencies for recom- bination, even when the loci are unlinked. The joins for like (identical) double homozygotes occur in great excesses for short distances, but occur in deficits for intermediate distances. The patch structure is reflected in large deficits ofjoins between opposite double h o m e zygotes
(e.g.,
joins aabbx
AABB,
or AAbbx
aaBB) , and in lesser deficits of joins between unlike nonopposite double homozygotes, at short distances. The joincount statistics and the Xintercepts are similar in size to those for homozygotes in single-locus models (B. K EPPERSON,unpublished data).
The average joincount correlograms for like double homozygotes are only slightly changed when linkage is tight ( r = 0.01). The lack of change in patches of double homozygotes complements the lack of efficacy of re- combination in decoupling the patterns for each sepa- rate locus. The patch structure was largely invariant with respect to the various frequencies of gamete types. When allele frequencies,
qa
andp ,
are skewed to 0.2TABLE 5
Average absolute values of linkage disequilibrium coefficients for various generations for each set
Set Generation 50 Generation 100 Generation 200
1
Dg 0.0027 f 0.0017 0.0036 f. 0.0051 0.0035 2 0.0050 D, 0.0032 f 0.0020 0.0033 t 0.0048 0.0033 2 0.0043
L&, 0.0017 t 0.0022 0.0039 f 0.0052 0.0050 f. 0.0065
Dg 0.0064 ? 0.0093 0.0091 t 0.0107 0.0111 2 0.0122 D, 0.0119 t 0.0150 0.0100 f 0.0124 0.0145 f. 0.0135
a
0.0070 f 0.0086 0.0039 f 0.0047 0.0106 f. 0.0091Dg 0.0030 t 0.0034 0.0029 f 0.0036 0.0060 2 0.0067
D, 0.0026 f. 0.0036 0.0051 2 0.0063 0.0040 f 0.0034
9, 0.0029 f. 0.0041 0.0031 f 0.0032 0.0034 f. 0.0054
Dg 0.0077 t 0.0089 0.0149 f 0.0242 0.0097 2 0.0129
D, 0.0119 f 0.0153 0.0250 f 0.0404 0.0164 ? 0.0222 9, 0.0057 f 0.0075 0.0114 f 0.0168 0.0069 ? 0.0098
Dg 0.0016 t 0.0023 0.0017 f 0.0023 0.0017 f 0.0022
D, 0.0019 f 0.0027 0.0045 f 0.0066 0.0014 t- 0.0014
L&, 0.0010 f 0.0013 0.0034 2 0.0047 0,0018 f 0.0017
Dg 0.0069 f 0.0094 0.0073 t 0.0068 0.0082 f 0.0100 D, 0.0118 t 0.0165 0.0127 f 0.0137 0.0104 f 0.0125
Dg 0.0069 t- 0.0085 0.0068 2 0.0088 0.0054 f 0.0052
Dg 0.0027 f. 0.0036 0.0026 2 0.0035 0.0033 2 0.0041 D, 0.0040 lr 0.0044 0.0024 f 0.0037 0.0020 2 0.0021 9, 0.0028 f 0.0033 0.0035 f 0.0043 0.0028 f 0.0034
Dg 0.0039 f 0.0050 0.0079 f. 0.0093 0.0077 f 0.0088
D, 0.0068 f 0.0089 0.0176 f 0.0201 0.0111 f 0.0136 9, 0.0030 t 0.0039 0.0097 t- 0.0110 0.0053 f 0.0068 Values are means f SD for the coefficients Dg, gametic (total) disequilibrium; D,, within gamete disequilibrium; and
a,
between gamete disequilibrium. lrOl2
2r01
3
3r01
4
4r0 1
(for both loci), the frequencies of ab gametes types are reduced (from ca. 0.25 to ca. 0.04), and the frequencies of aabb genotypes are greatly reduced
(e.g.,
at genera- tion 200 the averages ranged from ca. 0.004 to 0.0120 depending on the model; thus the number of aabb ge- notypes in populations ranged from ca. 40 to 120). Even in these cases substantial patches of aabb genotypes oc- cur. Although the SNDs for aabb X aabb joins are re- duced, the SNDs averaged over all four double homozy- gotes are scarcely changed. Further skewing of allele frequencies might have greater effects. It should be noted that the excess frequencies of homozygotes(which in turn reflects the patchy structure) indicate substantial inbreeding, analogous to the single-locus cases where F,, averages about 0.33, 0.15, in models 1
and 2.
Two-Locus Spatial Structure 373
0.2
0.1
-0.1
-0.2
I
I I I I I I I I I0 1 2 3 4 5 6 7 6 9 1 0
Distance
FIGURE 11. -Average I-correlograms for quadrat average genotypic values for quantitative traits for each set, at genera- tion 200: symbols same as in Figure 2.
over a wide range of amounts of dispersal, Ne from near
0 up to cu. 50. However, those for the distances up to three or four were substantially reduced, as Ne in- creases. This remarkable change in structure is also ob- served in single-locus autocorrelations (B. K. EPPERSON,
unpublished data). Thus when dispersal is increased, there is a greater degree of mixing of double homozy- gotes with other genotypes at very small spatial scales, and this may primarily occur in areas along the perime- ters of patches and elsewhere outside of well-defined patches.
In sum, the results indicate that substantial patches of double homozygotes will be present in populations under a wide range of conditions. Moreover, the magni- tudes of the SNDs suggest that the patch structure should be easily detected in samples of moderate size, when these are collected on an appropriate spatial scale
(EPPEFSON 1990b), in real populations.
The high sensitivity of SNDs for the shortestdistance classes to exact level of dispersal should provide a pow- erful tool in experimental studies, and suggests that good estimates of dispersal could be obtained solely from samples of standing spatial distributions of multilocus genotypes (see also B. K. EPPERSON, u n p u b lished data).
Spatial patches of double homozygotes can cause striking levels of linkage disequilibrium even among unlinked loci, at some spatial scales. For example, if a sample covered an area containing mostly two patches of opposite double homozygotes (e.g., one of aubb, the other of AABB), there would be near maximal linkage disequilibrium in the sample. This is in some ways anal- ogous to a two locus “Wahlund effect” (.g., PROUT
1973), for models of discrete populations which ex- change migrants and experience genetic drift (see also
CHRISTIANSEN and FELDMAN 1975). Thus substantial dis- equilibrium can be created from purely stochastic pro-
0.7
0.2
0.1
I
0- O . l L
-0.2
0 1 2 3 4 5 6 7 a 9 1 0
Distance
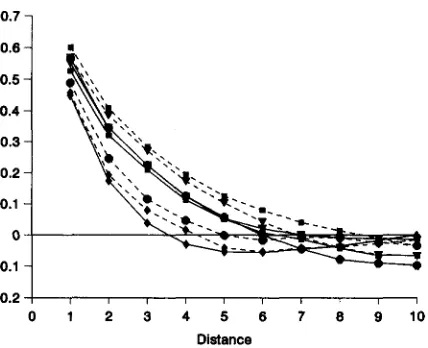
FIGURE 12. -Average I-correlograms for quadrat average genotypic values for quantitative traits for each set with skewed gene frequencies, at generation 200: symbols same as in Fig- ure 10.
cesses, and this could be misinterpreted as evidence of epistatic selection or hitchhiking effects. In contrast, values of linkage disequilibrium in the total simulated populations are near 0 for unlinked loci, and they are very small even when loci are tightly linked. The popula- tions are large enough so that patches (and concentra- tions) of all combinations of genotypes for each locus are likely to be present in approximately equal num- bers. This illustrates how spatial structure-caused link- age disequilibrium depends on spatial scale.
The SND correlograms for other combinations of genotypes group into distinct categories, and these gen- erally reflect weaker autocorrelations than those be- tween double homozygotes. Values of SNDs for joins between like (identical) single heterozygotes indicate that single heterozygotes are substantially concentrated into large regions. However, these regions are not as well defined as patches of double homozygotes; conti- guity is relatively low, because matings between hetero- zygotes produce on average 50% homozygotes (B. K. EPPERSON, unpublished data). These features were evi- dent for the entire spectrum of gene frequencies and recombination rates studied. In addition, increasing dispersal had effects similar to those on the SND corre- lograms for like double homozygotes. Correlograms for joins between like double heterozygotes indicate that concentrations of like double heterozygotes are weaker still, because of the added effects of recombination. However, when recombination was low, the values of these SND statistics approached those for like single heterozygotes, apparently indicating that then gametes behave similarly as alleles in these highly stochastic models.
374 B. K Epperson
patches and concentrations described above. The most significant of these were the excess of joins between double homozygotes and single heterozygotes differing by only one gene and the deficits for joins in which the heterozygote had the opposite homozygous genotype at the second locus. Evidently this results from juxtapo- sition of areas of concentrations of single heterozygotes and areas containing patches of double homozygotes. Analogous associations of heterozygotes with homozy- gotes are observed in single locus distributions
(B.
K.EPPERSON, unpublished data). The SNDs for other types of specific unlike joins were close to 0. Overall, the great deficits of total numbers of unlike joins are caused primarily by the patches of double homozygotes and to a lesser extent by the concentrations of single-locus heterozygotes.
The multilocus structures in the simulations also re- veal some new features of spatial distributions of ge- netic variation for quantitative traits within popula- tions. The I-correlograms for average genotypic values in quadrats, exhibit high spatial autocorrelations. Much of this is caused by the patches of double homo- zygotes. When recombination was highly restricted ( r = 0.01), the forms of the structures for other geno- types were somewhat changed, but the I-correlograms for quantitative traits were virtually unchanged from the free recombination case. This indicates that these correlations probably obtain for a wide range of link- age arrangements.
These results on new features of strong spatial struc- turing and autocorrelations for traits controlled by two loci, may hold true for a wide variety of quantitative traits, even though these may be selectively neutral, as was the case in the present study. Because of the domi- nance of the stochastic spread of two-locus double ho- mozygotes into patches, even for unlinked genes, we might expect that for a quantitative controlled by three, four, five, etc. loci, that the underlying multilocus struc- ture will be dominated by patches of triple, quadruple, quintuple, etc., homozygotes. Thus the genic effects of the loci on the trait will be strongly autocorrelated. Indeed it seems that spatial correlations for traits con- trolled by several loci should often be near those o b served in the present models. The I-statistics for two- locus traits are very close to those for the analogous statistics calculated for gene frequencies for single loci, using the same quadrat system (SOW et al. 1989). This correspondence indicates that it should not matter how the degrees of effects on the trait are distributed among the contributing loci. However, one proviso is that if there are very many loci then it seems possible there could be some differences, owing to the improbability of getting patches of multilocus homozygotes for the rare alleles, but this awaits further study. It is worth pointing out that dominance or epistatic interactions (unless extreme) would likely result in only slight
changes in spatial correlations. Finally, we may expect that when there is substantial environmental variation
( i e . , adding substantial spatially random noise to the phenotypes) weighted against genotypic variation, the spatial correlations of the phenotype would be reduced correspondingly, depending on the heretibility of the trait. Nonetheless, these results suggest there should be substantial spatial autocorrelations for quantitative traits of wide variety of conditions, even though these may be selectively neutral, in many populations with low-to-moderate levels of dispersal. It is noted that selec- tion gradients may substantially change the spatial cor- relations, according to the migration rates (e.g., ZHIVO- TOVSKY and FELDMAN 1993).
This work was supported by National Institute of General Medical Sciences grant GM-48453 to the author and by a grant from the San Diego Supercomputing Center for use of SDSC computing facilities.
LITERATURE CITED
ARGms, A. Z., and J. SCHMIIT, 1991 Microgeographical genetic structure of morphological and life history traits in a natural population of Impatiens capensis. Evolution 4 5 178-189. CHRISTIANSEN, F. B., and M. W. FELDMAN, 1975 Subdivided popula-
tions: a review of one- and two-locus deterministic theory. Theor. Popul. Biol. 7: 13-38.
CLIFF, A. D., and J. K. O m , 1981 Spatial Processes. Pion, London. EPPERSON, B. IC, 1990a Spatial autocorrelation of genotypes under
directional selection. Genetics 124: 757-771.
EPPERSON, B. K., 1990b Spatial patterns of genetic variation within plant populations, pp. 229-253 in Pqlmlation Gaetics and Germ-
plasm Resources in Cmp Impmement, edited by A. H. D. BROWN, M. T. CLECG, A. L. KAHLER, and B. S. WEIR. Sinauer Associates, Sunderland, MA.
EPPERSON, B. K., 1993 Recent advances in correlation studies of spatial patterns of genetic variation. Evol. Biol. 27: 95-155. EPPERSON, B. K., and R. W. ALLARD, 1989 Spatial autocorrelation
analysis of the distribution of genotypes within populations of lodgepole pine. Genetics 121: 369-377.
EPPERSON, B. R, and M. T. CLEGC, 1986 Spatial autocorrelation analysis of flower color polymorphisms within substructured p o p ulations of morning glory (Ipomoea purpurea). Amer. Nat. 1 2 8 GILLOIS, M., 1966 Le concept d’identite et son importance en gen- LANDE, R., 1991 Isolation by distance in a quantitative trait. Genetics LEWONTIN, R. C., and J. K R A K A U E R , 1973 Distribution of gene fre- quency as a test of the theory of the selective neutrality of poly- morphisms. Genetics 7 4 175-195.
840-858.
etique. Ann. Genet. 9 58-65. 1 2 8 443-452.
MALFCOT, G., 1948 LRs M a t h h t i q u e s de L’Hkriditi. Masson, Pans. NAGIZAKI, T., 1994 Geographical variation in a quantitative charac-
ter. Genetics 136: 361-381.
PROUT, T., 1973 Appendix to MITTON, J. B., and R. K. KOEHN, Popu- lation genetics of marine pelecypods. 111. Epistasis between func- tionally related isozymes in M y t i h edulis. Genetics 73: 487-496. ROGERS, A. R., and H. C. WENDING, 1983 Population structure
and quantitative characters. Genetics 105: 985-1002.
ROHLF, F. J., and G. D. SCHNELL, 1971 An investigation of the isola- tion-bydistance model. Amer. Nat. 105: 295-324.
SCHOEN, D. J., and R. G . LKITA, 1989 Spatial autocorrelation of genotypes in populations of Impatiens pallida and Impatiens ca- pensis. Heredity 6 3 181-189.
SLATKIN, M., and H. E. ARTER, 1991 Spatial autocorrelation methods in population genetics. Am. Nat. 1 3 8 499-517.
Two-Locus Spatial Structure 375
ZWEIG. International Cooperative Publishing House, Fairland, MD.
SOKAL, R. R., 1988 Genetic, geographic, and linguistic distances in Europe. Proc. Nat. Acad. USA 85: 1722-1726.
SOKAL, R. R., and G. M. JACQUEZ, 1991 Testing inferences about microevolutionary processes by means of spatial atuocorrelation analysis. Evolution 45: 152-168.
SOKAL, R. R., and N. L. ODEN, 1978a Spatial autocorrelation in biology. I. Methodology. Biol. J. Linn. SOC. 1 0 199-228. SOKAI~, R. R., and N. L. ODEN, 1978b Spatial autocorrelation in
biology. 11. Some biological implications and four applications of evolutionary and ecological interest. BIOI. J. Linn. SOC. 10:
Sow, R R., and N. L. ODEN, 1991 Spatial autocorrelation analysis as an inferential tool in population genetics. Am. Nat. 138: 518-521. SOKAL, R. R., and D. E. WARTENBERG, 1983 A test of spatial autocor-
relation analysis using an isolation-bydistance model. Genetics 105: 219-237.
229-249.
SOW, R. R., G. M. JACQUEZ and M. C. WOOTEN, 1989 Spatial auto- correlation analysis of migration and selection. Genetics 121:
TuRNER,M.E.,J. C.STEPHENSandW.W.ANDERSON, 1982 Homozygos- 845-855.
ity and patch structure in plant populations as a result of nearest- neighbor pollination. Proc. Natl. Acad. Sci. USA 7 9 203-207. WAGNER, D. B., Z.-X. SUN, D. R. GOVINDARAJU and B. P. DANCIK, 1991
Spatial patterns of chloroplast DNA and cone morphology varia- tion within populations of a Pinus banknand'inus contorta sympat- ric region. Am. Nat. 1 3 8 156-170.
WEIR, B. S., 1979 Inferences about linkage disequilibrium. Biomet- rics 35: 235-254.
WRIGHT, S., 1943 Isolation by distance. Genetics 28: 114-138. ZHIVOTOVSKY, L. A,, and M. W. FELDMAN, 1993 Heterogeneous se-