Quality Improvement for Dimensional
Variations in sand Casting Using Quality
Control Tools
Abhijeet B. Vante 1, G.R.Naik 2
P.G. Student, Dept. of Production Engineering, KIT’s College of Engineering, Kolhapur, Maharashtra, India1
Associate Professor, Dept. of Production Engineering, KIT’s College of Engineering, Kolhapur, Maharashtra,
India2
ABSTRACT: Quality improvement in simple terms is anything which causes a beneficial change in quality
performance. Improvement can be achieved by either better control or by raising standards. This paper focuses on better control to solve the problem of dimensional variations in 3 cylinder metric block casting. Quality improvement will be achieved by using quality control tools. A proper methodology is formed consisting of various quality control tools such as Pareto analysis, Ishikawa diagram (cause and effect diagram), brainstorming, why-why analysis. After implementation of this methodology a better control over the process will be obtained. Detailed analysis of root cause will result into the permanent solution to the problem. Successful implementation of the remedies results into reduced rejection rate of casting and quality improvement.
KEYWORDS: Quality Improvement, Pareto Analysis, Ishikawa Diagram, Quality Control Tools, Brainstorming,
casting.
I.INTRODUCTION
The ISO definition of quality improvement states that it is the action taken throughout the organization to increase the effectiveness of activities and processes to provide added benefits to both organization and its customers. Doing better what is already done is improvement but so is doing something new. Quality improvement can be achieved by better control or by raising standard [4].
Foundry industries are facing problems due to poor quality of castings. Quality of casting is badly affected by casting defects. Defects occur when a casting is deviated from specified grade and specification [8]. There are several types of casting defects such as metallurgical defects, surface defects and dimensional errors etc. In this paper focus will be on dimensional variations or dimensional errors.
Dimensional variations occur at wall thickness of the casting. It causes defect in the casting leading to poor quality. Thick casting wall will cause wastage of material whereas thin wall will result into breakage of casting wall. Current process in the market to solve this problem is by using CAD software. But this is time consuming and complex process [1].
II.LITERATURE SURVEY
Bhaskar sinha (2007): Wall thickness is an important parameter for casting design. Optimal wall thickness is necessary for sufficient strength of the part. There is continuous demand for the defect free, high quality part in market. In case of power train applications, in which parts are manufactured by die casting, both thin and thick wall thickness causes casting defects. The current process of checking the wall thickness involves cut section of design along the standard axis X, Y and Z. it is carried out by using CAD softwares. This process is time consuming and also leads to defect due to missed areas. In this paper, new approach for measuring wall thickness is presented by using a tool called GeomCaliper. The ray and sphere algorithm is used for thickness measurement. With this new approach process consumes less time. Also this process is automated and accurate.
K.Gawdzinska (2011): Metallic composite castings are used in various applications due to reduced mass and higher durability. Due to complex structure of composites, quality control is very difficult. Management tools such as Pareto charts and Ishikawa diagrams are used for collection and processing of data. These tools are used for identification and prioritization of casting defects. Pareto chart (80:20 principles), which is identification of 20% causes which contribute to 80% defects. Identification of major causes allows improvement of process. Ishikawa diagram which is also a very important management tool, gives the cause and effect relationship. All the causes and sub causes are presented in a fishbone diagram. Then the research is carried out to find severity of each cause by assigning weight to them. Then the problem is solved by taking suitable measures.
U.C.Nwaogu, N.S.Tiedje (2011): The use of foundry coating for moulds and cores during casting is very necessary. It
helps in achieving high quality surface finish of casting especially in complex channels by use of core. Though casting quality depends upon sand grade but there are other factors also to be considered such as, ability to vent off the gases produced during casting, economic use of binder, and non-availability of sand with required grade. This shows that use of coating has got prime importance. Since moulds and cores are porous in nature, if we want to avoid metal penetration, we should cover them with coatings. Coating provide better surface finish and it avoid certain defects such as metal penetration, erosion etc. in this paper, details regarding components of casting, its characteristics are studied. This review paper provides further scope of research for using Sol-Gel process.
Ketki Kaskhedikar, Harish Katore (2013): This paper focuses on trade off between productivity and quality. For producing castings with desired quality there should be a balance between quality management and productivity. Quality and productivity often relate to change in design or increase in production. But actually it is managing the present system and resources to extract most out of it. Various quality control tools are also discussed in this paper such as 7 QC Tools, 5S, KAIZEN, SIX SIGMA, JIT, ISO etc. Quality management for foundry can be achieved through these tools. Quality improvement doesn’t always means something new but it is better control also. Productivity on the other hand is the amount of output we are getting for given input. Various internal and external factors are discussed which affects productivity.
B.R.Jadhav, Santosh Jadhav (2013): In this paper a casting defect named cold shut is diagnosed for its causes. Seven quality control tools are used to find the root cause of the problem. Cold shut is a visual and structural discontinuity. The quality control tools used consists of Pareto diagram, Control charts, Scatter diagram, Histogram, Ishikawa diagram and Brainstorming etc. Automotive cylinder block is taken under study. Rejection data of 3 months is collected and analysed. This data is represented by using various quality controls tools such as Histogram, Control charts and Ishikawa diagram. From this data we can diagnose the casting for defects and their causes in an early stage. A systematic approach for rejection control using seven quality control tools is discussed in this paper. Here in this case alloy composition and pouring temperatures were the root causes of the problem. Total rejection is reduced to 6.6% from 12.3%.
Aniruddha Joshi, L.M.Jugulkar (2014): In this paper research is carried out in automotive component manufacturing
data collection. Ishikawa diagram for each of the defect for selected component is represented. Then the remedies to these causes are enlisted. Changes are suggested such as changing production line, hardness of mould box etc. This systematic approach in rejection control helps in reducing defects by 70%.
B.Surekha, D.Hanumanta Rao, G.Krishna Mohana Rao, Pandu R.Vundavilli (2014): In this paper an expert
system is developed for chromite based resin bonded sand core. Purpose of designing this system is to study the mechanical properties of sand cores such as hardness, compression strength, collapsibility, tensile strength, hot strength, and shear strength. In this paper fuzzy logic approach is used to study the properties of sand core. A knowledge based scheme is developed. It consists of forward and reverse modelling. A three step approach is used for prediction of properties in foundry. Purpose of referring this paper is to study the mechanical properties of sand core.
Sunil Choudhary, Hemant Thakkar (2014): Indian foundry industry facing problems due to lack of quality and reduced productivity. These problems arise due to casting defects. In this paper various types of casting defects are represented with their possible causes and remedies. This paper gives information about gas defects, shrinkage cavities, metallurgical defects, moulding material defects etc. This is a review paper consisting of various techniques, suggested to reduce casting defects. Techniques discussed in this paper are X-Ray inspection, Artificial neural network (ANN) and casting simulation techniques. Use of seven quality control tools to reduce casting rejection percentage as standard methodology is also given in this paper.
Literature survey is carried out to analyse the depth of work in the field of casting rejection control. Various casting defects such as cold shut, mould shifting and dimensional errors etc. are reported along with the methodology to overcome the defect. Various methodologies are represented consisting of management tools such as 7QC tools, Kaizen, JIT and 5S etc. Some authors also reported their work carried out by using problem solving techniques such as ANN, X-ray techniques and fuzzy logic etc. The problem of dimensional variations at casting wall thickness is reported. But it is solved by using CAD softwares and special tools such as GeomCaliper. Study regarding use of quality control tools for quality improvement by minimizing Dimensional Variations is not reported. And it is identified as the research gap. Thus research can be carried out to achieve quality improvement by using QC tools to obtain better control.
III.STUDY OF CURRENT PRACTICES
Problem Associated with Existing Technique-
The rejection data for past five months is collected from a single foundry. Company produces 3 cylinder metric blocks and this product is casted in company foundry. The product taken under study is facing the problem of increased rejection. Due to this company is losing significant amount of revenue. The casting process of the particular product is studied carefully. The past data containing dimensions of product, specification, process flow is studied. The product is inspected for various casting defects. Two problems were accounted which are observed in physical examination of the product during inspection. The problems are listed below-
1. Increased rejection percentage of the product.
2. Lack of proper investigation and analysis of the product.
1. Increased rejection percentage of the product –
The product is facing the problem of increased rejection percentage. Company targets zero defects and requires as minimum rejection percentage as possible. If the rejection of the particular product continues for a longer period of time then it is threat to the product quality as well as to customer satisfaction. Also it is affecting company’s revenue in a bad manner. The average rejection percentage is increased to 10.17 in the month of January 2015.
2. Lack of proper investigation and analysis of the product-
Study of the manufacturing process flow-
Fig. 1 shows flow of casting process. Casting of product is carried out in company’s state of the art foundry. A process flow is a graphical representation that identifies the steps of the process. Machining of the particular product is outsourced. Since research needs casting rejection analysis, detail study of casting process of the particular product is carried out. Process flow can be represented in the following manner.
Fig. 1 Process Flow Chart of Sand Casting [6]
Rejection Data collected from study of process flow-
3 cylinder metric block is facing the problem of increased rejection due to casting defects. Before proceeding forward to find the root cause and implementing the QC tools to solve the problem, the past data should be collected. Since process flow is examined, rejection data is tabulated and is given below-
3 Cylinder Metric Block rejection details-
1. Monthly rejection-
Table 1 percentage rejection of five months in 2015 Fig. 2 Graphical representation of monthly rejection in 2015
Fig. 2 gives the graphical representation of the monthly rejection data of 3 cylinder metric block. The data is taken from Table 1.The bars are crossing the rejection value of 10% indicating there is scope for improvement.
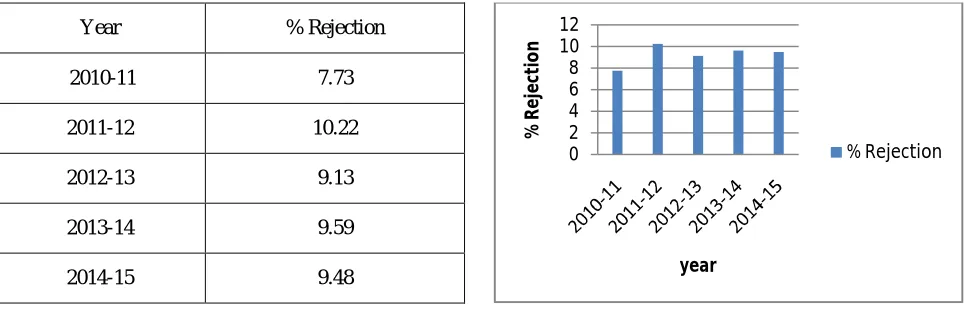
2. Yearly Rejection-
Table 2 shows yearly rejection from the year 2010 to 2015.It shows average rejection level to be 9.23%. 3 cylinder metric block is under production since 2010. Value of average rejection percentage can be lowered by using suitable quality control tools.
Table 2 Yearly rejection percentage of five years from 2010 to 2015 Fig. 3 Graphical representation of yearly rejection percentage
Fig. 3 represents the rejection data from table 2 in graphical form. Average rejection value is 9.23%. Though the rejection percentage is stable over 9, but it is causing significant loss and it needs to be minimized.
3. Rejection Details (Jan’15)-
Table 3 shows the initial phase of study where rejection for the month of January is 10.17%. The data for the month of January is presented because the problem is reported in that month. Total castings poured in the particular month were 1317. Out of those 134 castings were rejected.
0 2 4 6 8 10 12 14
Jan Feb Mar Apr May
% R ej e ct io n Month % Rejection 0 2 4 6 8 10 12 % R e je ct io n year % Rejection
Months(2015) % Rejection
Jan 2015 10.17
Feb 2015 7.14
Mar 2015 6.91
Apr 2015 11.8
May 2015 11.8
Year % Rejection
2010-11 7.73
2011-12 10.22
2012-13 9.13
2013-14 9.59
Castings poured(nos.) Castings Rejected(nos.) % Rejection
1317 134 10.17
Table 3 Rejection details for month of January when problem is reported
4. Revenue Loss due to Rejection (Jan’15)-
Table 4 gives the revenue loss for the month of January when problem is reported. Total castings poured in the particular month were 1317. Out of these 134 castings are rejected. Since the cost of each product is 8000 Rs. The total Revenue Loss is 10, 72,000 Rs.
Castings Poured(nos.) Castings Rejected(nos.) Cost of a 3-cylinder metric block in Rs.
Total Revenue Loss In Rs.
1317 134 8000 10,72,000
Table 4 Revenue loss for month of January when problem is reported
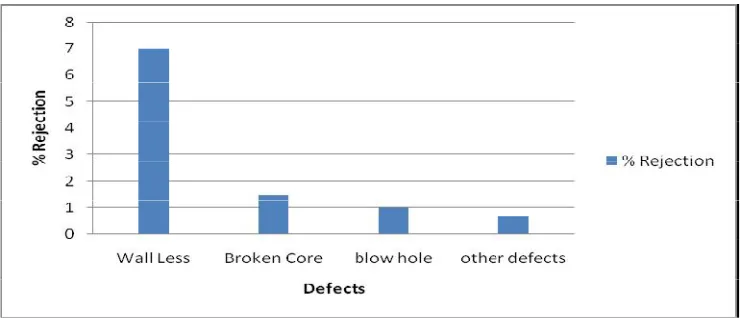
Pareto
Analysis-Pareto Analysis is a simple technique for prioritizing possible changes by identifying the problems that will be resolved by making these changes. By using this approach, one can prioritize the individual changes that will improve the situation. Pareto Analysis uses the Pareto Principle – also known as the "80/20 Rule" – which is the idea that 20% of causes generate 80% of results. This tool is used to find the 20% of work that will generate 80% of the results that doing all of the work would deliver. The average rejection percentage is 10.17. Various defects contribute in the rejection of the product under study. These defects along with their respective percentage are represented on a graph, from this we come to know that which defect has maximum contribution in rejection.
Pareto Analysis for Defect Categorization-
Fig. 4 gives the Pareto analysis for the defect categorization of metric block. In fig. 4 various defects are arranged according to their respective rejection percentage. From the Pareto analysis it is clear that dimensional variations in casting wall thickness i.e. wall less is the problem which has maximum contribution in rejection percentage. Wall less contributing 7% in the total rejection of 10.17%, so minimizing wall less will result into optimum rejection percentage of 3 Cylinder Metric Block.
Ishikawa Diagram (Cause and Effect Diagram)-
Another tool of quality management used in this work is the cause and effect diagram, also known as the fishbone diagram or Ishikawa diagram. It represents cause and effect relationships, it helps to separate the effects from causes of a problem and to minimize the complexity of the problem. Ishikawa developed the cause and effect diagram in which the analysis starts from the identified effect (e.g. defect, failure or another undesired condition) and leads to the identification of all possible causes of that effect. Fig. 5 gives the representation of all major causes and subcauses which contribute to the problem of dimensional variations in sand casting. Causes such as Cutting geometry, pattern equipment, moulding, core making, planning and control, heat treatment, casting cooling, feeding and running are represented along with their subcauses.
Fig. 5 Cause and Effect Diagram for Dimensional Variations in Sand Casting [9]
Outcome of process analysis-
Increased rejection percentage of 3 Cylinder Metric Block is the problem faced by the organization. By studying the casting process and from the past data it is clear that, finding the root cause of the problem is the way to lower the rejection percentage to optimum level. From Pareto it is clear that wall less is responsible for the increased rejection percentage. And it needs to be minimized. This can be achieved by implementing quality control tools such as Pareto analysis, Ishikawa diagram, why-why analysis, brainstorming, etc. Phase-I of project is focused on identification of root causes of rejection and phase-II of the project is aimed at implementing the stated methodology for achieving consistency in the production of 3 cylinder metric blocks through quality improvement.
IV.METHODOLOGY
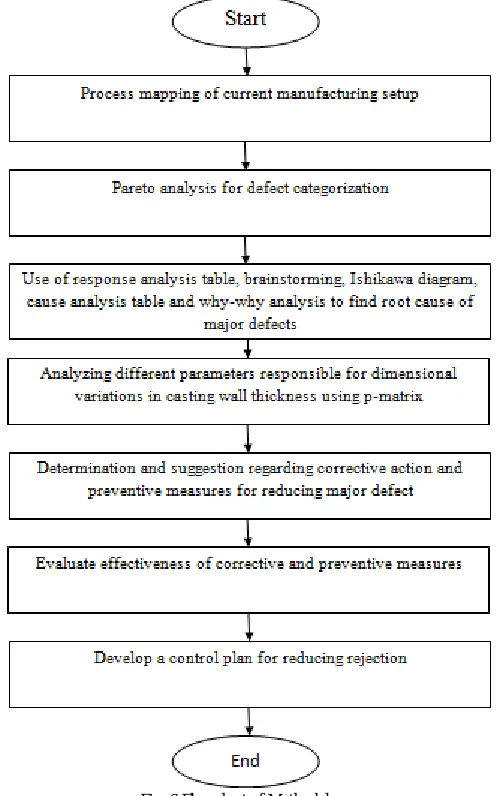
A methodology is formed to accomplish the objectives. This will form the guidelines and it will result into the minimization of the issue. The methodology is as follows.
1. Process Mapping of current manufacturing setup.
2. Using Pareto analysis (80:20 Principle) for defect categorization.
3. Using Response Analysis Table, Brainstorming, Ishikawa diagram, Cause Analysis Table, Why-Why analysis to find the root causes of major defects.
5. Determination and suggestion regarding corrective action and preventive measures for reducing major defects.
6. Evaluate effectiveness of corrective actions and preventive measures.
7. Develop a control plan for reducing rejection.
Flowchart of methodology-
The problem of dimensional variations at casting wall thickness (wall less) is causing the rejection of metric block. A systematic methodology is needed to use quality control tools for quality improvement. Fig. 6 gives the step-by-step methodology in the form of flow chart. It starts from understanding the current manufacturing setup and continues till development of control plan. It makes use of the various quality control tools such as Pareto analysis, why-why analysis, Ishikawa diagram and brainstorming.
V.SIMULATION AND RESULTS
This paper discusses the initial phase-I of the project. So the simulation will be carried out when solution to the issue of dimensional variation at casting wall thickness is obtained. Scope of this paper covers the study of process flow, root cause analysis, cause and effect relationship and formation of methodology to reduce the rejection rate using quality control tools. Table 5 indicates the results obtained in terms of tools used, issues and proposed action from the research carried out so far. It clearly indicates the outcomes from the research.
Tool Used Issues Proposed Action
Process flow Monthly and yearly rejection data is collected and analysed. Average rejection value for monthly rejection is 9.564%. Yearly rejection shows average rejection level to be 9.23%.
quality improvement is suggested by using quality control tools such as Pareto analysis, Ishikawa diagram, why-why analysis, brainstorming etc. To achieve 50% reduction in average rejection percentage.
Pareto Analysis (Root cause analysis)
Metric block is diagnosed with defects such as wall less, broken core, blow hole etc.
Determination of root cause using Pareto analysis. It shows wall less as root cause. It contributes 7% in the rejection percentage of 10.17(Jan 2015)
Ishikawa Diagram(Cause and effect relationships)
Dimensional Variation at casting wall thickness is reported. It is resulting in significant revenue loss.
Representation of all causes and subcauses in Ishikawa diagram. Casting wall thickness is cause of dimensional variations.
Table 5 Results obtained from the Initial Research
VI.CONCLUSION
Producing castings of specified quality and in scheduled time is challenge for every foundry industry. Defect free casting with improved quality gives competitive advantage in market. Companies are therefore implementing various quality standards such as KAIZEN, 7QC TOOLS, and TPM etc. This paper discusses the application of quality control tools for reducing rejection rate of castings and thus improving quality of casting by better control. Initial research shows that casting is facing higher percentage of rejection due to dimensional variations at casting wall. Average rejection percentage for last five months is 9.564. Average rejection percentage for last five years is 9.23. Revenue loss in the month of January 2015 is 10, 72,000 Rs. This indicates that there is scope for the quality improvement of casting.
REFERENCES
[1] Sinha, B., “Efficient Wall Thickness Analysis Methods for Optimal Design of Casting Parts”, Engineering Design, 2007.
[2] Gawdzinska, k., “Applications of the Pareto Chart and Ishikawa Diagram for the Identification of Major Defects in Metal Composite Castings”, Archives of Foundry Engineering, Vol. 11, pp.22-28, 2011.
[3] Nwaogu, U.C., Tiedje, N.S., “Foundry Coating Technology: A Review”, Material Science and Applications, Vol.2, pp.1143-1160, 2011. [4] Kaskhedikar, K., Katore, H.V., “Improvement of Quality and Productivity in Casting Industries”, Mechanica Confab, Vol. 2, No.3, 2013. [5] Jadhav, B.R., Jadhav, S.J., “Investigation and Analysis of Cold Shut Casting Defect and Defect Reduction by Using 7 Quality Control Tools”,
International Journal of Advanced Engineering Research and Studies, Vol. II/IV, pp.28-30, 2013.
[6] Joshi, A., Jugulkar, L.M., “Investigation and Analysis of Metal Casting Defect and Defect Reduction by Using Quality Control Tools”, International Journal Of Mechanical And Production Engineering, Vol.2, Issue-4, 2014.
[7] Surekha, B., Rao, D.H., Rao, G.K. And Vundavilli, P.R., “Design and Development of Knowledge Bese Scheme for Chromite Based Resin Bonded Sand Core System”, Procedia Material Science (ICMPC), Vol.6, pp.919-925,2014.
[8] Chaudhari, S., Thakkar, H., “Review on Analysis of Foundry Defects for Quality Improvement of Sand Casting”, Journal of Engineering Research and Applications, Vol.4, pp.615-618, 2014.
BIOGRAPHY
Abhijeet B. Vante is PG student studying M.E. Mech. (Prod) in KIT’s College of Engineering, Kolhapur. The topic of his dissertation is ‘Quality Improvement For Dimensional Variations In 3 Cylinder Metric Block Using Quality Control Tools’.
![Fig. 1 Process Flow Chart of Sand Casting [6]](https://thumb-us.123doks.com/thumbv2/123dok_us/1666009.1209348/4.595.145.445.253.587/fig-process-flow-chart-sand-casting.webp)
![Fig. 5 Cause and Effect Diagram for Dimensional Variations in Sand Casting [9]](https://thumb-us.123doks.com/thumbv2/123dok_us/1666009.1209348/7.595.140.458.299.485/fig-cause-effect-diagram-dimensional-variations-sand-casting.webp)