Process Simulation and Optimisation of High Pressure
Disruption for the Release of Intracellular Proteins.
by
Somaiya Fatima Siddiqi
A Thesis submitted for the degree of Doctor of Philosophy at the University of London, December 1997
The Advanced Centre for Biochemical Engineering
ProQuest Number: U643846
All rights reserved
INFORMATION TO ALL USERS
The quality of this reproduction is dependent upon the quality of the copy submitted.
In the unlikely event that the author did not send a complete manuscript and there are missing pages, these will be noted. Also, if material had to be removed,
a note will indicate the deletion.
uest.
ProQuest U643846
Published by ProQuest LLC(2016). Copyright of the Dissertation is held by the Author.
All rights reserved.
This work is protected against unauthorized copying under Title 17, United States Code. Microform Edition © ProQuest LLC.
ProQuest LLC
789 East Eisenhower Parkway P.O. Box 1346
ABSTRACT
The aim of this study was to simulate high pressure homogenisation and to examine the use of simulation techniques in identifying optimal strategies for integrating this unit operation with the fermentation process.
The first part of this thesis describes the models developed to predict changes in homogenate particle size distributions (PSDs) generated during the high pressure homogenisation of packed baker’s yeast Saccharomyces cerevisiae. The influence of homogenisation conditions on the value of dso, where dso is the particle size below (or above) which 50% of the particles in the total PSD lie, is explained using the following mathematical expression;
log.
d s 0 .N = 0 d 5 0 .N = 0 " d s o= ko A p“
where, dso, n=ois the dso value for the whole cells, N is the number of passes; AP = (P - P*), P
is the operating pressure , P* is the threshold pressure i.e. the pressure below which there is no significant cell disruption occurring, ko is a rate constant and; P and a are the exponents of N and AP, respectively. For baker’s yeast the value of P was found to be -0.4 and the value of a was found to be -1.
A Boltzman-type equation was then found to predict the total PSD using dso as an input parameter.
The second part of this thesis details work carried out to deduce whether the scale of high pressure homogeniser used has any effect on the cell disruption process. It was found that for the production scale, pilot scale and small scale homogenisers tested, packed baker’s yeast cell disruption kinetics was independent of homogeniser capacity.
characteristics were independent of initial cell concentrations between the range of 1 - 45% wet cell weight/ L for packed baker’s yeast.
The above results were then used to define a scaled-down cell disruption process. This scaled-down process can now be used in process verification studies of large scale processes.
The final part of this thesis describes the impact of fermentation and processing conditions on the disruption of baker’s yeast. It was found that cell cultures grown using high dilution rates, defined media, aerobic growth conditions, or harvested during early growth phase were more susceptible to disruption than cell cultures grown using low dilution rates, complex media, anaerobic growth conditions or harvested during late growth phase. It was also found that cell cultures that were stored at 4°C post harvesting became more resistant to disruption with time. This interaction between the fermentation process conditions on the cell disruption unit operation was modelled. It was found that there is a linear relationship (regression coeflScient >0.94) between the cell disruption rate constant k o and the initial whole cell d s o (i.e. d s o , n=o) ,
irrespective of growth rate, growth phase and storage time but not irrespective of growth media. A weaker linear relationship (regression coeflBcient = 0.79) between the cell disruption rate constant k o and the initial whole cell d s o (i.e. d s o ,N = o ) was found, irrespective of growth
media, growth rate, growth phase and storage time. These linear models give reasonable first approximations of k o given only the initial d s o value of the whole cell culture PSD and
provide a convenient quantitative measure of the efifect of changing upstream fermentation conditions on the subsequent stage of high pressure homogenisation.
ACKNOWLEDGEMENTS
I am very grateful to my supervisor, Dr Nigel Titchener-Hooker for his continued guidance, support, enthusiasm and stimulating discussions during the years I have spent at University College, London.
I would like to thank Dr Parvis Ayazi Shamlou for his guidance and support.
I would also like to thank the technical staff of the department for their invaluable help, in particular Mr Billy Doyle, Mr Martin Vale and Mr Clive Osborn. Thanks are also due to Dr Mitra Dehghani and Dr Malcolm Gregory for their contribution towards conducting the fermentations.
Where there is an open mind there will always be a frontier.
Table of Contents
Page
Abstract 2
Acknowledgements 5
Table of Figures 11
Table of Tables 23
1 Introduction 25
1.1 Methods of Cell Disruption 25
1.1.1 Small-Scale Cell Disruption 29
1.1.1.1 Sonication 29
1.1.1.2 Freeze Pressing 30
1.1.1.3 Agitation 31
1.1.1.4 Explosive Decompression 32
1.1.1.5 Non-mechanical Methods 3 2
1.1.2 Production-Scale Disruption 34
1.1.2.1 The Bead Mill 34
1.1.2.2 The High Pressure Homogeniser 38
1.1.2.3 Recent Advances 41
1.1.3 Conclusion 44
1.2 The High Pressure Homogenisation Process 45
1.2.1 Kinetics of Cell Disruption 45
1.2.1.1 Efifect of Microbial Characteristics 47
1.2.1.1.1 Strain Selection 48
1.2.1.1.2 Conditions of Growth 49 1.2.1.1.3 Storage Conditions 50 1.2.1.1.4 Cell Concentration 51
1.2.1.1.5 Product Location 52
1.2.1.2 Efifect of Operating Conditions 52 1.2.1.2.1 Pressure and Number of Passes 52
1.2.1.2.2 Temperature 53
1.2.1.2.3 Flow rate 54
1.2.1.3 Efifect of Valve Design 55
1.2.2 Disruption Mechanism 57
1.2.2.1 Hydrodynamic Models 58
1.2.2.2 Stress Analysis 58
1.2.2.3 Flow Through Restricted Orifices 61 1.2.2.3.1 Jet Impingement
1.2.3.2 Viscosity and Density 68 1.2.3.3 Yeast Debris Morphology: Microscopy Study 68
1.2.4 Conclusion 69
1.3 The Yeast Substrate 69
1.3.1 Yeast Cell Wall Structure and Composition 70
1.4 Simulation of Bioprocesses 71
1.4.1 Uses 72
1.4.2 Potential Benefits 73
1.4.3 Process Simulation 73
1.4.3.1 Steady-State and Dynamic Simulation 74 1.4.4 Downstream Processing Simulation 75 1.4.5 Modelling and Statistical Data Generation 76
1.4.5.1 Types of Models 77
1.4.5.2 Process Models 78
1.4.5.3 Data Generation 79
1.4.5.4 Fitting Equations to Biological Data 80
1.4.6 Conclusion 81
1.5 Aims of Work 82
2 Materials and Methods 83
2.1 Cell Culture Production 83
2.1.1 Packed Baker's Y east 84
2.1.2 Baker’s Yeast Fermentation 84
2.1.2.1 Growth Medium Used 85
2.1.2.2 Fermentation Equipment and Operation Conditions 87
2.1.2.3 Cell Culture Sampling 89
2.1.2.4 Dry Cell Weight Measurements 90 2.1.2.5 Optical Density (OD) Readings 90
2.2 Homogenisation Equipment and Operation Procedure 91
2.2.1 APV Gaulin Micron LAB40 93
2.2.2 APV Manton Gaulin Lab60 Homogeniser 96
2.2.3 APV Manton Gaulin Model K3 97
2.3 Analytical Techniques 98
2.3.1 Protein Assay 98
2.3.2 Enzyme Assay 99
2.3.4 Electrical Sensing Zone Measurement (ESZ) 101
2.3.5 Computational Analysis 102
2.4 Optical Microscopy 102
3 Modelling changes in homogenate particle size distributions occurring during high-pressure homogenisation of packed baker’s yeast 104
3.1 Summary 104
3.2 Introduction 104
3.3 Characterisation of Homogenate Particle Size Distributions 105 3.4 Modelling of Homogenate Particle Size Distributions 117
3.4.1 Debris Formation Process 117
3.5 Fitting Distribution Function to Describe Homogenate Particle Size
Distributions 121
3.5.1 Boltzmann Distribution Function 125
3.6 Fitting Rate Equations to Homogenate Particle Size Distributions 130 3.7 Model Verification Using Experimental Data 143
3.8 Conclusions 143
4 Scale-down: A Further Study of High-Pressure Homogenisers 147
4.1 Summary 147
4.2 Introduction 148
4.3 Scale-down: Using Laboratory-Scale High-Pressure Homogenisers 150 4.3.1 Characterisation of Valve Unit Geometry 155
4.3.1.1 Valve Gap Width 156
4.3.2 Fluid Flow Characterisation 160
4.3.2.1 Reynolds Number 160
4.3.2.2 Radial Velocity 162
4.3.2.3 Power Dissipation per Unit Volume 165
4.3.2.4 Mean Velocity Gradient 167
4.3.3 Experimental Results and Analysis 169
4.3.4 Conclusion 177
4.4 Scale-down: Minimising the Scale of Fermentation Required for Small-Scale
Cell Disruption Studies 177
4.4.1 Reducing Initial Cell Mass Required 177
4.4.2 Experimental Results 179
4.4.3 Discussion 187
4.4.4 Conclusions 191
4.5 Scale-down: Reducing High Pressure Homogenisation Processing Time 191 4.5.1 Experimental Results and Discussion 192
4.6 Theoretical Implications of Scale-Down Study 195
4.7 Conclusion 196
5 Modelling Interactions Between Fermentation and Cell Disruption 198
5.1 Summary 198
5.2 Introduction 199
5.3 Experimental Results and Analysis 200
5.3.1 Effect of Growth Rate on the High Pressure Homogenisation of
Baker’s Yeast. 203
5.3.2 Efifect of Growth Phase and Growth Media on the High Pressure
Homogenisation of Baker’s Yeast. 227
5.3.3 Efifect of Cell Storage on the Cell Disruption Characteristics of
Baker’s Yeast 242
5.4 Modelling Physically Measurable Fermentation Parameters to Predict High
Pressure Homogenisation Rate 251
5.4.1 Discussion of Results obtained in Section 5.3 251 5.4.2 Correlations of ko with Fermentation Conditions 253
5.4.3 Modelling ko and dso, n=o 25 8
5.4.4 Modelling Total Intracellular Protein Concentration Rcmax
and dso, n=o 263
5.5 Conclusion 267
6 Conclusion 268
7 Future Work 270
Papers Published 273
Table of Figures
Figure Title Page
1.1 Methods for cell disruption. 27
1.2 Details of Bead Mill Impellers 37
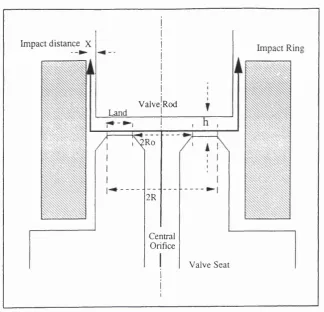
1.3 Schematic diagram of a typical valve seat 40
1.4 Schematic diagram of valve units (Keshavarz, 1990) 56 1.5 Effect of impact distance and valve geometry on soluble protein release
from bakers’ yeast at 46 MPa (Keshavarz, 1990) 66
2.1 Cell disruption (CD) valve. 92
2.2 Standard Lab 40 (SV) valve. 92
2 .3 Diagram showing parts of the Manton-Gaulin Micron Lab 40 homogeniser
in contact with the product. 95
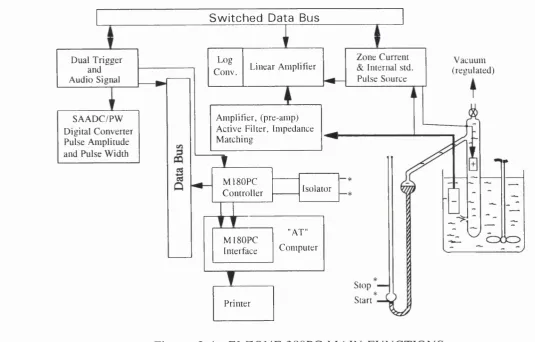
2.4 ELZONE 280PC main functions 103
3.1 Comparison between the ELZONE data and linearized ELZONE data.
(The data is for packed baker’s yeast homogenised at 500 barg) 108 3.2 Comparison between cumulative ELZONE PSD data and linearized
PSD data. (The data is for packed baker’s yeast homogenised at 500
barg) 108
3.3 Packed baker’s yeast homogenised at 500 barg operating pressure (P)
and varying number of passes (N). 112
3.4 Packed baker’s yeast homogenised at 300 barg operating pressure (P)
3.5 Homogenate cumulative PSD data obtained for packed baker’s yeast
homogenised at 100 barg. 114
3.6 Homogenate cumulative PSD data obtained for packed baker’s yeast
homogenised at 200 barg. 114
3.7 Homogenate cumulative PSD data obtained for packed baker’s yeast
homogenised at 300 barg. 115
3.8 Homogenate cumulative PSD data obtained for packed baker’s yeast
homogenised at 400 barg. 115
3.9 Homogenate cumulative PSD data obtained for packed baker’s yeast
homogenised at 500 barg. 116
3.10 Schematic view of the two principle mechanisms of particle
disintegration. 120
3.11 Typical bimodal distributions for these mechanisms. 120 3.12a Homogenate PSD obtained for packed baker’s yeast, homogenised
at 500 barg operating pressure, for passes zero and 5. The data is fitted with a bimodal Gaussian distribution function. 123 3.12b Homogenate PSD obtained for packed baker’s yeast, homogenisedat
500 barg operating pressure and for varying passes. The parameters for corresponding bimodal Gaussian distribution are plotted agaisnst number
of passes. 123
3.13 Homogenate PSD cumulative data obtained for packed baker’s yeast, homogenised at 100 barg. The Boltzman equation is fitted to the
experimental data. 127
3.14 Homogenate PSD cumulative data obtained for packed baker’s yeast, homogenised at 200 barg. The Boltzman equation is fitted to the
experimental data. 127
3.15 Homogenate PSD cumulative data obtained for packed baker’s yeast, homogenised at 300 barg. The Boltzmann equation is fitted to the
3.16 Homogenate PSD cumulative data obtained for packed baker’s yeast, homogenised at 400 barg. The Boltzman equation is fitted to the
experimental data. 128
3.17 Homogenate PSD cumulative data obtained for packed baker’s yeast, homogenised at 500 barg. The Boltzman equation is fitted to the
experimental data. 129
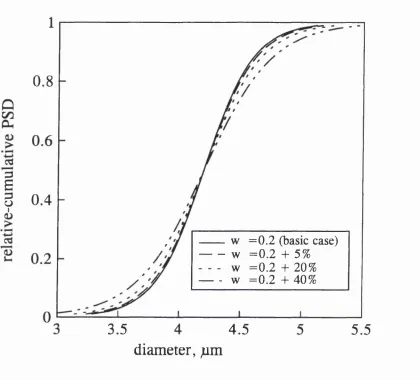
3.18 Sensitivity of parameter dso; w is fixed at 0.3 131 3.19 Sensitivity of parameter w;d s o is fixed at 4.2 132
3.20 Changes in dso with number of passes through the homogeniser at
varying operating pressures. 133
3.21 Relationship between logio [loge (^/5*o)/N] and logio ("^P). 137
3.22 Flow diagram of iteration process carried out to find exponent of N. 138 3.23 Parity plots to compare the experimental dso values with simulated
d s o values. 139
3.24 Relationship between t/joand w*. Linear regression models were
fitted to the data. 141
3.25 Parity plots of simulated w and experimental w. 142 3.26 Homogenate PSD cumulative PSD data obtained for packed baker’s
yeast homogenised at 100 barg. The simulated cumulative is also shown. Exponents of N and P are -0.4 and -1 respectively. 145 3.27 Homogenate PSD cumulative PSD data obtained for packed baker’s
yeast homogenised at 300 barg. The simulated cumulative is also shown. Exponents ofN and P are -0.4 and -1 respectively. 146 3.28 Homogenate PSD cumulative PSD data obtained for packed baker’s
4.2 Standard Lab 40 cell breakage valve, used only in the APV
Manton-Gaulin Micron Lab 40. 154
4.3a Changes in gap width, A, with increasing homogeniser operating pressure for various scales of high-pressure homogenisers. Laminar flow is assumed in the model Lab60 and Micron Lab 40, and turbulent flow is assumed in the
model K3. 159
4.3b Changes in gap width, h, with increasing homogeniser operating pressure for various scales of high-pressure homogenisers. Turbulent flow is assumed
in all three homogenisers. 159
4.4 Changes in radial velocity, u, with increasing homogeniser operating
pressure for various scales of high-pressure homogenisers. Laminar flow is assumed in the model Lab60 and Micron Lab 40, and turbulent flow is
assumed in the model K3. 164
4.5 Changes in radial velocity, w, with increasing homogeniser operating pressure for various scales of high-pressure homogenisers. Turbulent flow
is assumed in all three homogenisers. 164
4.6 Changes in power dissipation per unit volume, Pv, with increasing homogeniser operating pressure for various scales of high-pressure
homogenisers. Laminar flow is assumed in the model Lab60 and Micron Lab 40, and turbulent flow is assumed in the model K3. 166 4.7 Changes in power dissipation per unit volume, Pv, with increasing
homogeniser operating pressure for various scales of high-pressure
homogenisers. Turbulent flow is assumed in all three homogenisers. 166 4.8 Changes in mean velocity gradient, G, with increasing homogeniser
operating pressure for various scales of high-pressure homogenisers. Laminar flow is assumed in the model Lab60 and Micron Lab 40, and
turbulent flow is assumed in the model K3. 168
4.9 Changes in mean velocity gradient, G, with increasing homogeniser
4.10 Percentage soluble protein release (%R) with increasing number of passes (N) using various scales of homogenisers. 45% w/v packed
yeast cells was homogenised at 500 barg operating pressure. 170 4.11 Effect of varying the scale of high-pressure homogeniser on the resultant
homogenate PSD obtained at an operating pressure (P) of 300 barg and
third pass (N=3). 173
4.12 Effect of varying the scale of high-pressure homogeniser on the resultant homogenate PSD obtained at an operating pressure (P) of 300 barg and
fifth pass (N=5). 173
4 .13 Effect of varying the scale of high-pressure homogeniser on the resultant homogenate PSD obtained at an operating pressure (P) of 500 barg and
third pass (N=3). 174
4 .14 Effect of varying the scale of high-pressure homogeniser on the resultant homogenate PSD obtained at an operating pressure (P) of 500 barg and
fifth pass (N=5). 174
4.15 Homogenate cumulative PSD data obtained for packed baker’s yeast homogenised at 300 barg; the simulated cumulative PSD is also shown. The Manton-Gaulin Micron Lab 40 was the high-pressure
homogeniser used. 175
4.16 Homogenate cumulative PSD data obtained for packed baker’s
yeast homogenised at 500 barg; the simulated cumulative PSD is also shown. The Manton-Gaulin Micron Lab 40 was the high-pressure
homogeniser used. 175
4.17 Homogenate cumulative PSD data obtained for packed baker’s yeast homogenised at 300 barg; the simulated cumulative PSD is also shown. The Manton-Gaulin K3 was the high-pressure homogeniser
used. 176
shown. The Manton-Gaulin K3 was the high-pressure homogeniser
used. 176
4.19 Effect of initial packed baker’s yeast cell concentration (%w/v) on percentage protein release (%R) with increasing passes (N) through the APV Manton-Gaulin Micron Lab 40 high-pressure homogeniser at an
operating pressure (?) of 3 00 barg. 181
4.20 Effect of initial packed baker’s yeast cell concentration (%w/v) on percentage protein release (%R) with increasing passes (N) through the APV Manton-Gaulin Micron Lab 40 high-pressure homogeniser at an
operating pressure (P) of 500 barg. 182
4.21 Effect of initial packed baker’s yeast cell concentration (wet weight) on resultant homogenate PSD obtained at an operating pressure (P) of
100 barg and third pass (N=3) through the Micron Lab 40 high-pressure
homogeniser. 184
4.22 Effect of initial packed baker’s yeast cell concentration (wet weight) on resultant homogenate PSD obtained at an operating pressure (P) of
100 barg and fifth pass (N=5) through the Micron Lab 40 high-pressure
homogeniser. 184
4.23 Effect of initial packed baker’s yeast cell concentration (wet weight) on resultant homogenate PSD obtained at an operating pressure (P) of 300 barg and third pass (N=3) through the Micron Lab 40 high-pressure
homogeniser. 185
4.24 Effect of initial packed baker’s yeast cell concentration (wet weight) on resultant homogenate PSD obtained at an operating pressure (P) of 300 barg and fifth pass (N=5) through the Micron Lab 40 high-pressure
homogeniser. 185
4.25 Effect of initial packed baker’s yeast cell concentration (wet weight) on resultant homogenate PSD obtained at an operating pressure (P) of 500 barg and third pass (N=3) through the Micron Lab 40 high-pressure
4.26 Effect of initial packed baker’s yeast cell concentration (wet weight) on resultant homogenate PSD obtained at an operating pressure (?) of 500 barg and fifth pass (N=5) through the Micron Lab 40 high-pressure
homogeniser. 186
4.27 Changes in gap width, h, with increasing homogeniser operating
pressure. Values for 1% and 45% cell concentrations are shown. 189 4.28 Changes in power dissipation per unit volume (Pv) with increasing
homogeniser operating pressure. Values for 1% and 45% cell
concentrations are shown. 189
4.29 Changes in radial velocity (Mo) with increasing homogeniser operating
pressure. Values for 1% and 45% cell concentrations are shown. 190 4.30 Changes in mean velocity gradient (G) with increasing homogeniser
operating pressure. Values for 1% and 45% cell concentrations
are shown. 190
4.31 Protein release obtained using the Micron Lab 40 homogeniser at varying pressures. Protein release is for first pass through the homogeniser. 194 4.32 Fragmentation of yeast cell debris at high homogeniser operating
pressures. Homogenate PSDs were obtained after >95% protein had been released. Severe fragmentation of debris occurs at P=800 barg and
greater, and N=l. 195
5.1 Whole cells PSDs distributions for baker’s yeast grown using various dilution
rates. 205
5.2 Baker’s yeast grown at dilution rate 0.28h*‘ using defined medium. Baker’s yeast homogenised at 500 barg operating pressure (P) and
varying number of passes (N). 206
5.3 Parity plots to compare the experimental d^Q values with simulated values. Results for baker’s yeast grown at dilution rates of 0.28 h '\
5 .4 Parity plots to compare the experimental values with simulated i/so values. Results for baker’s yeast grown at dilution rates of 0.19 h '\
0.11 h'^ and 0.06 h'^ are shown. 209
5.5 Effect of number of passes (N) on the dimensionless dsQ of cell debris for baker’s yeast cultures grown at various dilution rates. Data shown is for cells homogenised at 300 barg and 500 barg homogeniser operating
pressure (P). 211
5.6 Effect of operating pressure on the dimensionless dsQ of cell debris for baker’s yeast cultures grown at various dilution rates. Data shown is for cells homogenised at various homogeniser operating pressure (P)
and 3 and 5 passes (N). 212
5.7 Relationship between dl^ and w*. Data are shown for homogenate PSDs obtained at various dilution rates. Linear regression model
(equation 3.16) was fitted to the data. 213
5.8 Homogenate cumulative PSD data obtained for baker’s yeast grown at a dilution rate of 0.28 h '\ Baker’s yeast was homogenised at 300 barg and 500 barg homogeniser operating pressure (P). The simulated
cumulative PSD is also shown. 214
5.9 Homogenate cumulative PSD data obtained for baker’s yeast grown at a dilution rate of 0.26 h '\ Baker’s yeast was homogenised at 300 barg and 500 barg homogeniser operating pressure (P). The simulated
cumulative PSD is also shown. 215
5.10 Homogenate cumulative PSD data obtained for baker’s yeast grown at a dilution rate of 0.21 h '\ Baker’s yeast was homogenised at 300 barg and 500 barg homogeniser operating pressure (P). The simulated
cumulative PSD is also shown. 216
5.11 Homogenate cumulative PSD data obtained for baker’s yeast grown at a dilution rate of 0.19 h'\ Baker’s yeast was homogenised at 300 barg and 500 barg homogeniser operating pressure (P). The simulated
5.12 Homogenate cumulative PSD data obtained for baker’s y east grown at a dilution rate of 0.11 h '\ Baker’s yeast was homogenised at 300 barg and 500 barg homogeniser operating pressure (P). The simulated
cumulative PSD is also shown. 218
5.13 Homogenate cumulative PSD data obtained for baker’s yeast grovm at a dilution rate of 0.06 h*\ Baker’s yeast was homogenised at 300 barg and 500 barg homogeniser operating pressure (P). The simulated
cumulative PSD is also shown. 219
5.14 Homogenate cumulative PSD data obtained for baker’s yeast grown at a dilution rate of 0.29 h '\ Baker’s yeast was homogenised at 300 barg and 500 barg homogeniser operating pressure (P). The simulated
cumulative PSD is also shown. 220
5.15 Percentage soluble protein release (%R) with increasing number of passes (N) for baker’s yeast grown at a dilution rate of 0.28 h'^ and homogenised at various operating pressures (P). Simulated protein release data are also shown based on Hetherington’s model (Hetherington et al,
1971). 221
5.16 Percentage soluble protein release (%R) with increasing number of passes (N) for baker’s yeast grown at a dilution rate of 0.19 h'^ and homogenised at various operating pressures (P). Simulated protein release data are also shown based on Hetherington’s model (Hetherington et al,
1971). 223
5.17 Percentage soluble protein release (%R) with increasing number of passes (N) for baker’s yeast grown at a dilution rate of 0.11 h'^ and homogenised at various operating pressures (P). Simulated protein release data are also shown based on Hetherington’s model (Hetherington et al,
1971). 224
(p) of 300 barg and various number of passes. Packed baker’s yeast data
is also shown. 228
5.19 Simulated protein release (%R) data for cell cultures grown at various dilution rates. Cell cultures were homogenised at an operating pressure (P) of 500 barg and various number of passes. Packed baker’s yeast data
is also shown. 226
5.20 Baker’s yeast whole cell PSDs at various growth phases. Cells grown on defined media and complex media are shown. 229 5.21 Parity plots to compare the experimental values with simulated
û?5o values. Results for baker’s yeast grown on defined medium and
harvested at exponential, stationary and late stationary growth phases
are shown. 232
5.22 Parity plots to compare the experimental values with simulated dso values. Results for baker’s yeast grown on complex medium and harvested at exponential, stationary and late stationary growth phases
are shown. 233
5.23 Homogenate cumulative PSD data obtained for baker’s yeast grown on defined medium and harvested at stationary phase. Baker’s yeast was homogenised at 300 barg and 500 barg homogeniser operating pressure (P). Simulated cumulative PSDs are also shown. 234 5.24 Homogenate cumulative PSD data obtained for baker’s yeast grown on
defined medium and harvested at late stationary phase. Baker’s yeast was homogenised at 300 barg and 500 barg homogeniser operating pressure (P). Simulated cumulative PSDs are also shown. 235 5.25 Homogenate cumulative PSD data obtained for baker’s yeast grown on
complex medium and harvested at stationary phase. Baker’s yeast was homogenised at 300 barg and 500 barg homogeniser operating pressure (P). Simulated cumulative PSDs are also shown. 236 5.26 Homogenate cumulative PSD data obtained for baker’s yeast grown on
homogenised at 300 barg and 500 barg homogeniser operating pressure (P). Simulated cumulative PSDs are also shown. 237 5.27 Simulated protein release (%R) data for cell cultures homogenised at an
operating pressure of 300 barg. Cell cultures were harvested at various growth phases and grown on either on defined medium or complex
medium. Packed baker’s yeast data are also shown. 240 5.28 Simulated protein release (%R) data for cell cultures homogenised at an
operating pressure of 500 barg. Cell cultures were harvested at various growth phases and grown on either on defined medium or complex
medium. Packed baker’s yeast data are also shown. 241 5.29 Baker’s yeast whole cells PSDs at various growth phases and storage
times. Cells harvested during stationary phase were stored for 6 hours and 30 hours. Harvested cells had been grown on defined media. 243 5.30 Parity plots to compare the experimental values with experimental
dsQ. Results are for baker’s yeast grown on defined medium and
harvested at stationary phase and then stored for 6 hours and 30 hours. 245 5.31 Homogenate cumulative PSD data obtained for baker’s yeast grown on
defined medium, harvested at stationary phase and then stored for 6 hours. Baker’s yeast was homogenised at 300 barg and 500 barg homogeniser operating pressure (P). Simulated cumulative PSDs are
also shown. 246
5.32 Homogenate cumulative PSD data obtained for baker’s yeast grown on defined medium, harvested at stationary phase and then stored for 30 hours. Baker’s yeast was homogenised at 300 barg and 500 barg homogeniser operating pressure (P). Simulated cumulative PSDs are
also shown. 247
5.34 Simulated protein release (%R) data for cell cultures homogenised at an operating pressure (P) of 500 barg. Cell cultures were harvested during stationary phase and then stored for 6 hours and 30 hours. Packed baker’s
yeast data are also shown. 250
5.35 kü as a function of dilution rate. 255
5.36 ko as a function of fermentation time. Growth phase is shown on each
data point. 256
5.37 Relationship between dso and ko (rate of disruption). Data for cell
cultures 1 to 15 are shown. 257
5.38 Relationship between normalised dso and ko (rate of disruption). Data for
cell cultures I to 15 are shown. 261
5.39 Parity plots of simulated kD (using equations 5.3 and 5.4) and original kD (using equation 5.1). 10% and 15% deviation from the original kD is
shown. 262
5.40 Relationship between total protein and dso. Data for cell cultures 1 to
15 are shown. 266
5.41 Relationship between normalised total protein and dso. Data for cell
Table of Tables
Figure Title Page
1.1 Factors Governing the Selection of Cell Disruption Method (based on
White, 1988). 29
1.2 Effects of Conditions of Growth on Pressure Component “a”
(modified from Keshavarz, 1990). 46
1.3 Susceptibility to Disruption of Various Microorganisms (Edebo, 1983) 48 1.4 Characteristics of APV Manton-Gaulin Homogenisers (Hetherington
et al, 1971). 54
2.1 Growth Medium Used for Batch, Continuous (Feichter et al., 1981). 86
2.2 Composition of the MYGP Medium. 87
2.3 ADH Assay Compunds 99
4.1 Characteristics of the APV Manton-Gaulin Homogenisers Used. 151 4.2 Characterisation of Valve Geometry Dimensions for the Three APV
Manton-Gaulin homogenisers; all dimensions shown are in mm. 155 4.3 Calculated valve gap entry and exit Reynolds number for APV
Manton-Gaulin homogenisers of different scales. 162
4.4 Fermentation volumes required to provide cell mass for cell disruption
studies using various scales of high-pressure homogenisers. 178 4.5 Changes in protein release model parameters with changes in initial cell
concentration. 180
5.4 PSD model parameters obtained for cells grown at various growth phases
and growth media. 230
5.5 Changes in protein release model parameters with changes in growth phase
and growth media. 239
5.6 PSD model parameters obtained for cells stored for 6 hours and 30 hours. 244 5.7 Changes in protein release model parameters for cell cultures stored for
1 Introduction
1.1 Methods of Cell Disruption
A wide range of important extracellular and intracellular biochemicals are produced by microorganisms. During the last few years, owing to the introduction of genetic engineering enabling the increased production of intracellular bioactive proteins and the development of biotechnology, the number of economically attractive intracellular products has increased significantly. DNA technology has resulted in the cloning of many heterologous proteins in bacteria and yeast such that microbial cells can now produce human interferon, insulin, bovine growth hormones, and many other biochemicals, including industrially significant enzymes. Many of these "new" biochemicals are intracellular and the extraction of these biochemicals demands the eflScient disruption of the cells without affecting the biological activity of the bioproduct. Whilst the separation of extracellular bioproducts fi*om microbial cells is relatively straightforward, the large scale extraction of intracellular bioproducts fi’om cells is a significant problem, requiring efficient and, preferably selective disruption techniques.
Cell disruption is an important unit operation used to break open microbial and animal cell wall structures in order to release intracellular bioproducts into fi"ee solution and so facilitate their recovery.
Based on the mechanism of disruption the methods for cell disruption can be divided into mechanical, physical and chemical ones (Edebo and Magnusson, 1973) or into mechanical and non-mechanical methods (Wimpenny, 1967).
The disruption methods commonly used in bioprocesses can be fiirther divided into two categories, namely;
1. Small scale methods used for preparation of biochemicals in small amounts, most commonly in laboratories.
2. Production scale methods used in pilot-plants and industrial scale production.
Figure 1.1 METHODS FOR CELL DISRUPTION
A) MECHANICAL METHODS Production scale
High pressure homogenisation High speed bead milling
Small scale
EQgh pressure homogenisation Sonication
Agitation (e.g. ball mill) Explosive decompression Freeze pressing
- Hughes Press - X Press Microduidiser
B) NON-MECHANICAL METHODS Production scale
Steam Injection
Small scale
Lysis
- Physical - Chemical
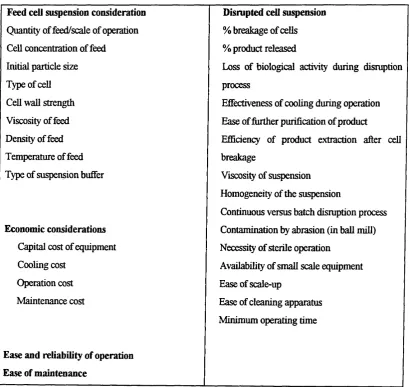
There are clearly a large number of possible ways in which microorganisms can be disrupted. In deciding which is the best method for breaking the cell wall of a specific microorganism the following requirements/factors, as shown in table 1.1, need to be considered.
Table 1.1; Factors Governing the Selection of Cell Disruption Method (based on White and Marcus, 1988).
Feed ceU suspension consideration Disrupted cell suspension Quantity of feed/scale of operation % breakage of cells Cell concentration of feed % product released
Initial particle size Loss of biological activity during disruption
Type of cell process
Cell wall strength Effectiveness of cooling during operation Viscosity of feed Ease of further purification of product
Density of feed Efficiency of product extraction after cell
Temperature of feed breakage
Type of suspension buffer Viscosity of suspension Homogeneity of the suspension
Continuous versus batch disruption process Economic considerations Contamination by abrasion (in ball mill)
Capital cost of equipment Necessity of sterile operation
Cooling cost Availability of small scale equipment
Operation cost Ease of scale-up
Maintenance cost
Ease and reliability of operation Ease of maintenance
The following sections review the various methods of cell disruption that are used for bioprocesses both at the small (laboratory) and production scale.
1.1.1 Small Scale Cell Disruption
As discussed earlier a wide variety of both mechanical and non-mechanical techniques for cell disruption are available. These techniques include chemical methods like alkali treatment and the use of detergents and solvents, and mechanical methods like sonication and freeze- pressing. The more commonly used methods are discussed in the subsections below, except for high pressure homogenisation which is detailed in section 1.1.2.2.
1.1.1.1 Sonication
Ultrasound energy is applied to a cell suspension to break open the cells. The equipment consists of an electronic oscillator and an amplifier whose a.c. output is changed into mechanical waves by a transducer which can be one of two types: a magneto-strictive device similar in principle to a loudspeaker, or a piezo electric transducer suitable for higher frequencies. The magneto-strictive transducer is most commonly used in the types of ultrasonic generator at present available for cell breakage. The transducer is coupled to the suspension being treated, by a metal probe. This is carefully designed so that it will resonate at the harmonic frequency of the electrical driving circuit.
streaming generates shearing forces which tear apart the suspended cells (Hughes et al, 1971; Wimpenny, 1967). It has been calculated that temperatures up to 40,000 K and pressures upto 3x10^ atm may occur in the micro-bubbles (Wimpenny, 1967).
However, sonication is an insufiBcient disruption method for filamentous organisms (Edebo, 1983), and the technique of ultrasonication is limited to small scale operation for several reasons, such as;
• DiflBculty in providing adequate cooling;
• InsufiBcient power transmission to large volumes of liquid (Scawen et a l, 1980); • Significant degradation of enzymes;
• Production of fine debris (Chisti et a l, 1986).
Ultrasonication, on the other hand, has advantages for quick, accurate determination of the level of intracellular products, e.g. for enzymatic assay of samples during fermentation kinetics studies.
1.1.1.2 Freeze Pressing
disruption of cells (Brookman, 1975; Magnussen and Edebo 1976a). Breakage in this system yields cell wall membrane preparations that are relatively intact, thus facilitating further purification processing of the product (Hunt et al, 1959).
The volume of suspension that can be treated in an X-press (Biox X-Press, LKB-Produkter 25 Bromma 1, Sweden) is limited to 25mL. Magnussen and Edebo (1976a) have reported the use of fi-eeze-pressing for large scale operations upto 10 kg of yeast cells per hour. This method allows 90% disruption in a single pass of Saccharomyces cerevisiae (270 mg/g). The main disadvantage for the method is protease degradation of the product which might arise during the stage following the freeze-pressing.
1.1.1.3 Agitation
Mechanical agitation may be used to produce intense shear forces which can cause cell disruption. Mechanical agitators are generally divided into two groups, rotational and vibration shear systems.
1. Rotational i.e. high speed blenders (e.g. Waring blender) in which the shear gradients produced at the blade edge are a product of the angular velocity of the blade and the radius of curvature of the blade. The shear forces produced may be insufiBcient to break many strains of bacteria (Wimpenny, 1967).
2. Vibrational i.e. shakers (e.g. Mickle shaker). The liquid cell suspension is mixed with glass ballotini before treatment. The mechanism of disruption appears to be one of disruption of the microorganism by virtue of the intense shear forces generated around the rapidly moving ballotini.
1.1.1.4 Explosive Decompression
In this method the cell suspension is allowed to stand for a time under external gas pressure. During this period a quantity of the gas dissolved in the liquid phase difiiises into the cells and eventually an equilibrium is reached. Provided the external pressure is sufficiently high, when it is released suddenly, the internal pressure in the cell can cause the cell wall and membranes to rupture (Fraser, 1951).
The main advantages of this technique are:
• No oxidation of product occurs since an inert gas is used; • Minimal overall temperature increase.
This method is, however, only applicable to fragile cells and is difficult to scale-up (Nissinen e ta l, 1986).
1.1.1.5 Non-mechanical Methods
1. Enzvmatic Ivsis: Enzymatic lysis is the most gentle way to release the product and keep the cell membrane intact (Hughes et al, 1971; Asenjo et a l, 1985). The enzyme attacks only specific bonds in the cell wall structure of microorganisms leaving the rest of the cell undamaged. Enzymic lysis can be used as an alternative method to mechanical breakage especially for materials that can be inactivated during the mechanical process (Fish and Lilley, 1984). Enzymatic lysis can also be used to weaken the cell wall prior to mechanical disruption in order to reduce the magnitude of the mechanical forces used to rupture the cell and to leave the intracellular constituents of the microorganisms intact ( Lin et al, 1991; Hunter and Asenjo, 1987 and 1989 ( see also section (1.1.2.3)).
requires time and eflfort. Commercially available lytic enzymic mixtures may also contain degradative enzymes that may damage the intracellular bioproduct of interest. The immobilisation of lytic enzymes on insoluble supports to extend their use has been investigated. Although highly desirable, this technique is limited due to steric hindrance of enzymic activity (Asenjo and DunnilL, 1981). Work carried out by Asenjo and Dunnill (1981) showed that increased viscosity of the cell suspension could greatly decrease the conversion rate and it was suggested that the use of a free enzyme would be a better approach.
2. Autolvsis: This is another method of enzyme lysis in which the lytic enzymes are produced by the organism itself. However, production of these enzymes is dfficult to control. Parameters which effect the autolytic process include temperature, time, pH, molarity of buffer, and the metabolic state of the cells (Hughes et al, 1971). Disadvantages of using this method are the requirements for a long incubation time (2-20 hours) and low disruption yields. Also, considerable protein dénaturation may occur (Dunnill and Lilley 1975; Edebo,
1969).
3. Chemical Ivsis: Generally, disruption of the cell wall by chemical treatment might inactivate most enzymes and other biochemicals. Chemical lysis involves treatment of the cell suspension with acids, alkalis, surfactant or solvents which can be expensive and result in contamination of the product with the chemical (Chisti et al, 1986).
Some successful methods, however, have been published, such as release of L-asperginase from Erwinia carotovora by exposure to a highly alkaline environment (Sargeant, 1973). Detergents have been used effectively in the extraction of inclusion bodies produced inside recombinant microorganisms (Marston, 1986).
4. Freezing and thawing: Disruption is caused by free water in the cells freezing and forming ice crystals that can mechanically tear inner membranes. The crystallisation of intracellular salts during this process also enhances disruption. This method gives very low yields even after a large number of passes and is not a realistic process scale operation.
within the cell causing disruption. This is a very gentle method, and is adequate for the disruption of very fragile organisms or for cells with walls that have been pre-treated with enzyme.
1.1.2 Production scale Disruption
Mechanical methods of cell disruption are generally preferred for large scale. The main methods used for production scale cell disruption are:
• The Bead Mill
• The High pressure homogeniser
1.1.2.1 The Bead Mill
The high speed agitator bead mill was originally designed for the comminution of pigments in the paint and lacquer industry and is an established unit operation in the chemical engineering sector. The use of high speed bead mills for cell disruption was first reported by Zetalaki (1969). The design of the bead mill varies, though in general mills consist of either a vertical or a horizontal grinding chamber containing glass or steel beads, acting as the grinding element, and rotating disc impellers mounted, concentrically or off-centred, on a motor driven shaft. The units generate a significant amount of heat, and thus must be equipped with high capacity cooling systems for processing temperature sensitive materials. This requirement may restrict the size of the mill, but units from 0.1 to 20 litres are available.
screen at the feed end to retain the beads inside the chamber, this is not the case in the horizontal mill. The bead mill can be operated in batch or continuous mode.
Kinetics of batch disruption
Kinetics of batch disruption of yeast cells have been reported to be first order with respect to the period of treatment, with the rate constant being a function of glass bead diameter, weight of beads used in the mill, agitator speed and design, cell concentration and temperature (Currie et al, 1972; Limon-Lason et al, 1979). The rate of disruption as measured by the rate of soluble protein release has been shown to be directly proportional to the amount of unreleased protein, see equation 1.1:
log. R r R m a x ” R
= k p . t (1.1)
where R = weight of protein released per unit weight of packed yeast; Rmax = maximum protein release; kp = first order rate constant; t = disruption time
Limon-Lason et al (1979) found that in larger mills and at higher impeller tip speeds (above 10 m/s) disruption did not follow first order kinetics as given by equation 1.1. However, diflBculties with temperature control in batch experiments led to rather inconclusive results and the limitations of the equation are not clear.
Limon-Lason et al (1979) also showed that for continuous disruption in a 5 L bead mill, the flow patterns were such that it could be considered as a series of continuous stirred tank reactors where each impeller was at the centre of a reactor. At a 0.6 L scale, however, there was considerable back-mixing between the reactors which had to be accounted for in a modified model.
R r
R r R
1 + ^ J
(1.2)
where x = mean residence time in the mill (=V/Q where V is the total volume of the mill and Q is the total throughput); j = the number of CSTRs in series (including fractions of CSTRs); kp, Rmax, and Rare as defined above in equation 1.1.
To incorporate back-flow between the CSTRs, x, mean residence time is written as: y
Q r =
1 + 2b
(1.3)
where, b/Q is the ratio of back-flow between the CSTRs to the overall flow rate (Q).
The effects of cell concentration reported in the literature are somewhat inconsistent though an optimal cell concentration for disruption of 40-50% cells (wet weight) has been reported (Kula, 1987). Further factors that affect milling are listed below:
Bead loading The volume fraction of the grinding chamber filled with glass beads afreets both the disruption achieved and the power requirements of the milling process. Increased bead loading increases cell disruption significantly, but loading of more than 88% is not suitable (Currie et al, 1972; Rehacek and Schaefer, 1977). Increased bead loading also necessitates more cooling.
Temperature The operating temperature should be maintained at 5 °C, to allow for minimum inactivation of the product. It has been reported that the rate constant is insensitive to the temperature of operation between the range 5 to 40 °C.
Agitator Speed Increasing the agitator speed generally increases the disruption rate constant (Currie et al, 1972, Marflfy and Kula, 1974). However, at higher tip speeds the rate of increase in disruption levels ofif. The main disadvantage of using very high tip speeds is the increased temperature rise and power consumption that accompanies such a change.
Agitator Design Limon-Lason et al (1979) found that in a 5L mill the dismption rate constant was always higher for polyurethane impellers, than for the stainless steel type, see figure 1.2. However, maximum protein release was always higher for the stainless steel impellers. This observation was explained by studying the mixing patterns caused by the impellers.
The polyurethane impeller because of its more "open" design creates a greater degree of mixing at any given distance from the impeller. The more "closed" stainless steel impeller design allows very high shear rates near the impeller, though its mixing properties are not as efficient.
1.1.2.2 The High Pressure Homogeniser
The high pressure homogeniser is a widely used method for large-scale disruption of microorganisms. It consists of two vital parts: a high pressure positive displacement pump and one (or more) adjustable restricted orifice discharge homogeniser valve(s). The number of pistons in the high pressure pump and other design parameters, such as homogeniser capacity and pressure ranges, depend on the size of the homogeniser. Small scale machines are usually fitted with one or two pistons only, while production machines have three to five pistons in a high pressure pump unit. Although there are several commercial models available, the principle of operation is the same, and the models differ only in their capacity, type of valve, pressure range and number of pistons.
08e R r R m a x “ R
= K . N = k . N . (1.4)
Where, R m a x = maximum protein available for release; R = protein release for a number of discrete passes N through the valve; N = number of passes; P = operating pressure; a = pressure exponent, a function of cell type (a=2.9 for baker’s yeast Saccharomyces cerevisiae); kp = rate constant, a function of temperature and possibly cell concentration; K = dimensionless constant, mainly dependent on the pressure drop P across the valve seat
Figure 1.3 Schematic Diagram o f a Typical Valve Seat
Impact distance X
ValvctRod Land
Ro
2R
Central Orifice
Impact Ring
Valve Seat
1.1.2.3 Recent Advances
New and revised methods of cell disruption that have been of recent interest include;
• The Microfluidiser • Critical Fluid Disruption • Rotor driven bead mills
(N.B. The first two methods stated above have also been studied using enzymic pre-treatment of the cell suspension)
The Microfluidiser
Small scale (lOml-6-12 1/hr) and production scale (20 - 11,000 L/h) models have been designed. The scale-up fi*om laboratory to pilot and production scale is linear. Advantages of using this new type of high pressure homogeniser are that it claims:
• no aerosol generation • aseptic operation facility • is steam sterilisable
• blocked disruption chamber can be cleaned by reverse flow
• small scale Microfluidisers can be immersed into an ice-bath to facilitate immediate cooling; a cooling coil can also be jacketed around the Microfluidiser.
As with the APV Manton-Gaulin type homogeniser the extent of disruption depends upon the operating pressure and number of passes used. Operating pressures can be up to 158 MPa.
was found to vary between 0.28-0.94, depending upon the specific growth rate of the cells in continuous culture, type and concentration of cells.
log, R r R m a x " ^
(1.5)
For cells grown in continuous culture, recombinant strains were disrupted more readily than their native one. Cells grown in batch culture showed no significant difference between the disruption kinetics of the recombinant and native strains.
Baldwin and Robinson (1990) found that for baker’s yeast the Microfluidiser disrupted less than 40% of the cells after 5 passes. Their studies reported that enzymatic lysis combined with the Microfluidiser significantly enhanced the ability of the Microfluidiser model MllOT with approximately 100% disruption being obtained after four passes at a pressure of 95 MPa. The experimental results obtained by Baldwin and Robinson (1990) were described by modification of the Hetherington’s model to the form:
Ogc R m a x " R x R m a x - R
= k p . N \ P* (1.6)
Where R% = cells disrupted by enzymatic treatment alone; R = total cells disrupted after both enzymatic and homogenisation; kp is the rate constant; a and b are the exponents of pressure and number of passes, respectively, "a" was found to be 3.03, and "b" 1.3 for baker’s yeast.
Critical Fluid Disruption (CFD)
The method of critical fluid disruption (CFD) uses super critical fluids (SCF). Such fluids possess a combination of "gas-like" and "liquid-like" properties. The SCF penetrates like a gas and functions like a liquid. SCF have been used in the bioindustry particularly in the area of extraction and separation. The critical fluid disruption equipment consists of two major components; a piston injector and a pressure vessel. The process involves a sudden release of applied fluid pressure that allows penetration of the critical fluid into the cell body. The inflated microbial cells are than rapidly decompressed, where upon they rupture at their weakest points. Carbon dioxide and nitrogen are the typical super critical fluids used.
Lin et al (1991) extended the use of SCF, combined with pre-treatment of the suspension with a lytic enzyme, to the disruption of yeast. They used carbon dioxide as a primary SCF because it is nontoxic, nonflammable, inexpensive and physiologically safe. The critical temperature for carbon dioxide is just above ambient (i.e. critical temperature is 31.1 °C), which minimises the problems of thermal degradation (or dénaturation) of delicate biological materials. In addition its phase behaviour and other thermo-physical properties that are needed for process analysis are well studied. Volumes handled by these workers were approximately 50mL. Without enzyme pre-treatment, only 30% of the available protein was released. Pre-treatment with lytic enzymes enhanced significantly the disruption process.
The main advantages of this method are that there is insignificant cooling requirement, it is a gentle technique and it is scalable. However, there is little known in engineering terms about the use of this method in bioprocessing, and more research is required.
Rotor Driven Bead Mills
Gaver and Huyghebaert (1990) used the CoBall-Mill, another new type of rotational bead mill. The disruption chamber of this mill is composed of a conical rotor fitting into a conical stator. The cell suspension is pumped continuously through the narrow gap, between the rotor and the stator, that is partially filled with disruption beads. The volume of the disruption chamber is only 25% of the disruption volume requirement of the conventional bead mill with the same throughput. The CoBall Mill also has a very eflScient cooling system.
1.1.3 Conclusion
Studies of disruption methods have generally been concerned with testing specific types of equipment and defining the effects of different operating variables on the disruption of microbial cell walls. Additionally, in several of the studies, denaturing effects of the disruption process and the release of key enzymes relative to total protein have been investigated.
1.2 The High Pressure Homogenisation Process
The unit operation of high pressure homogenisation is a commonly used cell disruption method in the bioprocess industry. The process of high pressure homogenisation will be studied in detail in this section with respect to parameters effecting homogenisation kinetics and the mechanism of high pressure homogenisation. Section 1.2.1 presents parameters that affect the kinetics of high pressure homogenisation process and section 1.2.2 gives a summary of the mechanisms attributed to the disruption process in the high pressure homogeniser.
1.2.1 Kinetics of Cell Disruption
Hetherington et a l (1971) reported that protein release kinetics was a first order process with respect to the number of passes through the homogenising valve. The first order equation they presented is given in equation 1.7 below.
ogc
R r R m a x - R
= K . N = k, . N . P ' (1.7)
Where, Rmax = maximum protein available for release; R = protein release for a number of discrete passes N through the valve; N = no of passes; P= operating pressure;; kp = rate constant, a function of temperature and possibly cell concentration; K = dimensionless constant, mainly dependent on the pressure drop P across the valve seat, a = pressure exponent, a function of cell type which was found to be 2.9 for packed baker’s yeast Saccharomyces cerevisiae.
M icroorganism Type of F erm entation Type of Medium ex p o n e n t R eference
Bakers' y e a s t com m ercial dried b a k e r's
y e a s t
Complex medium
2.9 H etherinoton e^ al. 1971
1 . 7 2 - 1 .7 9 D o u l a h fit al. 1 9 7 5
2 .9 Dunnill at a! 1 9 7 5
S p e n t B rew ers' y e a s t from brew ery Complex medium 1 .2 -1 .3
1 .8 7
W hitw o rth 1 9 7 4 Engler 1 9 7 9
Saccharom
yces-cerevisiae
aerobic, c o n tin u o u s culture
-I
specific g ro w th rate 0.1 h
defined medium 0 . 8 6 Engler 1 9 7 9
Candida utiUs
cyclic b atch ^
max. g ro w th rate 0 . 5 h defined medium 1.17 Engler e t al. 1 9 8 1 a , b
c o n tin u o u s culture specific
q ro w th rate 0.1 h'^ 1.7 7 Engler e t al. 1981
Bacillus brevis b atch
late lag p h ase , th e n frozen a t -2 0 ° C
Complex medium 1.8 A ug e n ste in e t al. 1 9 7 4
Bacillus subtilis c o n tin u o u s culture specific
g ro w th rate 0 . 2 h
Complex medium 1 .0 7 Engler et al 1 9 8 1 a
Alcaligenes eutrophus
fed-batch
_________exponential^h^e___________
late exponential phase early stationary phase late stationary phase
defined medium
3.08 2.80 1.69 1.59
Harrison et al. 1990
Also as part of their study on the homogenisation process, Hetherington et al. (1971) concluded that the key parameters that affect the homogenisation process are:
1 microorganism characteristics 2. operating pressure
3. process temperature 4. initial cell concentration
5. homogeniser capacity (flowrate) 6. valve design
Several researchers have since provided further evidence that the parameters listed above affect the efficiency of the homogenisation process. This research into the effect of these key parameters on the homogenisation process is detailed below: Section 1.2.1.1 describes the effect of microbial characteristics; section 1.2.1.2 discusses the effect of operating conditions and; section 1.2.1.3 discusses the effect of valve design.
1.2.1.1 Effect of Microbial Characteristics
Microbial characteristics that affect the homogenisation process are related to one or more of the following factors:
a) Choice of microorganism strain, i.e. strain selection (see section 12.1.1.1) b) Conditions of cell growth (see section 1.2.1.1.2)
c) Conditions of cell storage (see section 1 2.1.1 3) d) Initial cell concentration (see section 1.2.1.1.4)
1.2.1.1.1 Strain Selection
A limited number of microbial strains have been used in the study of high pressure homogenisation. Most of the early work was carried out using packed baker’s yeast, for which there is no record of the strains used. A study of susceptibility of various kinds of cell suspensions (microorganisms) to disruption was carried out by Edebo (1983), however, he did not include high pressure homogenisation in his study. Nevertheless, the results obtained by Edebo clearly show that certain microorganisms are easier to disrupt than others. For example, his results (see table 1.3) show that yeast is more resistant to disruption than gram +ve bacilli. The numbers in table 1.3 show the ranking within the group. A high number indicates that the cells are sensitive. Parentheses indicate the number is very uncertain. The results obtained by Edebo are rather simplistic since they do not account for the effects of growth conditions that each microorganism is subjected to. Growth conditions can be altered such that the microorganism becomes either more or less susceptible to disruption. This factor is discussed further in the following section
1.2.1.1.2.
Recombinant microorganisms have also been shown to be easier to disrupt than the native microorgianism. Sauer et al. (1989) showed that recombinant E. coli are more susceptible to high pressure cell disruption using a Microfluidiser than native E. coli cells (see section 1.1.2.3).
Table 1.3: Susceptibility to disruption of various microorganisms (Edebo, 1983) Microorganism Liquid
Pressing
Freeze
Pressing
Agitation Sonication
Animal cell 7 7 7 7
Gram -ve bacilli and 6 6 5 6
cocci
Gram +ve bacilli 5 4 (4) 5
Gram +ve cocci 3 2.5 (2) 3.5
Yeast 4 2.5 3 3.5
Spores 2 1 (1) 2
Mycelium (1)* 5 6 1
1.2.1.1.2 Conditions of Growth
The conditions of cell growth that have been shown to affect the susceptibility of cells to disruption are: growth rate, growth phase (time of harvesting), growth media, and whether the cells were grown aerobically or anaerobically. Published research work carried out on the effect of these growth conditions is reported in the next few paragraphs.
Work carried out by Engler and Robinson (1981a) using C. utilis, showed that cells grown at a higher specific growth rate (in a cyclic batch culture) were easier to disrupt than the cells grown at a lower specific growth rate (continuous culture). They reported that this was so because cell wall strength is related to the specific growth rate of the cells. They also reported that C utilis grown under identical conditions (aerobically in continuous culture) was more difficult to disrupt than S. cerevisiae. However, disruption characteristics of B. subtilis and S. cerevisiae grown in continuous culture and C. utils grown in batch culture were all similar. Though the study carried out by Engler and Robinson (1981a) illustrated that specific growth rate affected the disruption kinetics of the microorganisms, additional effects of other growth conditions such as the medium composition and aeration rate were not controlled and hence the results are not as conclusive as they appear.
medium. White and Marcus, 1988 also reported that cells encouraged to grow larger tended to be weaker.
Further research is needed to model the effect of growth conditions on the cell wall strength for individual microorganisms.
1.2.1.1.3 Storage Conditions - Commercial Baker’s Yeast
There is no published literature on the effect of storage conditions on the homogenisation process. This area of study is important since the process, though designed to run with out any process bottlenecks, may experience a bottleneck in the future due to unforeseen equipment or operational failure. The plant operators would, therefore, need to know how long the fermentation broth can be stored before cell composition has significant effects on the normal running of the subsequent downstream processing train. In this section the effect of storage conditions on dried commercial baker’s yeast will be discussed.
Dried commercial baker’s yeast has been used in most of the research regarding cell disruption. It has in the past been assumed that the resuspended dried baker’s yeast simulates a "typical" yeast fermentation broth. Dried baker’s yeast has traditionally been used as it is cheap and readily available, easy to transport and to handle. A disadvantage of using commercial baker’s yeast, for downstream process research, is that the manufacturers do not supply information on how the yeast was produced (e.g. batch, fed-batch) and/or which strain(s) of yeast are used. These features make it difficult to relate disruption data back to growth conditions or strain selection techniques.
It is important to realise that the cell characteristics (e.g. cell wall strength, cell shape) will be altered once the yeast is dried and again change when it is resuspended. For studies observing changes in particle size distribution during homogenisation it is important that the initial cell suspension is well characterised.
a weakening of the nuclear membrane rigidity. Rehydrated cells demonstrated elongation after drying. Restoration of the cells’ initial form and size appeared only gradually during reactivation. It was also concluded by Beker and Rapoport (1986) that certain glucane components of the yeast cell walls were changed during drying and rehydration. Electron microscopy investigations of the rehydration process showed that slow and gradual rehydration of dried cells from the stationary growth phase in water vapour diminished membrane damage as compared to rapid moistening, by simple immersion of the dried yeast in liquid medium (The latter method is typically adapted in homogenisation studies). Also, the viability of the rehydrated populations increases. In dehydrated cells obtained during the exponential growth phase, with almost 100% budding, it is impossible to diminish membrane damage during rehydration. The cell inactivation due to dehydration differs from that seen when the cells are in anabiosis ("dormant" metabolic state) where inactivation is by plasmolysis. Inactivation by rehydration is primarily due to autolysis of the structural components. When cells are dehydrated, large vacuoles diminish drastically in size and/or become partly fragmented. Since the regulation of osmotic pressure in cells is one of the functions of the vacuole system the diminishing of such large vacuoles causes a flattening of cells during drying. As a consequence morphology of the yeast cell after dehydration depends upon the drying process used and this will therefore have a significant effect on the homogenisation process.
Studies of the changes in various enzyme activities in dried yeast cells have established that they may greatly depend upon growth conditions and drying methods. The total losses of cell components may amount to 20-30% of dry weight.
1.2.1.1.4 Cell Concentration
The cell disruption rate for baker’s yeast has been reported by Brookman (1975) to be independent of cell concentration between the range 28-224 g dry cell weight/L. Hetherington et a l (1971) reported that concentration was independent between the range of 30%-60% g wet cell weight/L.
1.2.1.1.5 Production Location
Follows et a l (1971) showed that the rate of release of any specific enzyme varies as a function of its location within the cell. Enzymes located in the sub-cellular organelles, such as fumarase, which is present in the mitochondria, were released more slowly than the overall protein release. Enzymes located in the cytoplasm were found to be released at the same rate as the total soluble protein was released. Acid phosphatase, located on the cell membrane, was released faster than the overall protein release.
1.2.1.2 Effect of Operating Conditions
The high pressure homogeniser operating conditions that have an effect on homogenisation kinetics are:
• operating pressure and number of passes • process temperature and
• process fluid flowrate (throughput)
1.2.1.2.1 Pressure and Number of Passes