1
A Study of the Spectroscopic Performance of Laser Produced CdTe Plasma
Kadhim A. Aadim, Ghaith H. Jihad
Department of Physics, College of Science, University of Baghdad, Iraq
e-mail: [email protected]
e-mail : [email protected] Abstract
In this work, the parameters of plasma (electron temperature (Te), electron density ne,
plasma frequency (fp) , Debye length (λD) and Debye number (ND)) have been studied by
using the spectrometer that collect the spectrum of Laser produce Cadmium telluride
plasma at different energies. The results of electron temperature for CdTe range
0.93-1.18 eV also the electron density 5 ×10¹⁰ – 3.8 ×1011 cm-3 have been measured under
vacuum reaching 2.5 ×10⁻² mbar .Optical properties of CdTe were determined through
the optical transmission method using ultraviolet visible spectrophotometer within the
range 190 – 1100 nm.
Key words
Laser Induced Plasma Spectroscopic (LIPS), Optical Emission Spectroscopic (OES), Spectroscopy diagnostic, Cadmium telluride (CdTe).
1-Introduction
Laser-produced plasmas from interactions with solid targets are a promising subject for
much fundamental and applied research. The characteristics of these plasmas depend
upon many parameters characterizing the features of the target: properties of the ambient
medium, laser wavelength, pulse duration etc.[1]. The ablation process using long pulse
duration lasers (> 1 ns) is divided into three stages. In the first stage, the laser light
interacts with the solid resulting in rapid ionization of the target surface into plasma on a
time scale short compared with the pulse duration. In the second stage, the laser light is
efficiently absorbed by the plasma which expands isothermally. In the third stage, after
the end of the laser pulse, the resultant plasma plume expands quasi-adiabatically in a
medium, which can include vacuum or a background gas, with or without applied
fields[2], Sample types can be wide ranging because optical absorption processes initiate
2
LIBS sampling, thus, allowing analysis of solids, liquids, and gases[3]. Once the energy
from the laser pulse heats, ablates, atomizes, and ionizes the sample material, a plasma is
formed.
CdTe is a prototypical material in the zinc blende II–VI semiconductor family. It is
widely used in various devices including γ - and x-ray spectrometers, solar cells,
optoelectronic and optoacoustic modulators, and infrared windows [4]. Experimental
measurements of the bulk band structure of CdTe have been reported in previous studies
[5], but only for the (100) and (110) surfaces. High-resolution band mapping of
CdTe(111) is thus far lacking for this important technological face.
The light of the plasma is then spectrally resolved and detected by a spectrograph and a
detector. Both quantitative and qualitative information, such as elemental composition,
can be deduced from the resulting plasma spectrum. Emission line properties such as
widths, shapes, and shifts can provide information on plasma temperature and electron
density[6], Plasma temperature is an important thermodynamic property due to its ability
to describe and predict other plasma characteristics such as the relative populations of
energy levels and the speed distribution of particles. The method used in this laboratory
experiment is the ratio method using two lines of Hydrogen, which assumes that local
thermodynamic equilibrium (LTE) is met within the plasma. Under Vacuum with
pressure tell to 2.5 ×10⁻² mbar, it has been shown through approximations that LTE is
usually met after a couple hundred nanoseconds after plasma formation using LIBS with
irradiances greater than 108 W/cm2. The ratio method is a common way of reporting
plasma temperature can be calculated through the intensity ratio of a pair of spectral lines
of atom or ion of same ionization stage [7]. In LTE, The plasma temperature is calculated
from the equation[7]:
= ( ) ………..….. (1)
Electron density (ne) describes the number of free electrons per unit volume. There are
several credible techniques used to determine electron density, including plasma
spectroscopy, microwave and laser inter ferometry, and Thomson scattering. The
determination of electron density by linear Stark broadening of spectral lines, as used in
this lab, is a well established technique. Line broadening in LIBS plasmas is caused
primarily by Doppler width and the Stark effect. Doppler width is dependent only on the
3
disregarded in this experiment as the Doppler width of the hydrogen line used is usually
between 0.04 nm and 0.07 nm. The Stark effect is considered a type of pressure
broadening that involves interactions of radiators and neighboring particles. In plasmas,
these interactions are caused by collisions of ions and to lesser extent electrons. The Stark
effect is mainly responsible for the line broadening of the hydrogen line used in this
experiment.[6,8]
Saha-Boltzmann equation utilizes spectral lines of the same element and successive
ionization stages. the Saha- Boltzmann equation is given as[7]:
= ∗6.04 × 10 ( ) /
( )
( ) ………....……(2)
where
∗= ………...(3)
is the ionization energy of the species in ionization stage z in eV, Tz is the line
intensity for transition from upper level-2 to lower level-1, is the corresponding
wavelength of transition from level-2 to level-1, is the statistical weight of transition
from level-2, is the transition probability from level-2 to level-1 and Te is the electron
temperature The subscript z denotes the ionization stage of the species for the referred.
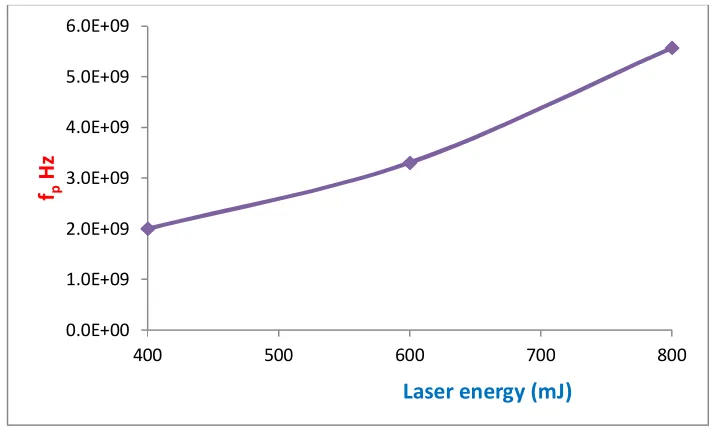
While the plasma frequency is calculate from the equation [9]:
fp≈8.98 ne (Hz) ... (4)
This frequency, depending only on the plasma density, is one of the fundamental
parameters of plasma. Because of the smallness of m, the plasma frequency is usually
very high.[9]
The response of charged particles to reduce the effect of local electric fields is called
Debye shielding and the shielding gives the plasma its quasi-neutrality characteristic. a
distance λD, called the Debye length and defined as [10]:
λD=
2 / 1
2
e n
kT
e e o
4
where :- λD : is the Debye length (cm) ,L: is the system dimension(cm) ,ne : is the density
of the electron
3m ,Te: is the electron Temperature
K , e : is the electron charge (C)and ND also known as the number of particles in the Debye sphere which is dependent on
electron density and electron temperature this Second condition for plasma existence ND
>>>1 as follows[12]:
ND = 3
3 4
D e
n
………..………….. (6)
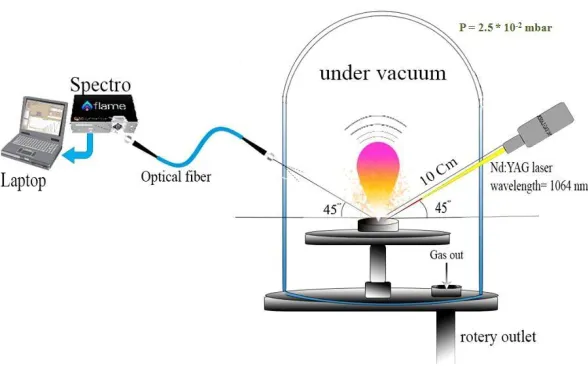
2-Experimental Setup
The diameter of laser spot can be changed by changing the distance between the
laser lens and the target. Pulse duration (9 ns) with 6 Hz repetition rate frequency. The
exactly distance during the measurements for system accuracy and precision. In this work
a lens of 10 cm focal length has been used. A shorter focal length lens can produce a
small beam waist, and therefore, stronger breakdown, but it also has a smaller depth of
focus, Figure 1 shows a schematic diagram for the LIBS setup (1).
5
The spectrometer analysis was done using the light emitted from sample bombarded by
the pulse laser. The spectrometer with short response time from Ocean Optics (HR 4000
CG-UV-NIR) was used in the setup to analyze emitted light.
The light produced by the ablated plasma was collected by the optical fiber which was set
at angle of about 45 degree to axes of the laser beam to avoid splashing and then guided
to the entrance slit of the spectrometer. The spectrometer has a high resolution depending
on grating used in it, and responds to a wavelength between 200-900 nm with 3648
pixels. Nd: YAG laser at 1064 nm is tightly focused on the target to produce plasma
plume.
In order to insure exposing a fresh surface after every train of shots the target surface was
rotated manually. The spectrum of plasma with different value of energies varied from
500 mJ to 1000 mJ collect the Spectra of Pb, each spectrum was obtained over a 300-800
nm wavelength range.
Finally the results were analyzed and compared with National Institute of Standards and
Technology data (NIST) [13]and evaluate the plasma parameters.
3-Results and Discussion
Figure (2) show the emission spectra of laser induced CdTe target plasma which
confined in Vacuum in the spectral range (300-800) nm with different pulsed laser energy
E=(400,600,800) mJ
The optical emission spectra of Pb target plasma which confined in vacuum were
6 Figure 2: Emission spectra of laser induced CdTe target in Vacuum with different laser energies
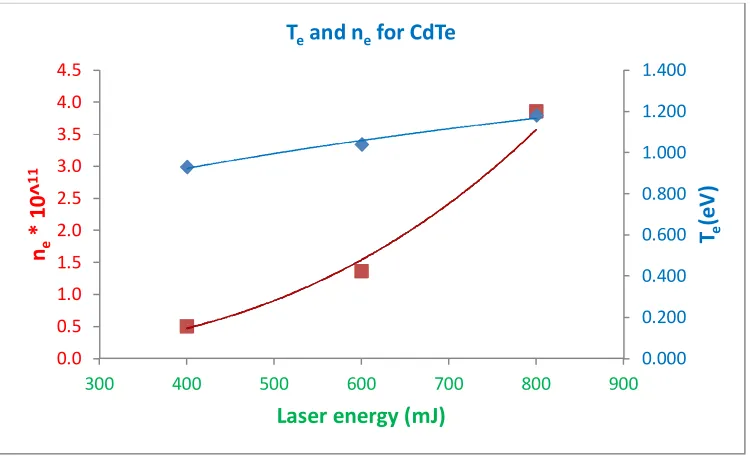
Tables (1) display the calculated electron density (ne), electron temperature (Te), plasma
frequency (fp ), Debye length (λD),) and Debye number (ND) for CdTe target at different
laser pulse energies. All calculated plasma parameters (λD, fp and ND) were satisfied the
criteria for the plasma. It shows that fp decrease with laser energy because it is
propor-tional with ne, while λD and Nd increasing.
Table 1: plasma parameters for Pb in Vacuum with different laser energy
Laser energy (mJ) Te (eV) ne (cm-3) fp (Hz) λ
D (cm) Nd
800 1.180 3.85E+11 5.6E+09 1.2E-01 2.8E+09 600 1.039 1.36E+11 3.3E+09 1.9E-01 4.0E+09 400 0.930 4.96E+10 2.0E+09 3.0E-01 5.5E+09
The variation of (Te) and (ne) was determining the Ratio Method using two lines of CdTe
(CdTe(111) in this part) .is shown in Figures (4) for different laser energies. Cd I
Cd I
Te II
Te II
Cd I
Cd I
Cd I
Cd I
Te II
0 500 1000 1500 2000 2500 3000 3500 4000 4500
300 400 500 600 700 800
In
te
n
si
ty
λ ( nm)
Spectrum for CdTe at λ = 1064 nm
E =800 mJ
E =600 mJ
7
Figure 4: The variation of (Te) and (ne) versus the laser energy for CdTe in Vacuum
The higher calculated values of electron temperature Te (Eq.1) in the vacuum is attributed
to the high kinetic energy of free electrons in the plasma comparing with more collisions
present in other media caused energy transfer to species by numerous ways and presence
of secondary charged particles. It can be seen that the electron temperatures shows in
fig.5, a slow linear increase as the laser peak energy increased; which is due to the
absorption of laser photon by the plasma, and at the same time the plasma is relatively
transparent to the laser beam.
Figure 5: electron temperatures for CdTe in Vacuum different laser energies
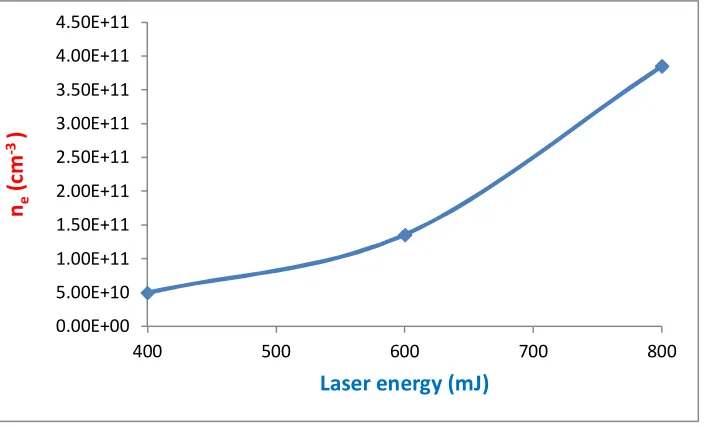
Electron density is an important parameter that is used to describe a plasma environment
and is also crucial for establishing thermodynamic equilibrium. The electron density (ne)
0.000 0.200 0.400 0.600 0.800 1.000 1.200 1.400 0.0 0.5 1.0 1.5 2.0 2.5 3.0 3.5 4.0 4.5
300 400 500 600 700 800 900
Te (e V ) ne * 1 0 ^ 1 1
Laser energy (mJ) Teand nefor CdTe
0.000 0.200 0.400 0.600 0.800 1.000 1.200 1.400
400 500 600 700 800
T
e
(e
V
)
8
in the plasma can be measured from the emission coefficient and intensity of spectral
lines using the Saha- Boltzmann equation.
Figure (6) show electron densities of laser induced plasma for CdTe component target in
the vacuum, at different laser peak energies, respectively. It can be seen that the electron
density varies directly with varying laser peak energy. It can be noticed at a given laser
energy that the value of electron density vacuum is proportional with laser energy. This
results agree with (M. HANIF and et-al)[4].
Figure 6: electron densities for CdTe in vacuum different laser energies
Figure (7) show plasma frequency in Vacuum laser induced plasma for CdTe Component
target. Form the figure it is seen that the plasma frequency increase with the increase of
the laser peak power as shown in Table (1).
0.00E+00 5.00E+10 1.00E+11 1.50E+11 2.00E+11 2.50E+11 3.00E+11 3.50E+11 4.00E+11 4.50E+11
400 500 600 700 800
ne
(c
m
-3)
9 Figure 7: plasma frequency vs. Laser peak energy of laser induced CdTe target plasma
Figure (8) Illustrates Debye shielding length of CdTe component target plasma, induced
by Nd:YAG laser irradiation in Vacuum media as a function of laser peak energy.
From this figure, it’s appeared that for a given laser energy the Debye length in Vacuum
is higher Value at low energy, because Debye length depends on plasma temperature and
plasma density (varies directly with √ Te and inversely with √ ne). Since the value of
electron temperature is larger Vacuum, then the Debye length is greater at low energy.
Figure 8: Debye length for CdTe in Vacuum different laser energies
0.0E+00 1.0E+09 2.0E+09 3.0E+09 4.0E+09 5.0E+09 6.0E+09
400 500 600 700 800
fp
H
z
Laser energy (mJ)
0.0E+00 5.0E-02 1.0E-01 1.5E-01 2.0E-01 2.5E-01 3.0E-01 3.5E-01
400 500 600 700 800
λD
cm
10
Number of particles in Debye sphere (ND) are calculated using Eq.(6). It showed from
figure (9) that for a given laser energy the Debye sphere ND in Vacuum , The higher
values of ND at low energy due to that it’s dependent on ne and Te, because of the values
of Te in Vacuum is high, and the values of ne are smaller leads to increase ND values in
Vacuum.
Figure 9: Debye number for CdTe in vacuum different laser energies
4-Conclusions
A Q-switched Nd:YAG laser at its fundamental wavelength (1064 nm) was used to study
the laser produced lead plasma. The emission spectrum of the plasma reveals transitions
of neutral atoms and singly ionized lead ions. The spectral lines intensities of the laser
induced plasma emission exhibited a strong dependence on the ambient conditions. It is
found that the intensities at different laser peak powers increase with increasing laser
peak power and then decreases when the power continues to increase. Plasma parameters
such as electron temperature, electron density, Debye length, number of particles in
Debye sphere and plasma frequency are found to be strongly effective by the laser
energy. The results showed variations of the electron temperature and the electron
number density with the laser energy indicate that both increase with increasing in laser
energy. The electron temperature calculated for the 1064 nm that the values of Te ,ne and
fp were increased in case of laser induced plasma in vacuum environment while the
values of λD and ND were decreased in laser induced plasma vacuum environment.
0.0E+00 1.0E+09 2.0E+09 3.0E+09 4.0E+09 5.0E+09 6.0E+09
400 500 600 700 800
ND
11
5-References
[1] A. A. I. Khalil, “Spectroscopic studies of UV lead plasmas produced by single and
double-pulse laser excitation,” Laser Phys., vol. 23, no. 1, 2013.
[2] N. M. Shaikh, Y. Tao, R. A. Burdt, S. Yuspeh, N. Amin, and M. S. Tillack, “Spectroscopic
Studies of Tin Plasma Using Laser Induced Breakdown Spectroscopy,” J. Phys. Conf. Ser., vol.
244, no. PART 4, pp. 2–5, 2010.
[3] M. L. Najarian and R. C. Chinni, “Temperature and electron density determination on
Laser-Induced Breakdown Spectroscopy(LIBS) plasmas: A physical chemistry experiment,” J. Chem.
Educ., vol. 90, no. 2, pp. 244–247, 2013.
[4] Takahashi, T., Watanabe, S., Kouda, M., Sato, G., Okada, Y., Kubo, S., ... & Ohno, R. (2001).
High-resolution CdTe detector and applications to imaging devices. IEEE Transactions on
Nuclear Science, Vol.48 , no.3,pp 287-291.
[5] Ren, J., Fu, L., Bian, G., Wong, M., Wang, T., Zha, G., ... & Chiang, T. C. (2015).
Spectroscopic studies of CdTe (111) bulk and surface electronic structure. Physical Review
B, vol.91,no.23 ,pp. 235303.
[6] David A. Cremers, Handbook of Laser-Induced Breakdown Spectroscopy, 2nd Editio. USA,
2013.
[7] S. Z. H. R. and J. A. Kashif Chaudhary, “Laser-Induced Plasma and its Applications,” RFID
Technol. Secur. Vulnerabilities, Countermeas., 2016.
[8] S. S. Harilal, C. V. Bindhu, R. C. Issac, V. P. N. Nampoori, and C. P. G. Vallabhan, “Electron
density and temperature measurements in a laser produced carbon plasma,” J. Appl. Phys., vol.
82, no. 5, pp. 2140–2146, 1997.
[9] M. C. Chen and E. C. Chen, Introduction To Plasma Physics And Controlled Fusion, vol. 1.
Los Angeles, 1983.
[10] A. M. El Sherbini, “Measurement of Plasma Parameters in Laser-Induced Breakdown
Spectroscopy Using Si-Lines,” World J. Nano Sci. Eng., vol. 2, pp. 206–212, 2012.
[11] BORIS M. SMIRNOV, Physics of Ionized Gases, vol. 16, no. 1. 2001.
[12] Suresh Chandra, textbook of plasma physics, 1ed ed. india, 2010.
[13] version 5., “National Institute of Standards and Technology (NIST) Atomic spectra database,”