Load Frequency Control in Deregulated
Environment using Honey Bee Algorithm
V.Shanmugasundaram1, S.Ramyalakshmi2
Assistant Professor, Dept. of EEE, Sona College of Technology, Salem, Tamilnadu, India1 PG Student [PSE], Dept. of EEE, Sona College of Technology, Salem, Tamilnadu, India2
ABSTRACT: The present work deals with the Load Frequency Control (LFC) of an interconnected two-area thermal-thermal system in a competitive electricity market. The oscillation of system frequency may sustain and grow to cause a serious frequency stability problem, if no adequate damping is available. PID controller provides the better responses. Dynamic responses of frequency deviations of each area are compared with other area and tie line power deviations are studied under various load disturbances. So in order to stabilize the system, the impact of Superconducting Magnetic Energy Storage system (SMES) is at the terminal of the power system. Intelligence technique based algorithm known as a Honey Bee algorithm (HBA). The two area power is optimized by a Honey Bee Algorithm. Sensitivity and robustness of the system is tested under various operating conditions with SMES to prove the effectiveness in damping out the oscillations in the power system and provide better stability to the system.
KEYWORDS: Load Frequency control, Distribution Company Participation Matrix, Deregulation, Superconducting Magnetic Energy Storage system, Honey Bee Algorithm.
I.INTRODUCTION
Large scale power systems were normally composed of control areas or regions representing coherent groups of generators. An interconnected power system is basically a large power system consisting of a number of power systems. These power systems or areas were connected by tie lines[1]. The objectives of a control strategy is to generate and deliver power to an interconnected power system as economically and reliably as possible, while maintaining the voltage and frequency within permissible limit. The Load Frequency Control (LFC) loop controls the real power and frequency, while the Automatic Voltage regulator (AVR) loop controls the reactive power and voltage. With the growth of interconnected power system, LFC has gained more importance. It should be noted that in this linearized model of the AGC, hence is based on an assumption that the frequency and tie line power deviations are small as referred in [2].
In the deregulated system, the engineering aspects of planning and operation have to be formulated with the better and innovative ideas. With the emergence of the distinct identities of GENCOs, TRANSCOs, DISCOs and the ISO, many of the ancillary services of a vertically integrated utility will have a different role to play and hence have to be designed differently. In the new scenario, a DISCO can contract individually with a GENCO for power and these transactions were done under the supervision of the ISO as referred in [5].
The concept of DISCO participation matrix (DPM) was utilized to make the visualization and implementation of the contracts.. The trajectory sensitivities are helpful in studying the parameters as well as optimization of AGC parameters[4],[6].The PID controllers were used in addition with the Facts device to improve the responses of the interconnected power system.
A Superconducting Magnetic Energy Storage (SMES) which is Capable of Controlling active and reactive powers simultaneously was expected as one of the most effective and significant stabilizer of frequency oscillations. The viability of SMES for power system dynamic performance improvement have been shown in [10], [12].
The optimization technique used here is the Honey Bee Algorithm or ABC. The artificial bee colony algorithm
The objectives of this paper include[17]
1. To hold the system frequency close to the nominal frequency of 50 Hz. 2. To maintain the correct value of Power exchange between the control areas. 3. To improve the dynamic performances of the power system.
In section II, linearized model of an interconnected two area system with deregulation is presented and discussed. The linearized model of SMES is presented in section III. The block diagram formulation is provided in section IV. The optimization of the two area system using Honey Bee Algorithm is shown in section V and the simulation results are discussed under the section VI. System data is provided under the section VII. Conclusion is presented in section VIII.
II.SYSTEM INVESTIGATION
A. Linearized model of an interconnected two area system
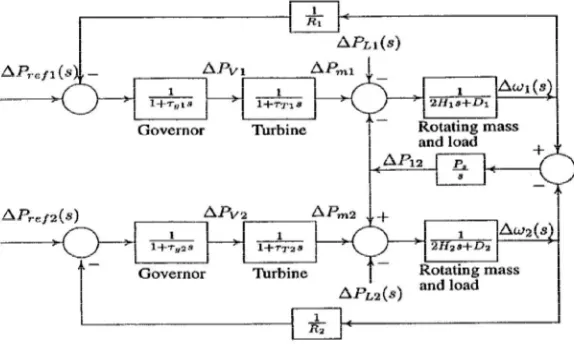
In two area system, two single area systems were interconnected via the tie line. Interconnection established increases the overall system reliability. Even if some generating units in one area fail, the generating units in the other area can compensate to meet the load demand. The power flowing across a transmission line could be modeled using the DC load flow equation as referred in [11].
The areas were connected by a single transmission line. The power flow over the transmission line will appear as a positive load to one area and an equal, but negative load to the other, or vice versa, depending on the direction of flow. The direction of flow would be dictated by the relative phase angle between the areas, which is determined by the relative speed-deviations in the areas.
Fig. 1 Block diagram of interconnected system
B. Linearized model of an interconnected two area in Deregulated environment
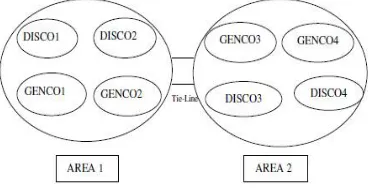
The traditional power system industry has a “vertically integrated utility” (VIU) structure. In the restructured or deregulated environment, vertically integrated utilities no longer exist. The utilities no longer own generation, transmission, and distribution; instead, there are three different entities, viz., GENCOs (generation companies), TRANSCOs (transmission companies) and DISCOs (distribution companies). As there are several GENCOs and DISCOs in the deregulated structure, a DISCO has the freedom to have a contract with any GENCO for transaction of power. After deregulation any DISCOs can demand for the power supply from any GENCOs. There is no boundation on the DISCOs for purchasing of electricity from any GENCOs. For understanding the concept of this kind of contracts DISCO participation matrix (DPM)[6].
A DPM is a matrix with the number of rows equal to the number of GENCOs and the number of columns equal to the number of DISCOs in the system [9]. Each entry in this matrix could be thought of as fraction of a total load contracted by a DISCO (column) towards a GENCO (row). The sum of all the entries in a column DPM is unity [8].
Fig. 2 Two area system in Deregulated Environment
III. LINEARIZED MODEL OF SMES
The SMES is an energy storage device that stores energy in the form of DC electricity that is the source of DC magnetic field. SMES used here is to damp oscillation in frequency and power in the power system caused by Load disturbances. SMES can enhance power system stability and improve the power quality through active and reactive power compensation. Therefore, for the implementation of SMES, a power handling system is required which is also known as Power Conditioning System (PCS)[12]. A PCS provides a power electronic interface between AC power system and the superconducting coil. It allows the SMES system to respond within tens of milliseconds to power demands that could include a change from the maximum charge rate to maximum discharge power. This rapid response provides the improvement of the system stability. The SMES system is highly efficient, as there is no energy conversion from one form to another.
A large superconducting coil is the heart of the SMES system. Cryostat or Dewar that consists of a liquid and a vacuum vessel that cools the system. A cryogenic system is to keep the temperature well below the critical temperature for the superconductor. An AC/DC power conversion or conditioning system was used. A transformer provides the connection to the power system and reduces the operating voltage to acceptable levels of PCS.
The control signal to the SMES can be either Frequency deviation or Area Control Error (ACE). In this work, input to the SMES is frequency deviation in area 1. Fig. 3 provides the structure of SMES that contains gain block KSMES,
time constant TSMES and compensation block having constants T1, T2, T3, T4 respectively.
Fig. 4 Structure of SMES
IV. BLOCK DIAGRAM FORMULATION
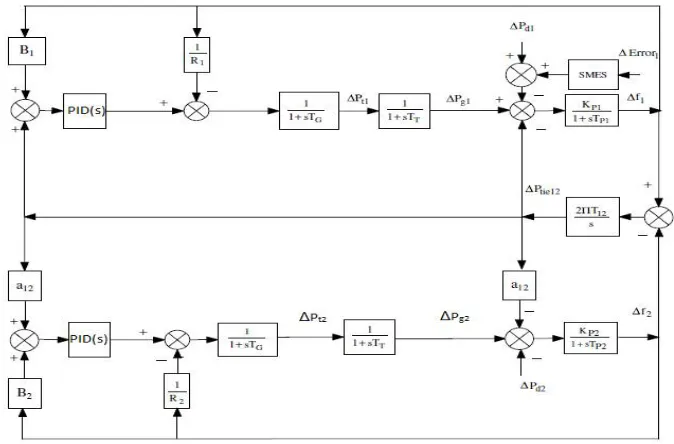
Fig. 5 shows the block diagram of the two area thermal-thermal system with the SMES in the Deregulated environment. The load changes when the power demanded by DISCO changes, that would show in the area of local load that depend on the DISCO changes.
The controller used for this work is PID controller. The advantages of PID controller over the other conventional controller include[15]
This was done to improve the dynamic responses.
Integral control produces some oscillatory response and that increases the settling time.
The PID controller produces the control signal consisting of three terms which includes proportional to error signal, Proportional to integral error signal and one proportional to derivative of error signal.
Derivative term is sensitive to noise signal.
By the use of PID controller, the rate of change of oscillation decreases with time.
V. OPTIMIZATION OF TWO AREA THERMAL-THERMAL SYSTEM IN DEREGULATED ENVIRONMENT
The objective of LFC is to establish primary frequency regulation, restore the frequency to its nominal value as quickly as possible and minimize the tie line power flow oscillations between neighboring control areas. The optimization used here is a Honey Bee Algorithm or ABC Algorithm. This technique provides better performance and stability to the power system.
In the ABC model, the colony consists of three groups of bees: employed bees, onlookers and scouts. It was assumed that there is only one artificial employed bee for each food source. In other words, the number of employed bees in the colony is equal to the number of food sources around the hive. Employed bees go to their food source and come back to hive and dance in this area[16]. The employed bee whose food source has abandoned becomes a scout and starts to search for finding a new food source. Onlookers watch the dances of employed bees and choose food sources depending on dances. The main steps of the algorithm are given below:
Initial food sources were produced for all employed bees
REPEAT
Each employed bee goes to a food source in her memory and determines a neighbour source, then evaluates its nectar amount and dances in the hive
Each onlooker watches the dance of employed bees and chooses one of their sources depending on the dances, and then goes to that source. After choosing a neighbour around that, she evaluates its nectar amount.
Abandoned food sources were determined and are replaced with the new food sources discovered by scouts.
The best food source found so far is registered.
UNTIL (requirements were met)
In the present work, an Integral Square Error (ISE) criterion was used to minimize the objective function as follows. The Area Control Error as follows
ACE1 = B1Δf1+ ΔPtie1-2,error (1)
ACE2 = B2Δf2+ ΔPtie2-1,error (2)
(3)
VI. SIMULATION RESULTS AND DISCUSSION
An interconnected power system was considered as being divided into control areas, which were connected by tie lines. In each control area, all generators are assumed to form a coherent group. Some of the areas in the power system were considered having load perturbations having same magnitudes. The detailed block diagram of the interconnected power system is given in fig. 5.
In this paper, simulations were performed using Matlab/Simulink and deregulation part on the two area power system. A step load perturbation of 0.05p.u was applied in area 1 and frequency oscillation and tie line power deviations are investigated before and after deregulation. The frequency oscillations and tie line power flow were investigated. The investigations are carried out considering the two cases.
1 2, 1 2, 1 2.
tie error tie act tie schd
P
P
P
Case 1:
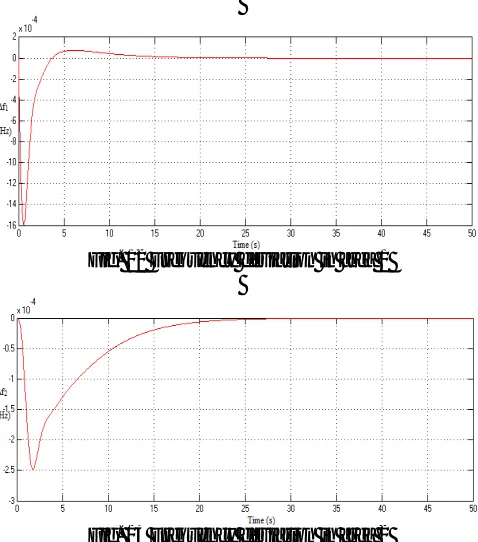
Responses of two area system without SMES unit
Before Deregulation
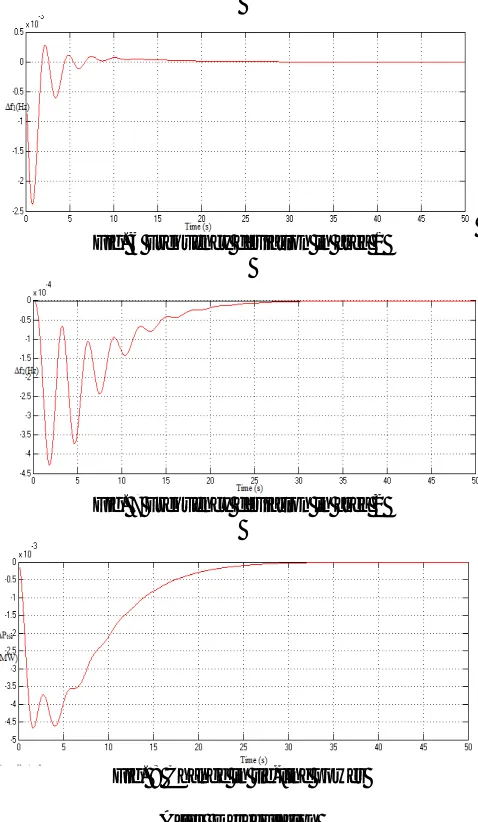
Fig. 6 Frequency deviation in area 1
Fig. 7 Frequency deviation in area 2
Fig. 8 Change in tie-line power
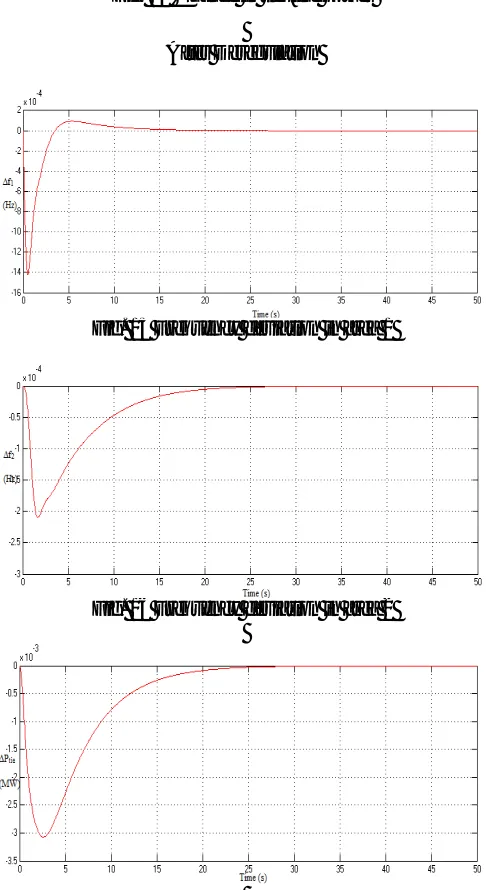
After Deregulation
Fig. 10 Frequency deviation in area 2
Fig. 11 Change in tie-line power
Case 2:
Responses of two area system with SMES unit.
Before Deregulation
Fig. 12 Frequency deviation in area 1
Fig. 14 Change in tie-line power
After Deregulation
Fig. 15 Frequency deviation in area 1
Fig. 16 Frequency deviation in area 2
Figs. 6 - 8 shows the responses of the two area system before deregulation without SMES. Figs. 9 - 11 shows the responses of the two area system after deregulation without SMES. Figs. 12 - 14 shows the responses of the two area system with SMES before deregulation. Figs. 15 - 17 shows the responses of the two area system with SMES after
deregulation. The system performance are in the terms of Δf1, Δf2 of area 1 and 2 and ΔPtie.
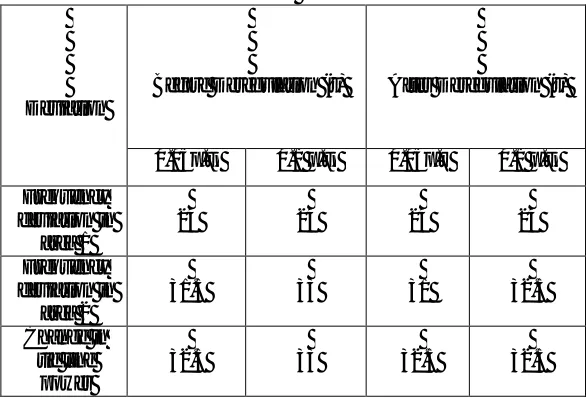
SETTLING TIME
Deviation
Before Deregulation (s) After Deregulation(s)
0.05p.u. 0.1 p.u. 0.05p.u 0.1p.u.
Frequency deviation in
area 1
25.5 26 25.5 25.5
Frequency deviation in
area 2
34.5 35 34 33.5
Change in tie
line power 35.5 36 35 35.5
Table. 1 Comparison of settling time for before and after Deregulation without SMES unit
Deviation
Before Deregulation (s) After Deregulation (s)
0.05p.u. 0.1 p.u. 0.05p.u 0.1 p.u.
Frequency deviation in
area 1
24 24 24 24
Frequency deviation in
area 2
31.5 33 31 32.5
Change in tie line
power
32.5 33 32.5 32.5
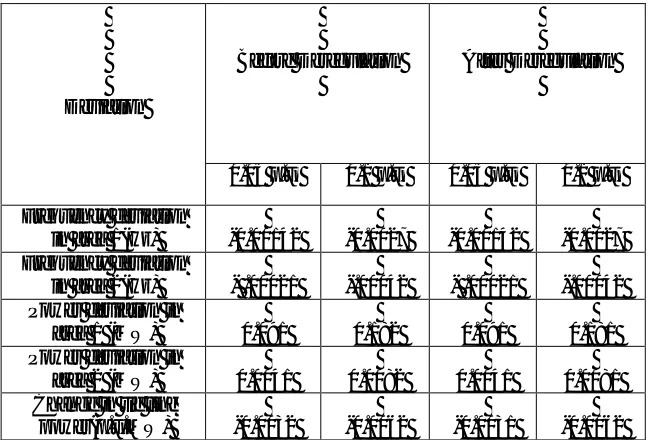
PEAK OVERSHOOT
Deviation
Before Deregulation After Deregulation
0.05 p.u. 0.1 p.u. 0.05 p.u. 0.1 p.u.
Frequency deviation
in area 1(Hz) -0.0024 -0.0048 -0.0023 -0.0046 Frequency deviation
in area 2(Hz) -.00043 -.00086 -.00042 -.00085 Power deviation in
area 1 (MW) 0.093 0.183 0.092 0.182 Power deviation in
area 2 (MW) 0.0085 0.0175 0.0083 0.0017 Change in tie line
power(p.u.MW) -0.0046 -0.0093 -0.0045 -0.0092
Table. 3 Comparison of Peak Overshoot for before and after Deregulation without SMES
Deviation
Before Deregulation After Deregulation
0.05 p.u. 0.1 p.u. 0.05 p.u. 0.1 p.u.
Frequency deviation
in area 1(Hz) -0.00142 -0.0027 -0.00142 -0.0027 Frequency deviation
in area 2(Hz) - .00021 -.00042 - .00021 -.00042 Power deviation in
area 1 (MW) 0.091 0.182 0.091 0.181 Power deviation in
area 2 (MW) 0.0041 0.0082 0.0041 0.0081 Change in tie line
power(p.u.MW) -0.0032 -0.0062 -0.0031 -0.0062
VII. APPENDIX
SYSTEM DATA
Tg = 0.08s
Tt = 0.3s
Tp = 20s
Kp = 120
Ki = 1
R = 2.4Hz/MW B = 0.415MW/Hz a = 1
apf’s = 0.5
VIII.CONCLUSION
LFC is important in the power system. The frequency and tie-line power deviation responses were obtained for various operating conditions. In this work, we compare the dynamic responses of frequency and tie-line power for before and after deregulation as well as with and without SMES. The concept of DISCO and GENCO are very useful in the deregulated environment. The design of PID controller also plays an important role in obtaining the results in both before and after deregulation. The simulation results are satisfactory for different operating cases in LFC and SMES.
The future scope of the present work includes the coordinated control of SSSC with the SMES could be proposed in this deregulated environment. In future we can apply some other artificial intelligent techniques for better result.
REFERENCES
[1]. Jaleeli, N., Van Slyck, L.S., Ewart, D.N., Fink, L.H., and Hoffmann, A.G.: "Understanding automatic generation control", IEEE Trans. Power Syst., vol. 3, no. 7, pp. 1106–1122, 1992.
[2]. V. Donde, M. A. Pai, I. A. Hiskens, “Simulation of Bilateral Contracts in an AGC System After Restructuring”, IEEE Trans, Power Syst., vol. 4, no. 6, 2003.
[3]. B. H. Bakken, and O. S. Grande, “Automatic Generation Control in a Deregulated Power System”, IEEE Tran. Power Systems, vol. 13, No. 4, pp. 1401-1406, 1998.
[4]. Vaibhav Donde, M. A. Pai, Ian A. Hiskens, “Simulation and Optimization in an AGC System after Deregulation”, IEEE Trans, Power systems, vol. 16, no. 3, 2001.
[5]. R. D. Christie, and A. Bose, “Load Frequency Control Issues In Power System Operation after Deregulation,” IEEE Transactions on Power Systems, vol. 11, No. 3, August 1996, pp. 1191-1200.
[6]. Vijay Rohilla, K. P. Singh Parmar, Sanju Saini, “Optimization of agc parameters in the restructured power system environment using GA”, ISSN: 2231 – 6604, Volume 3, Issue 2, pp: 30-40, 2012.
[7]. N. Bekhouche, “Automatic Generation Control Before After Deregulation,” in Proc. of the Thirty Forth Southeastern Symposium on System Theory, March 2002, pp. 321-323.
[8]. Arun Kumar, Sirdeep Singh, “Automatic Generation Control Issues in Power System Operation after Deregulation Review”, International Journal of Advanced Research in Computer Science and Software Engineering, Volume 4, Issue 5, 2014.
[9]. Mitani Y, Tisuji K, Murakami Y, “Application of SMES to improve power system dynamic performance, IEEE Trans. Power syst 1998; PWRS-3(4).
[10].A.Suresh babu, Ch.Saibabu, S.Sivanagaraju, “Tuning of Integral Controller for Load Following of SMES and SSSC based Multi Area System under Deregulated Scenario”, IOSR Journal, e-ISSN: 2278-1676 Volume 4, Issue 3,PP 08-18, 2013.
[11].O. I. Elgerd, Electric Energy Systems Theory: An Introduction, McGraw Hill, 1982.
[12].J. Raja, C. Christopher Asir Rajan, “Improved power system dynamic performance using SMES for frequency excursion”, J. Electrical systems 7-2(2011).
[13].D. P. Kothari and I. J. Nagrath, “Power System Engineering”, 2nd edition, TMH, New Delhi, 2010. [14].P. Kundur, “Power system stability & control.” New York: McGraw-Hill, 1994, pp. 418-448.
[15].Athira Elizabeth Alex, Aju Thomas, “Optimization and simulation of AGC in Restructured Power system with SMES and PID controllers using ITSE technique”, IJACTE, vol. 3, issue-4, 2014.
[16].D. Dervis Karaboga, An Idea Based On Honey Bee Swarm for Numerical Optimization, Technical Report-TR06,Erciyes University, Engineering Faculty, Computer Engineering Department 2005.
[17].Hadi Saadat, Power System Analysis, McGraw-Hill,2002.