PhD Scholar & Associate Professor, Dept. of EEE, Al Falah University, Faridabad, Haryana, India1
PG Student [Power System], Dept. of EEE, Al Falah University, Faridabad, Haryana, India2
Professor, Dept. of EEE, Al Falah University, Faridabad, Haryana, India3
ABSTRACT:This paper reviews output characteristics of Photo-Voltaic module supplying load with and without Maximum Power Point Technique (MPPT). Since the Photovoltaic array output is known to be affected by radiation of sun and the temperature, which makes is compulsory to find out an effective method to draw out maximum power from Photo-Voltaic cell/ modules. In this paper Perturb and Observe (P&O) algorithm is selected because of its easy implementation. A comparison has done in terms of I-V, P-V & Power verses time characteristics obtained from both the models from a 235W PV module.
KEYWORDS:Photovoltaic module, Solar cell modelling, PV power generation, MPPT Algorithm, Dc-Dc converter, Matlab, Simulation.
I.INTRODUCTION
As we very well know that for social and economic development as well as for human activity energy is a basic need. Human life can be made better by the sufficient supply of energy. Now a day’s global warming is occurring due to the nonstop combustion of fossil fuels all over the world, creating environmental hazards and reducing conventional energy sources, this scenario is contributing to the need to search for an energy source, which is clean and available in excess. Due to the huge impetus in the government policies on the development of solar energy, it is acting as a main alternative renewable energy source. PV cells/modules is used for the generation of DC voltage and can be given to buck converter, boost converter etc. based on the requirement. The converter output is given to the battery and via inverter it can be converted to AC and can be given to the AC grid. The solar energy is popular due to easy maintenance, cleanliness, sustainability, and zero noise characteristics. [1-3]
Because of expensive PV manufacturing process and relatively low energy conversion efficiency [4,5] the MPPT technique is very crucial to find out the optimum operating point or maximum power that is to be extracted from PV array. There are a lot of published literatures and papers related to solar MPPT techniques [6].The generation from PV is reliable and it involves no moving parts due to this the maintenance and operating costs are very low [7]. PV cells/ modules are the cores of the solar photovoltaic power generation unit. The cells of a solar PV system generate electricity from solar energy on the basis of photoelectric effect. Solar energy is directly converted into electricity by PV systems. The PV cell is the basic building block of photovoltaic system and it is a semiconductor device that converts the energy from solar to direct current (DC). The PV system is typically rated up to 50 W to 300 W. The PV systems are highly modular type and the modules may be connected together for providing power from few watts to megawatts.
Fig 1: Equivalent Solar Cell Model
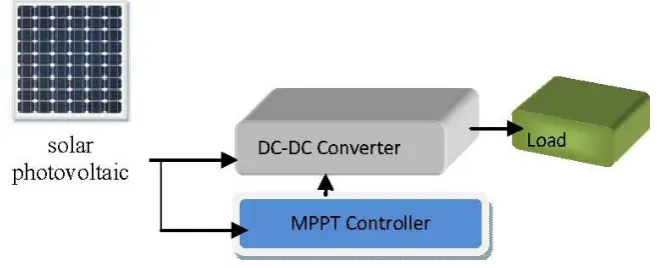
In typical solar MPPT system, switching DC-Dc convertor is the mandatory element for tuning the PV output power towards its maximum peak level, by changing the duty cycle D. Buck converters and the boost converters are the most popular circuits, among the DC-DC converters, and both are mostly used in solar Maximum Power Point Tracking system because they are less expensive and more simple compared to the buck- boost and CUK converter. Boost converter is more favorable than Buck converter for MPPT application, because most of the solar PV module output voltage would be lower than the required external load voltage. Moreover, the switching component in Buck converter is placed at the Input side and series with input voltage, which will discontinue the current flow within the system. This will definitely result in energy losses during the power generation process. Hence Boost converter provides greater benefit in terms of cost saving and higher efficiency. [8-12]
Fig 2: Equivalent Solar Cell Model
II.SYSTEM MODEL AND ASSUMPTIONS
Fig 3 and Fig. 4 show the output characteristic of a particular solar cell at different cell temperature and solar insolation, denoted as V-I and V-P curves. These figures indicate that the PV cell’s nonlinear characteristic is highly influenced by temperature and sun-irradiation. Through MPPT system maximum peak operating points (Pmpp, Impp and
Fig.3 I-V Curves of different Sun Irradiation
Fig. 4 describes the effect of cell temperature and irradiance towards P-V curves. In contrast to the influence of sun irradiance, the cell temperature significantly affects the PV voltage. The temperature is inversely proportional to the PV voltage, at which the increment of temperature will eventually decrease the level of PV maximum power point and output voltage.
Fig. 4 P-V Curves of Different Sun Irradiation
Considering all well-established PV cell modeling circuit from other literatures by [23, 24] the model of single diode in fig 5 is regarded as the most suitable model for MPPT research purpose.
Fig.6 Solar Cell double diode model
Solar cells are made up of a p-n junction fabricated in a thin layer of a semiconductor material. The solar cell has exponential current-voltage output characteristics, which is similar as of a diode [13]. When solar cell has been hit by the photons from the solar energy, with the energy, which is higher than the band gap energy of the semiconductor material, electrons are knocked loose from the atoms in the material and create electron and hole pairs. Due to the internal electric field of p-n junction these charge carriers are swept apart and current is being created which is directly proportional to the incident radiation. When we short circuit the cell, the generated current flows in the external circuit, and when the terminals are open circuited, the current is shunted internallyby the intrinsic P-N junction diode. The open circuit voltage characteristic of cell is being set up by the characteristic of the diode. As silicon cells are the building block of PV modules and the Si solar cells give voltage output of approximately 0.7 V in open circuit condition. The operation of the solar P-V cell [14] is described by the double exponential equation of the solar cell which is being derived from the physics of the p-n junction and can be modeled into current source having two parallel diodes, a series and shunt resistance as indicated in Fig. 6.
I = Iph –Is1 [eq(V+IRse/kT-1] - Is2[eq)V+IRse)/AkT -1] – (V+IRse)/Rsh (1)
However the model shown in figure 6 can again be simplified by removing the current Is2, the reverse saturation current of diode D2 can be neglected, as the amount of recombination is negligible and less. Under STC conditions this assumption is very much acceptable and generates error only at very low values of irradiation such as 100 W/m2 [18]. Hence finally the solar cell generalized model with minimum complexity is developed, as shown as in Fig 5.Where:
However the model shown in figure 6 can again be simplified by removing the current Is2, the reverse saturation current of diode D2 can be neglected, as the amount of recombination is negligible and less. Under STC conditions this assumption is very much acceptable and generates error only at very low values of irradiation such as 100 W/m2 [18]. Hence finally the solar cell generalized model with minimum complexity is developed, as shown as in fig 5.After the assumptions the single diode model equation is:
I= Iph- Is [eq(V+IRse)/AkT -1] -(V+IRse)/Rsh (2)
Iph Solar cell generated photo diode current which depends on temperature and irradiance
Is1 Saturation current which is generated by diffusion mechanism of diode D1
Is2 Saturation current generated by the recombination in space charge layer
Rsh Shunt resistance which represents shunt current leakage to the ground
Rse Series resistance which represents contact resistance
K Boltzmann’s constant , (1.38x10(-23)J/K)
Q Electron charge, 1.6x 10(-19)C
attempt using Matlab as a tool has been made to develop a model for the solar cell supplying load with MPPT and without MPPT. The cell solar irradiance and temperature are used as inputs and the output is the cell current, which is based on its operating voltage. With the help of Simulink blocks the model has been developed by translating the mathematical equations directly in to a model. If there is a case of interfacing with power conditioning systems, the physical parameters are being converted into equivalent electrical parameters by making use of controlled sources. Further to find out the comparison of the output characteristics of PV module with and without MPPT the models in Matlab have been made as shown in Fig. 7 and Fig 8.Perturbation and observation algorithm is used in this study due to its easy implementation. This method is also known by the name of hill climbing method [25]. Its working principle is based on making small active voltage perturbation in a certain working voltage of PV cells and then observing the change of direction of power output. The perturbation in the same direction is kept when the output power increases; otherwise the perturbation, which is against the original direction, is kept.
Fig: 7 Model of PV system without MPPT algorithm
In the fig 7, it shows the model ofPV system without MPPT, simulated in Matlab, which is used in this study.
Table 1: Technical Specs. of Solar Module
Parameter @STC Variable Parameter Specification
Max. Circuit voltage in watts Pm 235W
Open circuit voltage in Volts Voc 54.2V
Short Circuit current in Amps Isc 6.2A
Voltage @max. Power Vmp 45.8V
Current @max. Power Imp 5.1A
Temperature Coefficients Voltage -(80±10) mV/° C
Current (0.065±0.15) %/°C
Type of cell Mono Crystalline Silicon
The manufacture specification of the solar module used for this study is given in table 1 [22]. Most of the specifications of the manufacturer are valid at the STC conditions. However, the solar PV module is rarely operated at the STC conditions and these produce lots of uncertainties in terms of its power delivery capability. In this study the I-V and V-t curves are plotted in Fig.13& Fig.14 without MPPT and with MPPT respectively. Further Power (watts) curves with respect to time are plotted shown in Fig.7 & Fig.8 for the arrangement indicated in Fig: 7(without MPPT) and Fig: 8(with MPPT).
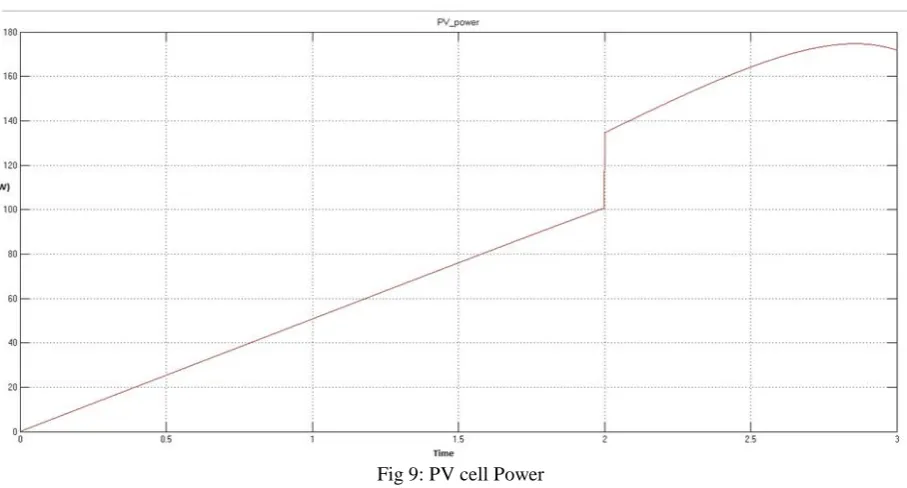
Fig 9: PV cell Power
Fig10: Insolation with respect to Time
Fig. 10 indicates the insolation level w.r.t. time for which the Fig.9 power of PV cell is plotted, in the plotting of power the same insolation level is used throughout the time.
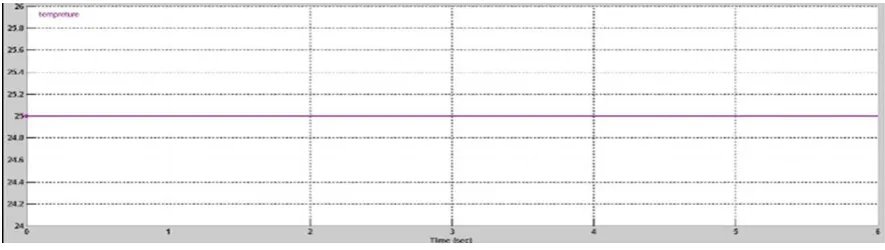
Fig11: Temperature w.r.t. time
Fig. 11 represents the temperature which is being used for the plotting and it can be seen that it remains constant at 25 deg. C. The plotting of power in Fig. 9 is done in this fixed temperature.
In the above shown Fig.12 it is clearly visible that the power from PV module using PWM technique is variable and not maximum.
Fig13: Graphs for Voltage –Current & Voltage-time for without MPPT model
In the above Figs, graphs are plotted between V-I & V-t for the model shown in Fig.7.These graphs are plotted for insolation level and temperature as indicated in Figures 10 &11.
Fig14: Graphs for Voltage-Current & Voltage-time for MPPT model
Fig15: Graph between output power (watt) &time (second) of module with MPPT
Fig.15 displays the power extracted from the PV module using MPPT algorithm, now if we compare the power with and without MPPT as indicated in Fig.15 & Fig.12 respectively, power obtained after implementation of MPPT algorithm is much higher and constant as compared towithout MPPT algorithmfrom PVmodule.
V. RESULT AND DISCUSSION
The V-I & and V-t Characteristics as indicated in Fig.13 & Fig. 14, of the models of solar cell supplying the load have been obtained and plotted. The Power vs. time characteristics is obtained for both the conditions i.e. without MPPT and with MPPT scheme as shown in Fig.12and15 respectively. The above plots for both the models of Fig.7 & Fig.8, explain the Voltage –Current, Voltage-time& Power-time characteristics and it’s been found that the efficiency increased drastically in the model with MPPT.
VI.CONCLUSION
In this paper an attempt is made to develop a model for PV cell with MPPT and without MPPT in Matlab to find out the increase in efficiency using MPPT.The output characteristics obtained from both the models are verified. The models are compared and the P-V and I-V characteristics generated for the models. The model proposed in this paper using Matlab performs well for developing model for solar PV systems with MPPT.
REFERENCES
[1] Hua Chihchiang, Lin Jongrong, Shen Chihming.Implementation of a DSP- Controlled Photovoltaic System with Peak Power Tracking.IEEE Transactions on industrial Electronics.1998;45:99107
[2] Chiu Chian-song.T-SFuzzy Maximum Power Point Tracking Control of Solar Power Generation Systems.IEEE Transactions on Energy Conversion.2010:25:1123-32
[3] Chiu Chian –Song, OuyangYa –Lun.Robust Maximum Power Tracking Control of Uncertain Photovoltaic Systems:A Unified T-S Fuzzy Model-Based Approach.IEEE Transactions on control Systems Technology.2011;19:1516-26.
[4] Hoe Choo Kian, A.C. Vaithlingum, R.Teymourzadeh, R. Rajkumar.Design of Automatic Soil Humidity Control Using Maximum Power Point Tracking Controller.2010 IEEE Student Conference on Research and Development (SCORD).2010:387-391.
[5] H.L. Tsai, C.S.Tu, Y.J.Su. Development of Generalized Photovoltaic Model Using MATLAB. Proceedings of the World Congress on Engineering and Computer Science (WCECS). October 22-24, 2008. San Francisco, USA.
[6] T.Esram, P/L. Chapman. Comparison of Photovoltaic Array Maximum Power Point Tracking Techniques.IEEE Transactions on Energy Conversion. 2007:22(2): 439-449.
[7] R. Akkaya and A.A. Kulaksiz” A microcontroller based standalone photovoltaic power system for residential appliances” Applied Energy, 2004, vol 78, issue4 pages 419-431.
[8] [8] Housheng Zhang,Suling Li, and Haidong Li .Maximum Power Point Tracker for Solar Cells Based on Boost Converter.2010 IInd International Conference on Computer Engineering and Technology(ICCET). 2010: V3-665-V4-68.
[9] A.Durgadevi, S.Arulselvi,S.P.Natarajan.study and implementation of Maximum Power Point Tracking(MPPT) Algorithm for Photovoltaic Systems.2011 Ist International Conference on electrical Energy Systems(ICEES),2011:240-245.
[11] Hua Chihchiang, Lin Jongrong, Shen Chihming.Implementation of a DSP Controlled Photovoltaic System with Peak Power Tracking. IEEE Transactions on Industrial Electronics.1998; 45:99-107.
[12] K.A.Kim, and P.T. Krein. Photovoltaic Converter Module Configurations for Maximum Power Point Operation. Power and Energy Conference at Illinois (PECI 2010).2010:77-82.
[13] Roger Messenger and Jerry Ventre, Photovoltaic system engineering, CRC press, 2000.
[14] J.A.Gow, C.D.Manning”Development of a photovoltaic array model for use in power electronics simulation studies”, IEE Proceedings on Electric Power Applications, Vol.146, no.2 pp.193-200, March 1999.
[15] Michael Jensen, Russell louie, Mehdi Etezadi and M.Sami fadali, “Model and Simulation of 75kW PV Solar Array”, IEEE Transmission and Distribution Conference and Exposition, April 2010, New Orleans, LA, USA.
[16] Chowdhury, S.; Taylor, G.A., Chowdhury, S.P. Saha, A.K, Song Y.H, “Modelling, simulation and performance analysis of a PV array in an embedded environment”, 42nd International Universities Power Engineering Conference, UPEC 2007, 4-6 September.
[17] Yuncong Jiang, Jaber A. Abu Qahouq and I. Batarseh ”Improved Solar PV Cell Matlab Simulation Model and Comparison”, IEEE Applied Power Electronics Conference, APEC 2007, Anaheim, CA, USA.
[18] Jirgen Schumacher, Ursula Eicker, Dirk Pietrushcha and Alberto catani, “ Exact analytical calculation of one diode model parameters from PV module data sheet information”, http://www.zafh.net/fileadmin/zafh.net/Media/Veroeffentlichungen/ 2007 /5BV.3.13.pdf.
[19] G. Walker, “Evaluating MPPT converter topologies using a MATLAB PV model”, J. Electrical & Electronics Engineering, Australia, vol. 21, no. 1, pp. 49–56, 2001.
[20] Huan-Liang Tsai, Ci-Siang Tu and Yi-jiesu, “Development of Generalized photovoltaic model using MATLAB/SIMULINK”, Proceedings of the World Congress on Engineering and Computer Science 2008 WCECS 2008, October 22 - 24, 2008, San Francisco, USA.
[21] Zhao Ran, XuHui-jun, ZhaiZhi-ying and Xhang shun-hua, “A simplified Double Exponential model of photovoltaic module in Matlab”, International Conference on Energy and Environment Technology, 2009. ICEET '09, Guilin, Guangxi.
[22] SHARP NU235 solar panel.
[23] J. A. Gow, C. D. Manning. Development of a Photovoltaic Array Model for Use in Power-Electronics Simulation Studies. IEE Proceedings - Electric Power Applications. 1999; 146(2): 193-200.
[24] M. G. Villalva, J. R. Gazoli, E. R. Filho. Comprehensive Approach to Modeling and Simulation of Photovoltaic Arrays. IEEE Transactions on Power Electronics, Power Electronics. 2009; 24: 1198¬1208.