UTILIZATION OF BY-PRODUCTS AND CLEANER PRODUCTION IN INDUSTRIAL NILE PERCH PROCESSING IN KENYA
WAIRANGU, EPHRAIM MAINA (BSc Wildlife Management)
REG. NO.: N50/CE/23081/2010
A thesis submitted in partial fulfilment of the requirements for a Master Degree in Environmental Science of Kenyatta University
i DECLARATION CANDIDATE’S DECLARATION
I, Ephraim Maina Wairangu declare that this thesis is my original work and has not been presented for the award of a degree in any other university or any other award. Signature: ________________ Date: _____________________
Ephraim Maina Wairangu
Department of Environmental Sciences Kenyatta University, Nairobi, Kenya
SUPERVISORS’ APPROVAL
We confirm that the work reported in this thesis was carried out by the candidate under our supervision and has been submitted with our approval as university supervisors.
Signature: _________________________ Date: ___________________ Dr. Esther C. Kitur
Department of Environmental Sciences Kenyatta University, Nairobi, Kenya
Signature: ____________________ Date: ________________________ Dr. Geoffrey M. Macharia
iii
ACKNOWLEDGEMENTS
I wish to express my deepest appreciation and thanks to my supervisors; Dr. Esther C. Kitur and Dr. Geoffrey M. Macharia for the valuable comments, encouragement, guidance, patience and support rendered to me throughout the study period.
I am also grateful to Mr. Okumu Makogola; the Director of Fisheries for the support extended during my study period.
Special thanks to Mr. Stanley Tonui, the management and workers of fisheries establishments in Nairobi, Kisumu and Homa Bay for their support in exchange of views related to my thesis. Last but not least, I am grateful to Mr. Dan Saina, Research Assistant for his tireless effort during the research period.
iv
TABLE OF CONTENTS
DECLARATION ... i
DEDICATION ... ii
ACKNOWLEDGEMENTS ... iii
LIST OF TABLES ... vii
LIST OF FIGURES ... viii
LIST OF ABBREVIATIONS AND ACRONYMS ... viii
ABSTRACT ... x
CHAPTER ONE: INTRODUCTION ... 1
1.1 Background to the study. ... 1
1.2 Problem Statement and Justification ... 4
1.3 Research Questions ... 5
1.4 Research Objectives ... 6
1.5 Research Hypothesis ... 6
1.6 Significance and anticipated output ... 6
1.7 Conceptual Framework ... 7
1.7 Limitations of the study ... 8
CHAPTER TWO: LITERATURE REVIEW ... 9
2.1 Introduction of Nile Perch into Lake Victoria ... 9
2.2 Fish processing... 11
2.3 By-products generated from NP processing. ... 15
2.3 Environmental impacts of fish processing plants. ... 16
2.4 Waste disposal methods used in fish processing. ... 17
2.5 Main environmental concerns for fish processing companies. ... 20
2.6 Cleaner Production... 22
CHAPTER THREE: STUDY AREA, MATERIALS AND METHODS ... 24
3.1 Introduction ... 24
3.1.1. Location and Climate of Study Areas ... 24
3.1.2 Drainage. ... 26
3.1.3 Population. ... 27
v
3.2 Research design. ... 29
3.3 Study population. ... 29
3.4 Target population. ... 30
3.5 Sampling technique ... 30
3.6 Sample size determination. ... 30
3.7 Research instruments. ... 32
3.8 Data collection methods. ... 32
3.9 Data analysis. ... 32
3.10 Ethical issues observed during the study. ... 33
CHAPTER FOUR: RESEARCH FINDINGS AND DISCUSSION ... 34
4.1 Introduction. ... 34
4.2 Demographic Information. ... 34
4.2.1 Age of respondents. ... 34
4.2.2 Gender of the respondents ... 36
4.3 The by-products in NP processing ... 37
4.3.1 Factors that affect the utilization of by-products ... 40
4.3.2 Association between identified Factors and utilization of by-products ... 44
4.4 Cleaner production in NP processing plants in Kenya ... 45
4.4.1 Factors Affecting CP... 47
4.5 Housekeeping measures ... 53
4.5.2 Energy consumption ... 59
4.8 Relationship between the quantities of by-products generated and CP. ... 62
4.8.1 Effects of waste disposal on CP in NP processing plants. ... 66
4.8.2 Test of Association between Measures taken and Quantities of By-products Yield ... 68
4.9 Hypothesis Testing... 69
CHAPTER FIVE: SUMMARY, CONCLUSIONS AND ... 71
RECOMMENDATIONS ... 71
5.1 Summary ... 71
5.1.1 Utilization of by-products in NP processing plants in Kenya... 71
vi
5.1.3 Measures for improving CP ... 73
5.2 Conclusion ... 76
5.3 Recommendations ... 77
REFERENCES ... 78
APPENDIX 1: RESEARCH QUESTIONNAIRE... 87
APPENDIX 2: OBSERVATION CHECKLIST ... 92
vii LIST OF TABLES
Table 1. Respondents’ age groups ... 35
Table 2. Factors affecting the utilization of by-products ... 42
Table 3. Test of Mean Differences for the Waste in the Three Plants ... 43
Table 4. Association between Factors Identified and By-product Utilization ... 44
Table 5. Factors Affecting CP ... 49
Table 6. Effect of Packaging on Waste Management ... 50
Table 7. Effects of water usage on CP ... 52
Table 8. Measures used to improve effective water use in CP ... 56
Table 9. Effectiveness of the technology on water usage ... 58
Table 10. Association between Measures taken and Quantities of Waste Produced ... 69
viii LIST OF FIGURES
Figure 1.1. Conceptual framework ... 8
Figure 3.1. Map showing the location of three NP plants in Nairobi, Kisumu and Homa Bay ... 25
Figure 4.1. Distribution of respondents’ age group in Nairobi, Kisumu and Homa Bay ... 35
Figure 4. 2. Distribution of respondents’ gender in Nairobi, Kisumu and Homa Bay. ... 37
Figure 4. 3. Average selling price of by-products in the three NP plants ... 40
Figure 4. 4. Factors affecting utilization of by-products ... 42
Figure 4.5. Internal regulation governing CP ... 47
Figure 4. 6. Factors affecting CP in Nairobi, Kisumu and Homa Bay ... 49
Figure 4.7. Impacts of packaging material on CP ... 51
Figure 4. 8. Effects of water usage on CP... 53
Figure 4. 9 Measures used to improve effective water use in CP. ... 57
Figure 4.10 Water consumption per ton of raw material at the three NP plants between 2007 to 2011 ... 57
Figure 4.11. Effectiveness of the technology on water usage... 59
Figure 4.12. Measures used to reduce energy use in CP ... 62
Figure 4. 13 Effects of utilization of by-products on waste generation ... 65
Figure 4.14 Waste disposal practices in NP plants ... 65
Figure 4. 15 Effects of waste disposal on CP ... 67
ix
LIST OF ABBREVIATIONS AND ACRONYMS CCRF Code of Practice for Responsible Fisheries
Cm Centimeter
CP Cleaner Production
DFID Department for International Development of the United Kingdom
EU European Union
FAO Food and Agricultural Organization of United Nations GDP Gross Domestic Product
GMP Good Manufacturing Practices
HACCP Hazard Analysis Critical Control Point
Kg Kilogram
Km Kilometre
LFVO Lake Victoria Fisheries Organization
Mm Millimetre
NEMA National Environmental Management Authority
NP Nile Perch
OECD Organization for Economic Cooperation and Development SPSS Scientific Packages for Social Sciences
x ABSTRACT
1
CHAPTER ONE: INTRODUCTION 1.1 Background to the study.
Fish has been a popular part of the diet in many parts of the world and in many countries, it constitute the main supply of animal protein (Tidwell and Geoff, 2001). Fish is an important source of protein and its harvest, handling, processing and distribution provides livelihood for millions of people as well as providing valuable foreign exchange earnings to many countries (Abolagba and Chukwu, 2008). The importanceof fish as a crucial element in diets, especially the diets of infants, young children and pregnant women, is now widely recognized and today more people are turning to fish as a healthy alternative to red meat (Tidwell and Geoff, 2001).
2
Approximately 30% of the global total catch was used for fish meal and animal feed because of its unattractive colour, flavour, texture, small size, high fat content or poor functional properties (Rebeca et al., 1991; Venugopal and Shahidi, 1998) and a relatively small part of the total catch used for human consumption.
In 2009 the fisheries sub-sector in Kenya supported about a million people directly and indirectly, working as fish traders, fish processors, merchants of fishing accessories and their dependants (Ministry of Fisheries Development, 2009). In 2012, Kenya produced 154,015 metric tons of fish from inland, aquaculture and marine artisanal fisheries with an ex-vessel and farm gate value of USD 210 million and this accounted for 0.5% of the country’s Gross Domestic Product (GDP) (Ministry of Agriculture, Livestock and Fisheries, 2012).
3
The EU market where Kenyan fish is mainly exported offer premium price for fish and fishery products but exporting countries must meet stringent food safety requirements in the primary production areas, transportation and during processing (Abila, 2003). Cleaner production is the continuous application of an integrated preventive environmental strategy applied to processes, products and services to increase overall efficiency and reduce risks to humans and the environment (UNEP, 2004). For production processes, CP involves the conservation of raw materials and energy, the elimination of toxic raw materials and the reduction in the quantities and toxicity of waste and emissions. World over, the utilization of by-products is an important opportunity for the industry since it reduces environmental burdens and can potentially generate additional revenue. By applying preventive environmental strategies in a systematic way through CP, companies have been able to reduce inefficiencies in the processing and reduce the amount of wastes generated. More efficiency translates to less costs and increased profits, thus benefiting the company both in financial terms and in improved environmental performance.
4
and is mainly processed into chilled and frozen fish fillet for export (Mbatia, 2011 and Breivik et al., 1997). Fresh fish products are highly perishable and refrigerated storage is required throughout the life of the product to maintain eating appeal and prevent microbiological spoilage. The processing leads to high volume of by-products. The by-products include fish maws, fish frames, trimmings and roe/eggs, fat-pads, skins, scales and viscera. The annual solid waste generated by fish processing industries along Lake Victoria (Gumisiriza et al., 2009) was estimated at 36,000 metric tons.
A further increase in the generation of fish processing wastes in Kenya is expected with the identification of aquaculture development as a means to increase fish production in the country and as a tool to eradicate poverty and hunger in the region. The waste generated can be processed into by-products and sold to earn the industry money and reduce environmental pollution through discharge of effluents and dumping of wastes into the environment. Disposing and managing the waste is a challenge facing many fish processing plants in the region and in particular Kenya. It was against this background that the study aimed to find out the utilization of by-products and CP in the industrial NP processing in Kenya.
1.2 Problem Statement and Justification
5
Kenya. The high volumes of raw materials received by the NP processing plants and the processing practices in place to generate the desired final products and associated by-products demand close monitoring. The data collected formed the baseline information on the utilization of by-products and CP. It is important to obtain CP data of each of the establishments since this would enhance formulation and the implementation of better CP in the entire NP processing plants in the country. The utilization of the by-products in industrial fish processing was critical to sustainable utilization of fisheries resources, environmental conservation and the production of safe food through the use of CP principles. Poor utilization of by-products and inefficient CP within the fish processing plants has led to environmental degradation in Kenya.
The purpose of this study was therefore to find out factors affecting the utilization of by-products and CP in industrial NP processing in Kenya.
1.3 Research Questions
To achieve the set objectives this study sought to answer the following research questions:-
1. Which are the factors influencing utilization of the by-products generated from NP processing?
2. What are the factors that influence the implementation of Cleaner production in NP processing plants in Kenya?
6 1.4 Research Objectives
The general research objective was to find out the utilization of by-products and factors influencing CP application in the Nile perch processing industries in Kenya. The specific objectives were:-
1. To identify the by-products and factors that influence their utilization in industrial Nile Perch processing.
2. To determine the factors which influence application of Cleaner production practices in the Nile Perch processing industries.
3. To establish the relationship between the quantities of by-products generated and Cleaner Production.
1.5 Research Hypothesis
1. NP processing plants in Kenya do not influence the utilization of by-products 2. Cleaner production practices has not been implemented in NP processing plants 3. There is no significant relationship between utilization of by-products and cleaner
production in NP processing plants in Kenya. 1.6 Significance and anticipated output
7
The study would generate information on the utilization of the by-products and CP which was lacking in most Nile perch processing industries and will be useful to the managers and other stakeholders in the industry. The study will generate information, which may be used by other scholars undertaking similar studies as a source of literature.
1.7 Conceptual Framework
8
Figure 1.1. Conceptual framework
1.7 Limitations of the study
This study was limited to three Nile perch fish processing plants in Homa Bay, Kisumu and Nairobi towns in Kenya due to logistical constraints. Time was of essence to both the respondents who filled the research instruments as well as the researcher. Dependent variables Capacity building Inadequate information
Poor regulatory compliance Over–reliance on one product
Inadequate technology
Creation of awareness
Adoption of regulatory requirements Diversify products by using waste
Adoption of appropriate technologies
Improved waste
management and reduced production Independent
variables
9
CHAPTER TWO: LITERATURE REVIEW 2.1 Introduction of Nile Perch into Lake Victoria
The Lake Victorian Nile Perch (Lates niloticus), a predatory fish in the order Perciformes (“perch like” fishes) and family Centropomidae was introduced in Lake Victoria by British settlers in the late 1950’s. Since the introduction, NP has become a source of food, important export species and source of income for the fishers, processors and exporters of the three countries bordering Lake Victoria, namely Kenya, the United Republic of Tanzania and Uganda.
The NP is carnivorous and feeds on other fish species. It is attributed with causing the extinction or near-extinction of several hundred native species. The explosion of the lake’s NP population in the 1980s was monitored closely, because it coincided both with a fivefold increase in the economic value of the fishery (Reynolds
et al., 1995) and with a halving of the lake’s 500-species Haplochromine cichlid flock
(Ogutu-Ohwayo, 1990). Thus out of a total catch in the Kenyan waters of Lake Victoria of 16,581metric tons in 1975 only 51 metric tons (0.3%) was Nile pecrch.
The introduction of NP into Lake Victoria, while ecologically negative, stimulated the establishment of large fish processing establishments in East Africa. The NP is a fast growing species reaching maturity at the age of three to four years (Ogutu-Ohwayo, 1990), and total length between 50 cm (males) and 84 cm (females). The NP grows to a very large size and a mature NP is over 195 cm long and weighs over 200 Kg. Other commercially important fish species in Lake Victoria include
10
In 1985, the total landings from the three riparian states were 88,582 metric tons with 56% or 50,029 metric tons being NP. The landings of NP in 1987 were estimated at 86,833 metric tons corresponding to 69% of the total catches (Reynolds and Greboval, 1988). It proved to adapt very well to the lake’s conditions. Access to the lake by fishermen was regulated and enforced by local authorities (Abila and Jansen, 1997), as is often the case in communities with local commons or natural resources (Dasgupta, 2002). Since 1999 the fish production in Lake Victoria started declining from 54,689 metric tons for Nile perch (Kenya waters) to 16,312 metric tons in 2003 due to high fishing effort and use of small mesh size gillnets (Ministry of Fisheries Development, 2005).
Most of the fishing in the three countries is undertaken from small canoes, using either paddle or outboard power. Typically fishermen will use drift nets, set overnight, although some fish is also caught with baited longlines. Catch recording is difficult given the disperse nature of the fishery and landings.
11 2.2 Fish processing.
In 2010 fish destined globally for direct human consumption, the most important product form was live, fresh or chilled fish, with a share of 46.9 percent, followed by frozen fish (29.3 percent), prepared or preserved fish (14.0 percent) and cured fish (9.8 percent). Freezing represents the main method of processing fish for human consumption, and it accounted for 55.2 percent of total processed fish for human consumption and 25.3 percent of total fish production in 2010 (FAO, 2012). These general data mask significant differences. The utilization of fish and, more significantly, the processing methods vary according to the continent, region, country and even within countries.
12
oxygenation facilities to keep fish alive during transportation or holding and display. Nevertheless, marketing and transportation of live fish can be challenging as they are often subject to stringent health regulations and quality standards. In some parts of Southeast Asia, their commercialization and trade are not formally regulated but based on tradition. However, in markets such as the European Union, live fish have to comply with requirements, inter alia, concerning animal welfare during transportation.
The development of the fish processing and marketing industry is closely linked to the rapid growth of the Nile perch fishery in the last three decades. A huge demand for Nile perch developed quickly in the industrialized countries during that period. In order to satisfy this market, processing factories were established along the shoreline of Lake Victoria. The first Nile perch processing plants in Kenya were set up in the early and mid 1980s to process Nile perch and export its fillets to markets overseas (Reynolds and Greboval, 1988). They proved to be so profitable that more factories soon were set up in all the three countries. Most of the factories had the technical capacity to process Nile perch that far exceeded the amount of fish they were able to obtain (Jansen, 1996; Abila and Jansen, 1997). The filleting factories around Lake Victoria were, therefore, competing to secure sufficient raw fish.
13
development has changed over the recent past following the stabilization of the Uganda economy.
14
At the Nile perch processing factories, most of which meet standards of design and construction specified in the EU Food Law (Regulation EC/178/2002) and Kenya Standard for fish handling and processing. The food law aims at ensuring a high level of protection of human life and health, taking into accounts the protection of animal health and welfare, plant health and the environment. This integrated "farm to fork" approach is now considered a general principle for EU food safety policy. The fish are chilled and kept in ice until ready for processing (up to one day). The fish are then filleted by hand without gutting, and the fillets then skinned and trimmed. The skinning is usually done by hand. Fillet sizes vary, from 300g to 1500g. Large fillets above 1500g are portioned and are always frozen, since the premium fresh markets do not accept very high oil content. Individual fillets and portions are packed in polythene bags and subjected to blast freezing. If the fish is to be frozen it is packed immediately into waxed cartons of 6kg or 12kg depending on the market and then stored in the Cold stores maintained at temperatures below -18◦C. Some factories have installed plate freezers to achieve a more rapid freezing of fillets. There is some production of headed and gutted fish and steaks, but these form only a small proportion of the total. Frozen fish is transported to Mombasa in refrigerated trucks (including all frozen fish from Uganda and some from Tanzania), and exports by sea are exclusively by container.
15
These are transported to Nairobi in time for late evening flights to Europe. In addition, there are direct charter flights (for example from twice weekly from Mwanza to EU destinations, carrying 50 tons of fish each time). The cost of air freight to the European market is in the range of US$1.50 to 2.0, which is more than recovered in the premium over frozen fish (where the freight cost is in the region of US$0.50). 2.3 By-products generated from NP processing.
In the last three decades, there has been a global trend of growing awareness about the economic, social and environmental aspects of optimal use of fishery by-products, and of the importance of reducing discards and losses in post-harvesting phases (storage, processing and distribution). The utilization of fish by-products has become an important industry in various countries, with a growing focus on handling by products in a controlled, safe and hygienic way (FAO, 2012). Improved processing technologies have also helped in their utilization.
In Kenya, Lake Victoria supports a vibrant NP fish export industry and it is one of the major foreign exchange earners of partner states sharing the Lake (Kenya, Uganda and Tanzania). It is dominated by four main fish species; Nile perch (Lates
niloticus), Nile tilapia, (Oreochromis niloticus), dagaa , (Rastrineobola argentea) and
16
Fish processing industries produce large quantities of by-products and their disposal causes environmental degradation. Some of the by-products are sold in the local and export markets. The fish maws are processed in the factories and exported whereas the large fish frames, “fish chests”, trimmings, roe/eggs and fat pads are sold locally and used as food by the local community. The small fish frames, viscera, skins, fins and liquid stick wastewater are discarded as waste. The yield from Nile perch processing constitutes 42-50% of the fish fillet, Heads 23%, fins and tail 9%, 10% fish frames, 8% of guts (swim bladder and viscera), 3% trimmings, 0.1% roe (eggs), 6.1% skin and 1.8% fat pads . The solid fish waste make up to 30-40% of the total production (Pfeiffer, 2003).
The waste water disposal method is mainly direct discharge of either raw or semi-treated wastewaters into the lakes, channels that empty into the lake or municipal sewer lines. Industrial fish processing generate large amounts of waste or residues of high nutrient content, which if not properly utilized or treated is likely to be deposited in the environment and thus create pollution and human health problem (Gumisiriza et al., 2009 and Kotzamanis et al., 2001). It was estimated that 36,000 metric tons of fish solid waste and 1,838,000 m3 of Nile perch fish processing wastewater was generated from fish processing annually in NP processing plants in East Africa (Gumisiriza et al., 2009).
2.3 Environmental impacts of fish processing plants.
17
2003). One of the NP fish processing contributions to the environmental degradation is mainly through discharge from post harvest fish processing activities. As solid wastes decompose, it releases off odours and the deposits of the solid waste are fertile breeding grounds for flies, cock roaches and vermin. These contribute to the spread of feacal matter in the environment. The wastes contain high nutrient content which if not properly treated contribute to eutrophication of water bodies (Kotzamanis et al., 2001).
The scales produced are semi-recalcitrant and take long to decompose when dumped on the ground or buried (Arvanitoyannis and Kassaveti, 2008). The other contribution to environmental degradation is the disposal of fish solid waste, mainly trimmings and fish frames from fish filleting, discarded fish and fish packaging materials. The solid wastes release off odours as a result of poor handling practices. Solid waste and poorly maintained sanitary facilities are also breeding grounds for flies and rodents, which can contribute to the spread of contaminants to the environment.
2.4 Waste disposal methods used in fish processing.
18
Gumisiriza et al., (2009) cites that despite the attempt by most fish processing industries to treat or utilize their fish wastes, the methods employed are compromised mainly due to the nature of the fish waste itself, limited land and low price when sold to the local market and also that the amount of waste generated depends on the production procedures employed by the processing plants.
Attempts by most fish processing industries to treat or utilize their fish wastes were compromised by the nature of the fish waste itself, limited land and low price when sold to the local market. Many industries which attempt to treat fish processing wastewater in conventional stabilization ponds use small sized ponds for treating fish processing wastewater. This was attributed to the location of these industries in areas with limited land that was insufficient for construction of large sized stabilization ponds (Muyodi et al., 2004).
19
Furthermore, the scales and fats clog and block the screens that resulted into additional cost of employing manual labour to mechanically scoop off these scales and fats. Again, the scales are semi-recalcitrant and took long to decompose once dumped on the ground or buried underground. This poses a big challenge to this disposal method, as it required large tracks of land for sustained fish processing.
Finished and semi-finished samples of Nile perch leather have been produced. The products are attractive and in strength compare favorably with those produced from land animal skin. It was technically feasible to tan Nile perch skin into leather. In Uganda, Uganda Fish Skin Tannery tanned NP fish skins into valuable leather products for local and international markets through an Eco-Benefits programs. This in effect reduced the large quantities of waste generated in form of rejects and increased profits and compliance with the National Environmental Management Authority standards (Uganda Cleaner Production Centre, 2003). However, before an entrepreneur invests in such an activity, it is essential that market demand as well as regularity of supply of adequate and good quality skins to feed the plant be ascertained.
20
2.5 Main environmental concerns for fish processing companies.
Environmental factors in fish processing companies are related to the inputs used for, or in the processing, and by-product which are released into the environment. For fish processing in general, some of the main inputs, in addition to the raw material, are cleaning materials, packaging, water, energy (including hot water), refrigerants and oils.
The main non-product outputs are effluents, in particular, wastewater with potentially high organic content, solid wastes such as scales, skins, waxed cartons, styrofoam boxes, plastics, possible leakage of refrigerants and off-odours from fish spoilage. Fish processing is one of the main sources of industrial sewage water in Iceland, and most wastewater from the industry is discharged untreated to the ocean (OECD, 2001).
The main environmental issue concerns the use of large amounts of fresh water for processing such as washing raw material and products, cleaning of machines, containers and flushing the working floor. Excessive use of water increases the amount of matter being washed out. Thus knowledge of the equipment and the evaluation of water use can lead to great reductions. Waste from fish processing companies seems to be released directly into the sewage system, which then has to be treated and is an expensive problem for the treatment facilities.
21
Bank, 2004). The most important environmental-friendly and profitable options for utilization of fish waste for the recovery of marketable by-products and production of value added products through bioconversions has been recently reviewed by Arvanitoyannis and Kassaveti (2008). These include production of animal feed such as pig and poultry feed, monogastric animal feed supplements, aquaculture feed, fishmeal and oil production, fish silage production, production of renewable energy in form of biodiesel and biogas, composting for production of organic fertilizer, extraction of natural pigments and extraction of novel and industrial enzymes like proteases.
Arvanitoyannis and Kassaveti (2008) reported that fish waste can be disposed by producing biochemical products for use in food, cosmetics and pharmaceutical industries such as collagen, fish protein hydrolysate, fish bone extracts, collagen and polyunsaturated fatty acids. Other options for utilization of fish waste reported by Hwang and Hansen (1998) and Arvanitoyannis and Kassaveti (2008); include production of short-chain organic fatty acids, substrates for microbial culture media, production of attractants for economically important flies of agricultural crops, chromium immobilization and use of fish scales as natural adsorbents and organic wastewater coagulant for sedimentation of small particles.
22
consequences around the world both environmentally and in terms of life consequences.
2.6 Cleaner Production
Cleaner production is a concept that goes beyond simple pollution control. It involves active research and development into new structures, systems, processes, materials and products that are more resource and energy efficient, whilst engaging and empowering people. Such approaches have become necessary for businesses, institutions, governments, and civil society to ensure ecologically, socially, and economically sustainable, consumption production and service strategies. These involve educational, training, management, and technical assistance programs, which are needed to accelerate the adoption of cleaner production and sustainability by industries, governments and universities (Schaltegger, et al., 2003).
23
simply to deal with them afterwards, and to contribute to improved product designs for products which will be more environment-friendly and cost-effective over the whole of their life-cycles. CP’s main objectives are to:
a) Minimize the use, as well as optimize the reuse and recycling, of hazardous and non-hazardous materials
b) Use materials in the manufacturing process in a more efficient way, reducing the amount of inputs needed and the amount of non-desired outputs
c) Minimize risks and improve human capital through worker hygiene and safety programs
24
CHAPTER THREE: STUDY AREA, MATERIALS AND METHODS 3.1 Introduction
This chapter introduces the study area, data collection procedures in the field and the methods used in the analysis of data collected. Ethical issues considered in the field are also given.
3.1.1. Location and Climate of Study Areas
Three processing plants were purposively selected for the study namely W.E Tilley (M) Ltd in Baba Dogo-Nairobi, J. Fish (K) Ltd in Kisumu and Capital Fish (K) Ltd in Homa Bay as depicted in Figure 3.1. The three plants specialized in the processing of NP fillets destined for the export market. W.E Tilley (M) Ltd is located in Baba Dogo; Roysambu District, Nairobi County. Baba Dogo is situated between latitude 1°16.2769"S and 1° 16.4615" S and between longitude 36°48. 4718" E and 36° 48.5998" E and at an altitude of 1,795 m above sea level. Rainfall is bimodal with long rains occurring between March and May while the short rains in October to November with a total annual rainfall of 900 mm. High temperatures are experienced during the day and low temperatures during the night. The months of June and July experience lowest temperatures of 10°C. January and February are the hottest months with an average of 24° C.
25
34° 44"50.38 and 34° 44.83 E. Temperatures vary between 15°C and 32°C with an average temperature of 28°C and humidity of between 26-32% saturation.
26
Capital Fish (K) Ltd is located in Asego District, Homa Bay County. The county lies at a latitude of between 0°31"0 S and 0°37" 41.16" S and longitude of 34°14"51 E and 36°48"59 E at an altitude of 1750 m above sea level. It covers an area of 197 km2 half of which lies within Lake Victoria. The climatic condition was semi-arid with two rainy seasons. The long rains fall between the months of March and May while short rains fall between September and November with an average total precipitation of 1180 mm. Its daily temperature falls between 26°C-28°C. Temperature varies with altitude and proximity to the lake and tends to increase towards the lowland with an average of 17°C to 35°C. High temperatures are recorded between December and March with the highest temperatures experienced in February and the lowest in April and November.
3.1.2 Drainage.
27 3.1.3 Population.
According to 2009 population census Nairobi City had a population of 3.1 million, Kisumu 980,000 and Homa Bay 960,000 (CBS, 2009). Although it covers only 0.1 per cent of Kenya’s total surface area, Nairobi has about eight per cent of the country’s total population. The city’s overall population density is 3,079 people per km2, but this varies significantly from extremely high in the Central and Kibera divisions to very low in the upmarket residential area of Muthaiga in Westlands District. The poorest 60 per cent of Nairobi residents live on only 8.7 per cent of the city’s land base, mostly in informal settlements (ITC, 2004). Nairobi’s early growth was fuelled by rural migrants and an explosion of growth took place between 1979 and 1989 when 772,624 newcomers came to the city (NEMA, 2003). The forces motivating rural-urban migration to Nairobi include better economic prospects, opportunities for higher education and higher wage employment, and the attraction of Nairobi as a market for goods and services.
Located along the shores of Lake Victoria in western Kenya, Kisumu is projected to grow to 1,145,749 by 2017. This growth is largely a result of high fertility, which is currently 4.8 children per woman, compared to a national average of 4.6 children per woman (Kisumu County Government, 2013).
28
among youth. The majority of the population is employed in fishing and agricultural activities, with limited opportunities in commercial ventures and public service (Homa Bay County Government, 2013).
3.1.4 Economic activities.
The economic activities found in all the three study areas were similar, they included commercial, industrial, manufacturing and processing. Other economic activities were small scale retail shops.
Nairobi is the largest city in East and Central Africa and is an important economic hub in regard to transport, manufacturing, services, infrastructure and economic activities. It provides an important link to the Port of Mombasa that is a gateway to the land locked countries of Uganda, Rwanda and Burundi and the Democratic Republic of Congo. It also houses regional and international organizations among them the United Nations Environmental Programme (UNEP).
Kisumu is an important regional town that is endowed with various types of industries among them fish processing, beverage, agro-processing and textile industries. It is connected to other important towns along the shores of Lake Victoria namely Mwanza and Bukoba in Tanzania. Among the most important of these industries is the Nile Perch processing that is the subject of this study. It is well served with a railway line from Nairobi and waterways that serve a high population that resides within the Lake Victoria Basin.
29
farmed include maize, paw paws, groundnuts, cassava and pine apples. Due to its proximity to open waters of Lake Victoria there is evidence of a vibrant fish processing and fish trade within the town and on its outskirts.
3.2 Research design.
The workers in the processing plants and the traders were put into groups according to the duties they perform (receiving, first washing, filleting, skinning, trimming, tumbling, grading, pre-packing, sorting, freezing, storage, dispatch and by-products).The fish traders who purchase processed NP and by-products for the local market were also selected on the same criteria. The study was carried out using a descriptive study design which enabled data to be collected qualitatively through the use of questionnaires on the factors affecting the utilization of by-products and CP in industrial NP processing plants in Kenya.
3.3 Study population.
30 3.4 Target population.
The target population for this study was the management staff, the men and women employed and working within the NP fish processing plants (fish handlers). They were believed to have the necessary information required for the successful completion of this study. Traders who purchased fish and fishery products for domestic market were also included.
3.5 Sampling technique
With the large number of staffs targeted from the three plants, the researcher conducted a sampling to select a representative of these staffs. The sampling technique applied was the purposive sampling method. This is a form of non-probability sampling in which decisions concerning the individuals to be included in the sample are taken by the researcher, based upon a variety of criteria which may include specialist knowledge of the research issue, or capacity and willingness to participate in the research. This was preferred as it allows the researchers taking a decision about the individual participants who would be most likely to contribute appropriate data, both in terms of relevance and depth.
3.6 Sample size determination.
The Fisher’s formula (Mugenda and Mugenda, 1999) was applied in determination of the sample size in this study.
n=Z2pq/d2
Where, n= desired sample size
31
P= proportion of the targeted population that have the characteristic focusing in the study estimated at 90%.
q=1-p
d= degree of accuracy set at 5% / degree proportion of error that should be accepted in the study (0.05) since the study is at 95% confidence level.
Thus Desired Sample (n) = {1.962*(0.90*(1-0.10)}/0.052 n= 139
Since the total population for each region is less than 10,000 the researcher applied finite correction formulae (nf) that is applied together with the Fishers formulae in successive steps as indicated:
nf = n 1+ n/N
32 3.7 Research instruments.
The main research instrument used in this study was the questionnaire. The questionnaire was developed to capture information based on the research objectives. These included both open ended and closed ended questions which facilitated the collection of more detailed information as the respondents were given chance for deeper explanation of their views. The study also employed the use of observation check list. These also were guided by the study objectives.
3.8 Data collection methods.
Data was collected using both secondary and primary sources. Acquisition of secondary information entailed review of documents on NP processing, CP, journals, internet, books and theses which contain relevant information. The primary data were collected mainly through the use of both structured questionnaire and the observation check list. The questionnaire was given to a determined number randomly in each section of the processing plant. A total of 254 respondents were given the questionnaire in three processing plants (Appendix 1 and 3). The respondents included 6 managers, 2 from each processing plant, HACCP team, supervisors, laboratory technicians and fish traders. An observation checklist was used by the researcher to record the processing activities in the three plants (Appendix 2)
3.9 Data analysis.
33
bar graphs. The use of SPSS eased summarizing of the data in descriptive statistics of frequencies and percentages that shows the trends in the collected data. The software was also used to conduct inferential tests in the data collected. Inferential statistics used included correlation, ANOVA and chi-square statistical tests. The tests were conducted at 5% level of significance with a critical value of 0.05. The software was also used to generate figures showing the results. After generation of categories, themes and patterns an analytical and interpretive report giving a descriptive account of the factors affecting the utilization of NP by-products was written. Each of the three hypotheses was tested independently by use of statistical chi-square and the results presented in a table.
3.10 Ethical issues observed during the study.
Consent was sort from the factory management through the Ministry responsible for fisheries in the country. The consent was granted in all the three study areas.
34
CHAPTER FOUR: RESEARCH FINDINGS AND DISCUSSION 4.1 Introduction.
This chapter focuses on the study findings; the demographic parameters of the respective NP processing plant, utilization of by-products, cleaner production, measures for improving cleaner production and effects of improper waste disposal in the different processing plants. Finally, conclusions drawn from the study and recommendation on the way forward are given at the end of the Chapter.
4.2 Demographic Information.
4.2.1 Age of respondents.
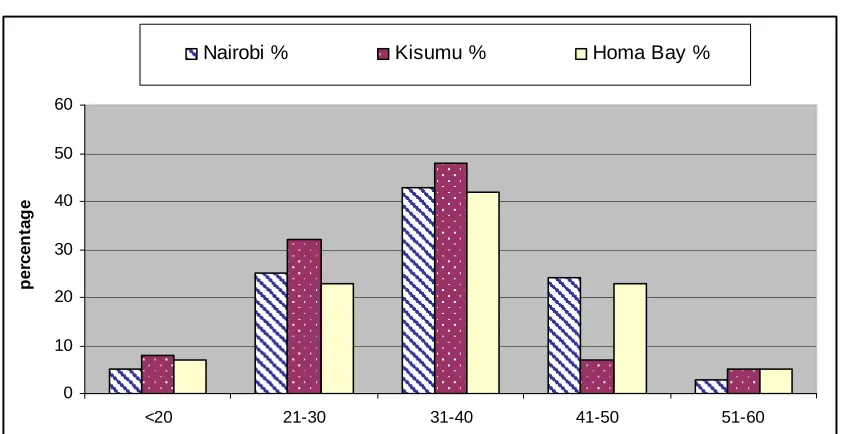
The study results showed variations in the age and gender of the respondents in the NP processing plants. In all the three processing plants, majority of the respondents were in the age group 31-40 years; being 43%, 48% and 42% in Nairobi, Kisumu and Homa Bay respectively while the age group below 20 years and between 51-60 years were the least (Table 1 and Figure 4.1). However, it was noted that Kisumu had a higher proportion of 21-40 years at 75% compared to Homa Bay and Nairobi. This may be as a result of high incidence of rural–urban migration within the region and the concentration of fish processing plants (5) as compared to Homa Bay (1) and Nairobi (1).
35
with the age for economic activity in humans (Akinpelu et al., 2013) meaning that most of the catfish processors were still in their productive age while 9.6% were between the ages of 51 and 60 years.
Table 1. Respondents’ age groups
Age group in years Nairobi Kisumu Homa Bay
<20 4(5) 7(8) 5(7)
21-30 21(25) 30(32) 18(23)
31-40 36(43) 45(48) 32(42)
41-50 20(24) 7(8) 18(23)
51-60 3(3) 5(5) 4(5)
0 10 20 30 40 50 60
<20 21-30 31-40 41-50 51-60
p
e
rc
e
n
ta
g
e
Nairobi % Kisumu % Homa Bay %
36 4.2.2 Gender of the respondents
The study showed that both gender worked in fish processing industries; but the number varied. The male gender was dominant in all three processing industries. In Nairobi fish processing industry, 60% were male while 40% were female. In Kisumu, 76% were male and female were 24% while in Homa Bay, the number of male workers was 68% while 32% were female workers (Figure 4.2).
Most of the work involved off-loading, filleting and lifting equipment which means a lot of physical strength was involved, hence the dominance by the male gender. However it was noted that in certain operations, for instance grading and selection of fillets and pre-packing female workers were predominant. These sections were considered sensitive and required greater attention to details and the female gender was the preferred choice.
In West and Southern Africa, Bene and Heck (2005) noted that women dominated the processing, retailing and local trading since small scale processing and/or trading at local markets required relatively low investments and low operational costs and did not require strong physical strength. It is also required unskilled labor and processing provided opportunities for a large number of women.
37
required manual handling of large and heavy fish. Interviews with employees indicated that men dominated in the unloading of fish, the final product freezing area and the maintenance of machine and skinning of fish, whilst women were dominant in the processing lines. The disparity in age of male and female processors may be due to the household responsibility that is placed upon the female processors than their male counterparts at early stage of life especially as it concerned children upbringing. Other household responsibilities may be expected of the female gender, many of whom fend for the household with little or no assistance from their male spouses.
Figure 4.2. Distribution of respondents’ gender in Nairobi, Kisumu and Homa Bay. Study period (May 2011-February 2012).
4.3 The by-products in NP processing
38
“fish chest”, head, skins and trimmings. Fish maws were processed through the removal of the fish bladder from the freshly dead fish. The fish bladders were washed in cold fresh water and carefully scraped to remove the adhering blood and fat.
The processing of frozen Headless and gutted Nile perch had a final yield of 69% on weight basis and had the least of waste. The guts, swim bladder and viscera constituted 8% whereas the head made up of 23%. However unlike the case of fillets the production of Headless and Gutted NP was based on specific orders from the importers and the quantities could not be pre- determined. Annually this segment contributed 5.03% of the total volume exported in 2011. Skin on filets yield was at an average of 50%, the guts, swim bladder and viscera constituted 8%, the head 23%, fins and tails 9% and the fish frames 10%. Skinless fillets had a yield of 42% of the final product and guts, swim bladder and viscera constituted 8%, head 23%, fins and tail 9% and the fish frames 10%. In regard to waste generation skinless fillets were the major contributor to by products as compared to the other two products. The annual production of fresh, chilled fillets was 29% whereas frozen fillets were 66%. The main market for the frozen fillets was Israel.
39
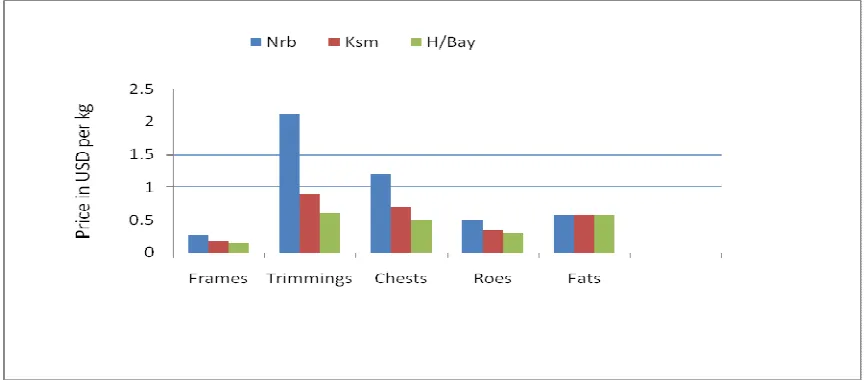
Further, in the Far East, the fish maws are fried in cooking oil and are considered a delicacy. The Chinese use them in soups. The fish frames, chests, trimmings, fat pads and fish roe/eggs were sold into the local market for further processing for human consumption. Most of the by-products are transported from the factory in open pick-ups without ice (Kabehenda 2009b). NP frames were used as food by the local community, to make animal feed and the excess was dumped (Kabehenda et al., 2009a; Gumisiriza et al., 2009). In Nairobi as indicated in Figure 4.3 below the price per kg for fish frames, trimmings, fish chests and roe was USD 0.26, 2.12, 1.2,0.49 and 0.59 respectively whereas in Kisumu fish frames sold at USD 0.18, trimmings USD 0.9, fish chests USD 0.7, and roe USD 0.35. In Homa Bay the price per kg was USD 0.15 for fish frames, trimmings USD 0.6, fish chests USD 0.5 and fish roe USD 0.59. In all the three plants the selling price for fish fats was USD 0.59.
The high prices in Nairobi for all the by-products except fish fats may be as a result of the high population and great demand for low priced protein based products especially in the low income settlements and the transport costs incurred by the traders.
40
Figure 4. 3. Average selling price of by-products in the three NP plants
4.3.1 Factors that affect the utilization of by-products
41
increase production efficiency and profitability and also address concerns on wastes disposal.
A study conducted in India indicated that among factors that affect the utilization of potential by- products in the fisheries processing plants include water availability and allocation, ever-increasing input costs of water and power, high perishability of fish coupled with poor post-harvest handling, quality assurance issues in production, processing and exports, market fluctuations, disaster management, availability of bank credit and insurance, inadequate database and poor linkage in domestic marketing, lack of storage facilities and transportation (DFID, 2003).
42
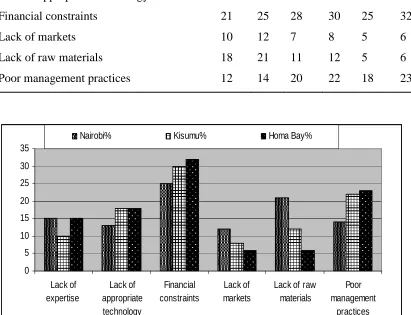
Table 2. Factors affecting the utilization of by-products
Nairobi Kisumu Homa Bay
Factors Affecting Utilization of by-products F % F % F %
Lack of expertise 13 15 9 10 12 15
Lack of appropriate technology 11 13 17 18 14 18
Financial constraints 21 25 28 30 25 32
Lack of markets 10 12 7 8 5 6
Lack of raw materials 18 21 11 12 5 6
Poor management practices 12 14 20 22 18 23
0 5 10 15 20 25 30 35 Lack of expertise Lack of appropriate technology Financial constraints Lack of markets
Lack of raw materials
Poor management
practices
Nairobi% Kisumu% Homa Bay%
Figure 4. 4. Factors affecting utilization of by-products
43
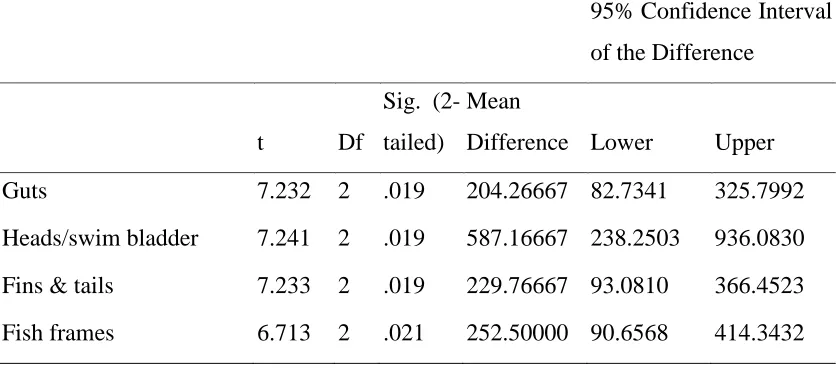
produced 159.2 m. tons of guts, 457.7 m. tons of heads, swim bladder and viscera, 179.1 m. tons of fins and tails and 190.5 m. tons of fish frames. Homa Bay NP plant received the highest amount during the same period at 3,200 m. tons of the raw NP and generated 256.3 m. tons of guts, 736.5 m. tons of heads/swim bladder and viscera, 288.3 m. tons of fins and tails and 320.4 m. tons of fish frames. It was notable that the Homa Bay NP plant had an edge over the other plants possibly because of its location. It sourced the raw NP from the South Nyanza region which was close to its location and in absence of any other factory in the sub-region it was possible that the level of competition from other factories was low. These were tested for difference between means for the three plants as table 3 below shows. From the table, there is a statistical evidence of a significant difference between means of the waste produced in the three NP plants. This is as given by the significance values for the different waste types which are all less than 0.025, the critical value at 5% level in a 2-tailed test.
Table 3. Test of Mean Differences for the Waste in the Three Plants
95% Confidence Interval of the Difference
t Df
Sig. (2-tailed)
Mean
Difference Lower Upper
Guts 7.232 2 .019 204.26667 82.7341 325.7992
44
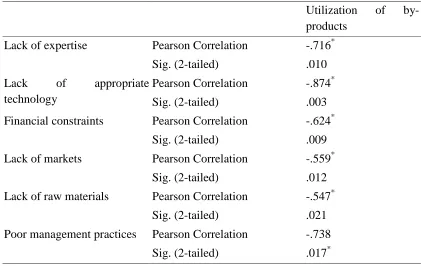
4.3.2 Association between identified factors and utilization of by-products
Testing the association between the factors identified and their influence on utilization of by-products, the Pearson correlation test was conducted at 5% level with a 2-tailed test. All the factors identified showed a negative association with utilization of by-products as shown in the table 4 below. These were also found to have a statistically significant association as given by their p-values that are all less than 0.025 at 5% level. This therefore shows that there is statistically significant association between these factors and the extent of utilization of the by-products.
Table 4. Association between factors identified and by-product utilization
Utilization of by-products
Lack of expertise Pearson Correlation -.716*
Sig. (2-tailed) .010
Lack of appropriate technology
Pearson Correlation -.874*
Sig. (2-tailed) .003
Financial constraints Pearson Correlation -.624*
Sig. (2-tailed) .009
Lack of markets Pearson Correlation -.559*
Sig. (2-tailed) .012
Lack of raw materials Pearson Correlation -.547*
Sig. (2-tailed) .021
Poor management practices Pearson Correlation -.738
Sig. (2-tailed) .017*
45
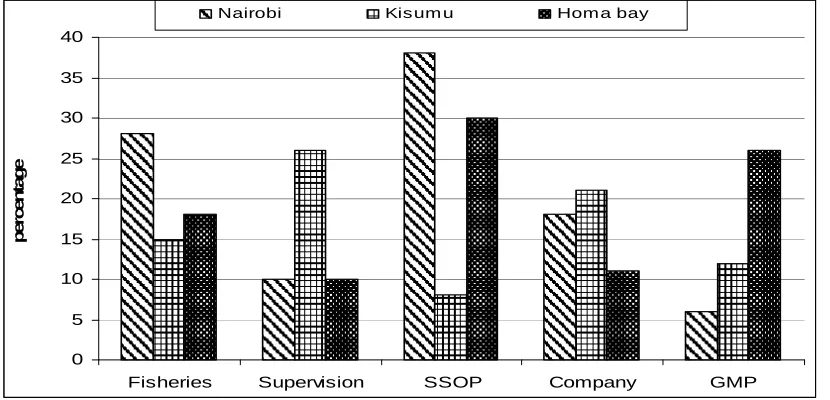
4.4 Cleaner production in NP processing plants in Kenya
In all the three establishments all the respondents; 100% indicated that CP measures were in place. However there were variations in regard to the measures that contributed towards effective cleaner production as shown in Figure 4.5. Amongst the reasons cited were the Fisheries regulation, Supervision, Sanitation Standard Operating Procedures (SSOP) and the Company Policy.
46
Hazard Analysis Critical Control Point (HACCP) is a system that identifies, evaluates and controls hazards that are significant for food safety. HACCP is internationally accepted for the production of safe food. The system requires a HACCP team approach and full commitment of management and employees. It is a dynamic system that can adjust to new knowledge and experience. The system is built onto GMP and GHP which are pre-requisite programs in the implementation of a HACCP food safety system.
Pre-requisite programs are basic conditions and activities that are necessary to maintain a hygiene environment throughout the food chain suitable for the production and provision of safe end products and safe for human consumption (FAO, 2009). HACCP has become a widely used tool for managing food safety throughout the world. It is an approach based on preventing microbiological, chemical and physical hazards in food production processes by anticipating and preventing problems, rather than relying on inspection of the finished product. Cleaner Production should operate in partnership with quality and safety systems and should never be allowed to compromise them. As well, quality, safety and Cleaner Production systems can work synergistically to identify areas for improvement.
47
environment which entailed treatment and disposal of the subsequent substance that had been captured.
These methods often lead to added costs, and the perception that environmental protection is necessarily costly. ‘End of pipe’ methods also have in common that they treat waste without considering its source, better housekeeping and operational methods, process technology and internal reuse, investment in technology, environmental management systems and recycling, (Rodhe, 2000).
0 5 10 15 20 25 30 35 40
Fisheries Supervision SSOP Company GMP
p
e
rc
e
n
ta
g
e
Nairobi Kis um u Hom a bay
Figure 4.5. Internal regulation governing CP
4.4.1 Factors Affecting CP.
48
4.4.1.1 Lack of appropriate technology, expertise and poor management practices
In Nairobi NP processing plant, the study found out that there were factors cited as affecting CP within the plant which included lack of appropriate technology 35% (29), lack of expertise 26% (22), poor management practices was cited by 33% (28) and 6% (5) indicated that no factors affected CP.
In Kisumu, lack of appropriate technology was cited by 27% (25), lack of expertise 34% (31), poor management practices 35% (33), while the remaining 5% (5), said that there were no factors affecting CP in the plant. Homa Bay fish processing plant also indicated lack of appropriate technology as 31% (24), lack of expertise 38% (29), poor management practices 25% (20), were affecting cleaner production while the remaining 5% (4), said that there were no factors affecting CP in the plant as results in Table 5 and Figure 4.6 indicate.
49 Table 5. Factors Affecting CP
Nairobi Kisumu Homa Bay
F % f % F %
Lack of appropriate technology 29 35 25 27 24 31
Lack of expertise 22 26 31 33 29 38
Poor management practices 28 33 33 35 20 26
None 5 6 5 5 4 5
Total 84 100 93 100 77 100
0 5 10 15 20 25 30 35 40
Lack of appr. Techn Lack of expertise poor mngt practices no factors
Nairobi %
Kisumu %
Homa Bay %
Figure 4. 6 Factors affecting CP in Nairobi, Kisumu and Homa Bay
4.4.1.2 Packaging materials
50
polythene sheets for lining the boxes, polythene bags for bagging fish fillets, styrofoam boxes for fresh chilled products, plastic tapes and strappings.
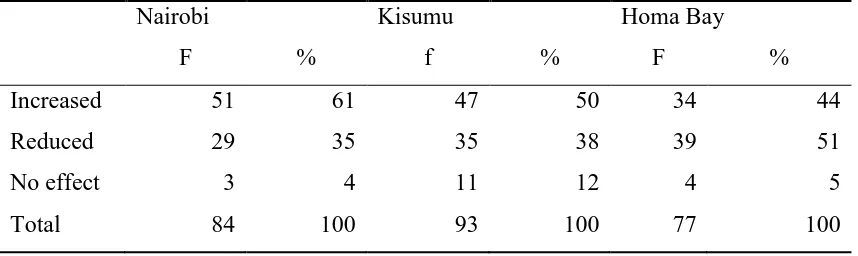
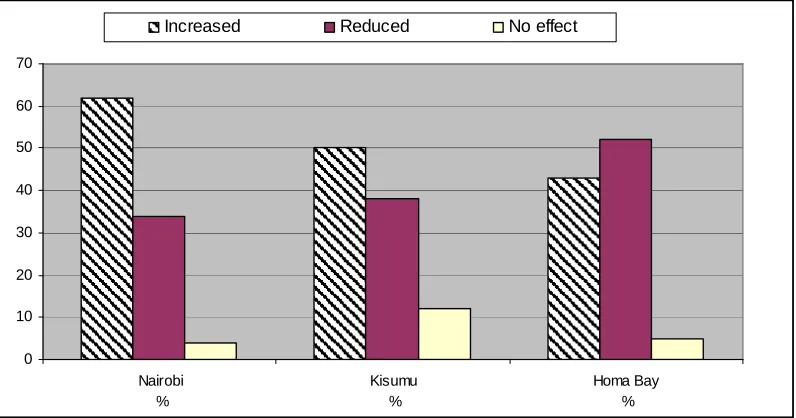
Upon confirmation by the buyers of the final product, a fresh packaging in waxed cartons was essential for frozen products to comply with the customer specifications and requirements for labeling. The respondents indicated that packaging increased waste generation at 61% (51), 50% (47) and 44% (34) in Nairobi, Kisumu and Homa Bay respectively.
A majority of the respondents indicated that packaging reduces waste generated 35% (29) in Nairobi, 38% (35) in Kisumu and 51% (39) in Homa Bay. The remaining, indicated that it had no effect on CP 4% (3) in Nairobi, 12% (11) in Kisumu and 5% (4) in Homa Bay as shown in table 6 and Figure 4.7.
These observations agree with those of Stefán (2003) in Iceland that showed that CP led to the reduction of waste generated and deposited to the environment by the fish processing plants in Iceland.
Table 6. Effect of Packaging on Waste Management
Nairobi Kisumu Homa Bay
F % f % F %
Increased 51 61 47 50 34 44
Reduced 29 35 35 38 39 51
No effect 3 4 11 12 4 5
51
0 10 20 30 40 50 60 70
Nairobi %
Kisumu %
Homa Bay %
Increased Reduced No effect
Figure 4.7. Impacts of packaging material on CP
4.4.1.3 Water usage
Water usage was found to affect CP in the fish processing plants as in Nairobi, Kisumu and Homa Bay. The respondents observed that water usage improved the hygienic status of the products with 69% (58) in Nairobi, 79% (73) in Kisumu and 80% (62) in Homa Bay. The 21% (18), 12% (11) and 15% (12) said that it increased the volume of waste dumped into the environment in Nairobi Kisumu and Homa Bay respectively. The remaining 10% (8) noted reduced volume of waste in Nairobi, 9% (8) in Kisumu and 5% (4) in Homa Bay as indicated in table 7 and Figure 4.8 below.
52
as both the benefits of hygienic products are stressed in these studies as well as the potential of increasing waste generated due to water use. Water as a finite environmental resource is particularly prone to overuse and the abstraction from natural water sources often imposes environmental costs over and above those borne by those responsible for such abstraction. The need to conserve water constitutes a rationale for governmental regulation of water systems and providers to facilitate the internalization of the costs of water utilization thereby facilitating its sustainability, Budds and McGranaham (2003).
Table 7. Effects of water usage on CP
Nairobi Kisumu Homa Bay
F % F % F %
Improved hygiene 58 69 73 79 62 80
Increased waste volume 18 21 11 12 12 15
Reduced waste volume 8 10 8 9 4 5
53
0 10 20 30 40 50 60 70 80 90
Nairobi %
Kisumu %
Homa Bay %
Improved hygiene Increased vol. of waste Reduced vol. of waste
Figure 4. 8 Effects of water usage on CP
4.5 Housekeeping measures
Improving CP entailed the use of several measures. In Nairobi, Kisumu and Homa bay NP plants 8% (7), 3% (3) and 12% (9) of the respondents respectively indicated the use of controlling the valves. Use of foot operated taps was cited by 30% (25), 10% (9) and 32% (25) of the respondents in Nairobi, Kisumu and Homa Bay respectively. Foot operated taps were a pre-requisite in food safety system since they discouraged the use of hand operated taps which could lead to contamination of the final product from the contacts of fish handlers’ nostrils and hands.
54
Nairobi use of meter records was cited by 10% (8), supervision 14% (12) as well as the use of low pressure taps 8% (7) while Kisumu showed meter records 27% (25), supervision 31% (29) as well as the use of low pressure taps 10% (9). The use of meters on high equipment was important in monitoring consumption.
In Homa Bay, NP processing plant, meter records indicated 7% (5), supervision 5% (4) as well as the use of low pressure taps 8% (6) as shown in Table 7 and Figure 4.9 below. These measures agree and differ from others being used around the world to reduce water usage. Measures that could be used to control water usage include; management understanding, interest and support, installation of modern equipment and piping to reduce loss of product and maximize recovery of by-products, appointment of wastewater supervisor, employee training, accurate records of water use and waste, scheduling to reduce water use and waste, proper cleaning procedures, wastewater monitoring, planned maintenance program to reduce losses and waste, planned quality control program to reduce losses and waste, planning systems for wasted product and byproducts and development of alternatives for wasted product recovery (Beaufort Fisheries Incorporated,1986). However, the Kenya’s National Environmental Management Authority (NEMA) standards do not recognize wastewater reuse as a possibility (Kaluli, et al .2011)
55
use of water, installing fixtures that restricted or controlled the flow of water for manual cleaning processes.
Using high pressures rather than high volumes for cleaning surfaces, using compressed air instead of water where appropriate, installing meters on high use equipment to monitor consumption, using closed circuit cooling systems, pre-soaking floors and equipment to loosen dirt before the final clean, re-circulating water used in non-critical applications as well as reporting and fixing leaks promptly.
In Nairobi, Kisumu and Homa Bay NP processing plants, the study found out that over a period of five years the fish processing plants produced varying amounts of wastewater per ton of raw material received as illustrated Figure 4.10. The plant in Kisumu recorded the least amount whereas the Homa Bay plant recorded the highest amount. It was noted that the plants in Kisumu and Nairobi were ISO 22000 certified on HACCP whereas the plant in Homa Bay had not commenced the certification process. Additionally the plant in Homa Bay was located adjacent to the shores of Lake Victoria and the source had a higher water treatment and storage capacities than the other two plants.
56
type of processing, the level of automation and the ease with which equipment can be cleaned, as well as operator practices.
In Denmark typical figures for fresh water consumption per ton of fish intake were 5–11 m3 for fish filleting, 15 m3 for canning, 0.5 m3 for fish meal and oil production whereas fish meal and oil production also consumed about 20 m3 of seawater per ton of fish intake (UNEP, 2004). The figures reported in this study were are quite high and may be as a result of the lack of adequate facilities and poor sanitary standards at the fish landing sites along the entire shores of Lake Victoria that compel the NP plants to invest heavily on in-house water extraction and treatment works so as to comply with the stringent food safety requirements at the international markets especially the EU.
Table 8. Measures used to improve effective water use in CP
Nairobi Kisumu Homa Bay
F % f % F %
Controlling the valves 7 8 3 3 9 12
foot operated taps 25 30 9 10 25 32
High pressure pipes 4 5 8 9 15 19
Tanks and bins 24 28 9 10 13 17
Meter records 8 10 25 27 5 7
Supervision 12 14 29 31 4 5
57 0 5 10 15 20 25 30 35 Controlling valves Foot operable taps High pressure pipes
Use of water bins
Meter records
Supervision Use of low
pressure taps p e rc e n ta g e Nairobi % Kisumu % Homa Bay %
Figure 4. 9 Measures used to improve effective water use in CP.