MATTHEWS, BRIAN. The Effects of Direct and Problem-based Learning Instruction in an Undergraduate Introductory Engineering Graphics Course. (Under the direction of Dr. V. William Deluca and Dr. Eric N. Wiebe.)
In this study, the researcher examined the effects of problem-based learning and compared any statistical gain in knowledge, skill, and attitude to traditional teaching of engineering graphics. Problem-based learning was hypothesized to have a positive effect on knowledge, skills, and attitude of students in a traditional engineering graphics course.
The study sample was forty-eight (N = 48) students in a Foundation of
Graphics course at North Carolina State University. The quasi-experimental study involved a pre-test / post-test control group, using a single control and single treatment group consisting of 24 persons per group.
The independent variable was pedagogical strategy, and the dependent variables of knowledge pre-test and knowledge post-test measured graphic content
knowledge, allowing for direct gain comparisons of engineering graphics to the control and treatment groups. Other dependent variables comprised a CAD skill evaluation that measured students’ skill in creating a three-dimensional CAD model and an attitude survey (MSLQ) to compare attitude associated with traditional versus problem-based learning. The pedagogical PBL treatment was a series of 20 in-class exercises, where students worked in small groups to complete small-problem scenarios, including reverse engineering of parts.
traditional-investigated if any significant difference or gain (p < 0.5) existed between groups and was used to determine gain between dependent variables.
The means on the pre- and post-tests measured if the two groups were significantly different in their prior knowledge and skill. The comparison of means and ANOVA of the MSLQ survey score revealed no significant differences in attitude. The result of hypothesis #1 (knowledge), F(19, 23) = 2.12, p = 0.24, indicated no significant gain. The result of hypothesis #2 (skill), F(1, 23) = 0.03, p = 0.85, indicated no significant difference, and the result of hypothesis #3 (attitude), F(21, 527) = 1.57, p = 0.50, indicated no significant difference. Further studies were recommended using similar or other variables to determine if more benefits can be attributed to problem-based learning when teaching engineering
BIOGRAPHY
Brian Matthews was born and raised in Thornton, England, a small West Yorkshire village on the edge of the Yorkshire Dales. He graduated from Great Horton High School in 1962. To gain professional qualifications in Construction, Architecture, and Education, he attended Bradford, Liverpool, and Manchester universities over the next 10 years, and was also employed in various design / build companies to help pay his way through college.
After graduating from Manchester with post-graduate honors and a Lectureship in Higher Education in 1973, he worked as a Lecturer and Overseas Officer for the British Overseas Development Ministry setting up new colleges in Guernsey, Channel Islands, Antigua, West Indies, and Lae, Papua New Guinea. He taught architecture, construction, management, and graphics at the college level, returning in between tours to teach at Leeds College and Leeds Polytechnic / University before moving to the USA.
He moved permanently to Raleigh in 1986 where he met his American wife, Etta. From 1986 to 1998, he was Architectural Department head at Wake Technical College, Raleigh, and head of the AutoCAD Training Center. As an AutoCAD expert, he also taught at North Carolina State University as adjunct faculty in the Extension service. In 1998 he joined NC State as a Lecturer in the Graphic Communications Program.
ACKNOWLEDGMENTS
This would not have been possible without help from many people, especially the members of my advisory committee, Dr. Eric N. Wiebe, Dr. V. William Deluca, Dr. Theodore J. Branoff, and Dr. Brad Mechlenbacher. Without whose guidance, and support, this degree would not have been attainable.
To my colleagues in the Graphic Communications Program and Technology
Education, Dr. Alice Scales, Dr. John Crow, Mr. John Freeman, Mr. Walt Kelly, Dr. Aaron Clark, Dr. James Haynie, Dr. Robert Wenig, Dr. Richard Peterson, and Dr. William Waters, for their advice and constant encouragement. Also, to Dr. Nathan W. Hartman for allowing me to use his class as a control group, and to my Doctoral colleagues Mr. Bill Hart and Mr. Richard Totten for their assistance in evaluating the pre- and post-tests.
To my colleague Dr. Ann Lambros for her enthusiasm, support and training in Problem-based Learning at the Bowman Gray School of Medicine, Wake Forest University.
TABLE OF CONTENTS
Page
LIST OF TABLES... vii
LIST OF FIGURES ... viii
CHAPTER ONE INTRODUCTION ... 1
Need for the Study ... 3
Problem-based Learning and Engineering Graphics ... 6
Statement of the Problem... 11
Principle Research Questions ... 11
Hypothesis Statements... 12
Assumptions of the Study ... 12
Limitations of the Study ... 13
Summary... 14
CHAPTER TWO LITERATURE REVIEW ... 16
Introduction... 17
Defining Problem-based Learning... 17
Historic Development of Problem-based Learning ... 18
Group Dynamics, Social Attitudes, and Facilitation of PBL... 20
Challenges and Concerns for Implementing PBL in Engineering Education... 23
Problem-based Learning in Engineering ... 25
Historic Development of Engineering Graphics... 28
Important Discoveries in Engineering Graphics... 28
Instrumentation Technology in Engineering Graphics ... 32
Hand Tools... 32
Computers ... 33
Basic Knowledge and Its Retention in Engineering Graphics... 35
Visualization Research in Engineering... 38
CHAPTER THREE
METHODOLOGY ... 42
Major Research Questions ... 43
Subjects and Demographics... 43
Research Design of the Study and Sampling... 44
Procedure ... 46
Control Group Procedure... 47
Treatment Group Procedure... 48
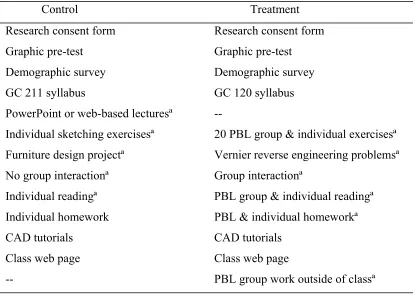
Control Group and Treatment Group Summary ... 51
Differences in Pedagogical Method... 53
Differences in Pedagogical Activities and Materials... 55
Sketching differences between control and treatment groups ... 55
Geometry and CAD differences between control and treatment groups .... 56
Section differences between control and treatment groups ... 59
Summary of Pedagogical Differences ... 61
Pilot Study... 63
Instrumentation ... 64
Knowledge Pre- and Post-test... 67
Skill Performance Test... 69
MSLQ Attitude Survey... 69
Data Analysis ... 71
CHAPTER FOUR FINDINGS... 73
Description of the Study ... 73
Analysis of Demographic Data... 74
Subject Gender and Academic Levels ... 74
Prior Graphics and Work Experience ... 75
Age of Subjects... 76
Majors of Subjects ... 77
Analysis of Research Questions and Hypotheses ... 78
Null Hypothesis #1—Knowledge Gain ... 78
Hypothesis #1b—Pre-test to Pre-test... 80
Null Hypothesis #2—Skill Performance ... 82
Null Hypothesis #3—Group Attitude ... 83
Subscale 1—Intrinsic Goal Orientation... 87
Subscale 2—Extrinsic Goal Orientation... 87
Subscale 3—Task Value Component ... 87
Subscale 5—Self-efficacy and Learning Performance ... 88
MSLQ Summary for Subscales 1, 2, 3, and 5... 88
CHAPTER FIVE
SUMMARY, CONCLUSIONS, RECOMMENDATIONS ... 90
Research Questions... 90
Analysis of Research Questions and Hypotheses ... 90
Hypothesis #1... 91
Hypothesis #2... 94
Hypothesis #3... 98
Summary ... 101
Recommendations for Further Research... 104
REFERENCES ... 108
APPENDICES ... 120
Appendix A. Informed Consent Form ... 121
Appendix B. Pretests... 123
Appendix C. Weekly Exercise Problems... 126
Appendix D. Skill Test and Post Test... 162
Appendix E. MSLQ and Demographic Information Questionnaire ... 166
Appendix F. Class Rubrics and Forms ... 170
Appendix G. GC120 Course Syllabus ... 178
LIST OF TABLES
Page Chapter III
1. Quasi-experimental Research Design ... 46
2. Control and Treatment Group Pedagogy ... 50
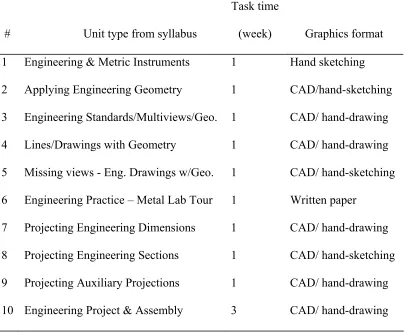
3. Project and Problem-based Learning Activity Design Summary ... 52
4. Treatment and Control Analysis Design... 66
5. MSLQ Subscales, Item, and Reliability Alpha Coefficients ... 70
Chapter IV 1. Gender and Academic Level of Subjects in Study Sample ... 74
2. Subjects with Previous Graphics and Work Experience... 76
4. Academic Majors in Study Sample... 77
5. Comparisons of Pre- to Post-Test Mean Scores by Group ... 79
6. ANOVA of Knowledge Gain Score ... 80
7. Comparison of Knowledge Achievement Scores for Pre-tests by Group... 81
8. ANOVA Results for Pre-tests... 81
9. Comparison of CAD Skill Scores by Group... 82
10. Analysis of Variance for CAD Skill Scores ... 83
11. Comparison of Scores for MSLQ Subscales by Group ... 84
LIST OF FIGURES
Page METHODOLOGY
1. A treatment group orthographic sketching example... 55
2. Two examples from a control group pictorial sketching exercise ... 56
3. A control group 2-D CAD geometry exercise ... 57
4. Treatment group 2-D and 3-D CAD geometry problem... 57
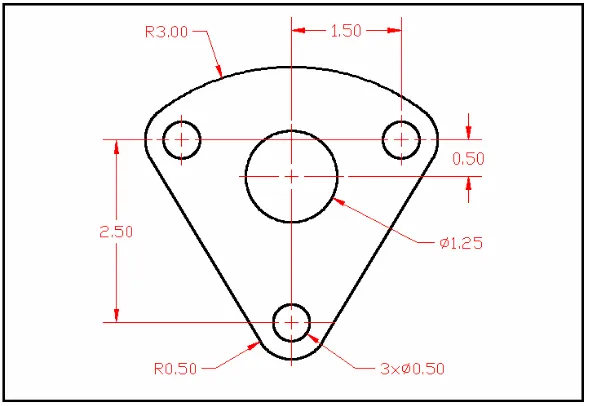
5. Treatment group 2-D and 3-D CAD geometry and ANSI problem... 59
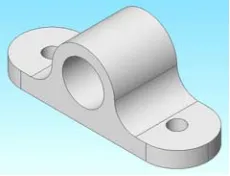
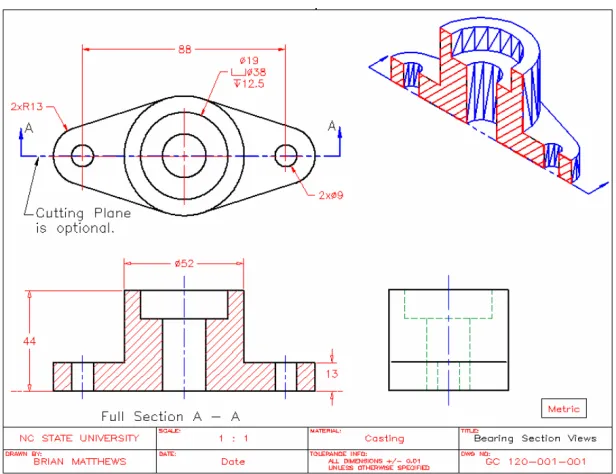
6. Control group bearing block for 2-D and 3-D CAD geometry... 59
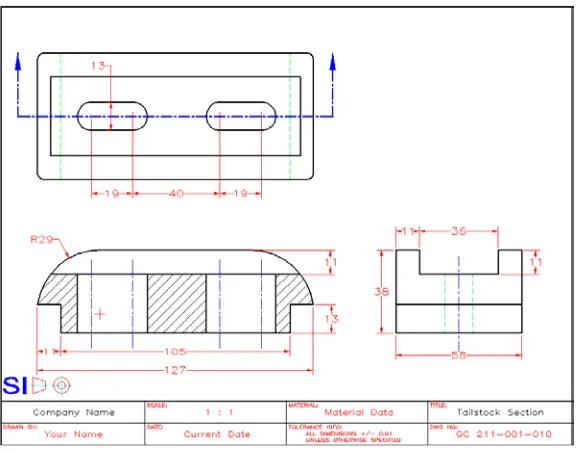
7. Control group Tailstock drawing to create a full section... 60
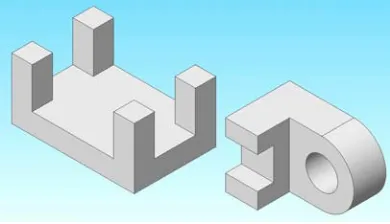
8. Treatment group full section of Bearing drawing... 61
9. Graphic pre-test... 67
INTRODUCTION
This study used a teaching pedagogy of problem-based learning (PBL) to compare any significant changes in knowledge, skills, and attitude to the traditional teaching of engineering graphics. Although PBL is generally believed to better prepare students for learning and groupwork, it has yet to be fully embraced throughout our educational system. Yet, traditional engineering graphics, with its roots firmly embedded in the Industrial Revolution and the 1795 projection methods of Gaspard Monge, still leans on the
transmission of knowledge to the solution of an ill-structured problem, the content of which is centered about a set of structured objectives. In turn, these objectives are coupled to standard techniques and solutions and are taught as theoretical, practical, and graphic topics, which are often followed by preformatted homework exercises or tutorials (Belhot, Guerra, & Kuri, 1998).
This instructor-centered ceteris paribus approach to finding solutions for engineering problems is important for uniformity and stability in traditional instruction, especially while engineering graphics as a profession is undergoing change, a change where the essential skill for an engineer is the ability to communicate clear design ideas via freehand sketching or engineering drawing documentation to find creative graphics solutions through visualization. Raudebaugh (1996) indicated that engineers are no longer required to create finished
technology, a tool that single-handedly transformed 2-D engineering board work into 3-D computer-aided design (CAD). Similar changes were proposed in North Carolina State University Graphic Communications Department staff meetings and recent professional engineering design graphics conferences (Clark & Scales, 1999; Meyer & Booker, 1991).
The literature implied an overall need that graduates of engineering are and want to be creative, and the engineering industry wants thinkers and problem-solvers, so likewise we should use education techniques that foster creativity in students (Kellar & Kellogg, 2000). One solution may be through teaching that allows students to solve problems creatively through an active-learning approach, termed problem-based learning or (PBL) for short. Regarded as an active-learning inquiry method, PBL is based on the principle of using problems as a starting point for the acquisition and integration of new knowledge.
Techniques such as problem-based learning can instill skills, attitudes, and experiences to enrich engineering to include greater understanding of visualization, problem solving,
sketching, and 3-D modeling. It is a process by which a group of students actively engages in learning and contributes, as opposed to sitting passively in a lecture hall, listening to, and memorizing facts (Silberman, 1996).
problem solvers” (p. 51). To do this, we must use innovative and creative ways to teach the process and not teach in a vacuum but provide an eloquent variance from traditional
education and re-anchor the accountability and responsibility students are given for their own learning in engineering graphics through student-centered learning of problem-based learning (Johnson, 1991).
Need for the Study
In order for engineers to retain a competitive edge, they need to be provided with up-to-date knowledge and skills, the ability to problem solve and visualize from 2-D to 3-D and vice-versa, and the attitude to adapt to change. Consequently, engineering graphics education is undergoing change, and the literature suggests those engineering skills, attitudes, and experiences enrich the engineering experience to include greater understanding of
visualization, problem solving, sketching, and three-dimensional modeling. The professional organizations and literature (Johnson, 1992; Woods, 1996b) suggest we produce workers who are creative problem solvers and we use innovative methods, such as PBL, to allow engineering students to develop problem-solving and teaming skills for open-ended design and graphic solutions.
there is little information on the use and application of problem-based learning methods to engineering studies. There is even less information on the scholarly application of this method to real-life problems in engineering graphics and its use as a visualization tool.
Aside from the industrial and educational need for change, the literature indicates many critical engineering reports and engineering professionals who seek active change in engineering education. One of the latest to emerge is Engineering Criteria 2000 (EC2000), which focuses on outcomes assessment for demonstrating program success, and is endorsed by the Accreditation Board for Engineering and Technology. The EC2000 document
attempts to encourage accountability and continuous improvement in engineering education, to which many 2- and 4-year schools already seek active change in engineering studies, especially since the mid 1950s when Dr. Grinter of VPI chaired the 44-member American Society for Engineering Education (ASEE) committee that produced the Grinter Report (ASEE, 1955/1994), to become the essential blueprint for engineering science revolution in USA.
impact” ( p. 75). The report was intended to address immediate concerns and have a short-term impact on the engineering profession, and the report did initially suggest sweeping changes in the engineering curriculum to include problem-solving, active-learning, and visualization techniques. It also promoted engineering education to establish the foundation of successful practice, effective teaching, and relevant research in engineering design. Later, the National Research Council (1991) in its Improving Engineering Design report also mirrored this change.
Furthermore, to improve engineering education, the National Science Foundation (NSF), the Carl Perkins Act, and the Accreditation Board for Engineering and Technology (ABET) have also approved the revision of engineering programs by funding educational grants for creative problem solving, engineering design, or applied design education or curricula. Some results of this type of work are outlined by Barr and Juric (1990), Kenley (1995), and Miller and Bertoline (1991a). Consequently, EC 2000 is just one of the latest recommendations to emerge in a long list of ongoing engineering education improvements seeking active change in engineering education.
teachers and North Carolina high-school teachers and college instructors and with problem-based learning classroom skills. In the PBL workshops, teachers were taught facilitation skills, case study creation, and PBL assessment and rubrics. As new facilitators, they were taught to relinquish control while maintaining the quality and integrity of the learning environment. To model characteristics of lifelong learners, they were taught that helping students find solutions are the keys not the right answers. The process of learning this facilitation skill enabled teachers to empower students with ownership of learning, so there would be no more “guess what I’m thinking in class.” Teachers were taught to encourage different pathways for different students and to allow them to seek answers.
Teachers were encouraged to use prompt-style questions and suggestions in order to facilitate but not direct the class, which included: What would be helpful to do now? Is that a learning issue? How do you know that? What does that have to do with the problem? Does everyone agree with that statement? To sum up, the professional organizations and literature suggest we must produce innovative workers who are creative problem solvers and use innovative methods, such as problem-based learning, to allow engineering students to fully develop their problem-solving and teaming skills and be more creative with open-ended design and graphic solutions. Most engineering problem solving is accomplished via team and groupwork, so why not use a problem-based education approach?
Problem-based Learning and Engineering Graphics
The reasons that prompt the use of problem-based learning in engineering graphics are (a) cognitive, (b) motivational, and (c) functional. Cognitive reasons deal with
learning may be effective in the short term for routine tasks and tests but is ineffective for deeper understanding and retention of complex problem solving (Cognition and Technology Group at Vanderbilt [CTGV], 1992a, 1999b). Likewise in cognitive research, students have what is termed inert knowledge, which in traditional learning problems is used very little from the narrowness of use, but which in problem-based learning is used more fully.
Cognitive research indicates that a learner has to interact with ideas in context to make sense of a problem or task. It is through thinking processes and internal dialogue or interaction with others, we achieve deep comprehension for text, graphical, and problem-solving-based activities (CTGV, 1992). Students identify, analyze, and resolve problems using inert knowledge from previous experience and courses rather than from simple recall (Jones, Rasmussen, & Moffitt, 1997).
Motivational reasons deal with incentives and attitudes and how students focus on the problem, issues, questions raised, and the teacher’s assessment, nurturing, and support. Attitudes are difficult to gauge, but, if measured with care, they indicate that specific support can create a more positive attitude toward a given issue than when not supported. Lambros (2000) pointed out that PBL goes beyond this, with group dynamic elements as a social and intrapersonal side to learning. Although attitude studies are often associated with change and like or dislike, her text indicated many traditional education students move up through an academic climate of competition where success is grounded in how clearly they set themselves apart from the rest of the group and where students’ attitudes and their
their acceptance as part of a group plays a pivotal part in their own progress and the progress of other members of that group. Lambros (2000) indicated it is this attitude in accepting other members of a group within PBL, one where students have to take the weaknesses with the strengths, that students are likely to become much more aware of their own strengths and their own weaknesses (Lambros, 2000).
Functional reasons deal with how closely the problem is aligned to the needs of the 21st century and simulates a real-world concept or helps prepare students toward technology, communication, and presentation skills arising out of the problem. Yet Bridges and Hallinger (1992) indicated that, to achieve success on a test in traditional education, students seek a right answer because their performance is measured on content-specific tasks, whereas in PBL faculty discourage one right answer and instead help students learn how to frame questions, formulate problems, explore alternatives, and make effective decisions.
hands-on skill, or an experience we can base on fact, we have better recall and can use it to our advantage to process a new problem.
Applying this to engineering graphics, comprehension, and learning can be achieved by connecting problem-based learning via graphical problem solving using visualization and other techniques. To illustrate, in graphics study we can create visuals as sketches, drawings, concept ideas, charts, diagrams, clusters, or chunks of information so space in short-term memory does not impede a problem-solving process. Cognitive psychologists agree that, for information to be retained in long-term memory, learners must construct a memory link between the new information and some inert-related information already stored in long-term memory (Gagné, 1985). Thus, sketching and drawing 2-D and 3-D visual images adds short-term ideas to our long-short-term memory to produce new internal memory visualizations.
The visualization research of Kosslyn (2000) indicated that the brain lets us work visual processes in problem solving, allowing the formation of mental imagery, and through the use of our visual perception to work through visual problems.
Thus the main rationale for using visualization in engineering graphics is that it connects visual thinking in a number of ways. It allows us to process and retain form for creative ideas in problem solving, to connect spatial concepts of 2-D to 3-D solutions, and, as solutions are sketched to design problems, it allows the geometric breakdown into three-dimensional modeling procedures and its subsequent modeling in engineering graphics.
to and form images from two- and three-dimensional worlds. Bertoline and Wiebe (2002) indicated that visualization “allows us to document completed designs, to create problem solving ideation sketches, . . . to understand a 3-D object as it exists, and to visualize the 3-D object into future possibilities” (p. 188).
Additional evidence of visualization connecting visual thinking, according to Raudebaugh (1998), is that visualization has to be some form of problem-solving process. “The use of orthographic projection as a traditional drafting method is not effective in teaching visualization skills” (Raudebaugh, p. 5). The final proof is provided by Lajoie (2000) who argued that, because a brain has no visual outlet or monitor, we use graphic communication as a tool, and visual images, sketching, and graphics all have a commonality as a communication device. They convey design ideas or design intent to a colleague, a client, or end user of a product, so that graphic communication is merely a visual tool or visualization process by which we explain how something will function or will be machined or created (Lajoie, 2000).
To apply this concept to engineering graphics, we can connect the visualization process to the flow of ideas as ideation, communication, and documentation and produce two-dimensional sketches of a three-dimensional model to eventually produce working, final assembly or toleranced drawings. For example, an engineering graphics PBL question might connect ideation and communication to a scenario where a single rough dimensioned
placed, to what engineering standards, and what geometry would be needed to sketch the parts? The final PBL question could move into prompting for the rough visual steps to model the part in CAD. Team members could swap a response with other groups, who would create the parts in CAD as a visualization check and present it to the class.
An alternative PBL scenario could produce and modify real parts. Using Vernier calipers and engineering sketch pads, small teams could reverse-engineer dissimilar
assemblies into a series of ANSI-dimensioned sketches that need modification. The parts are shared throughout the collaborated team according to complexity, yet individually produced in the parametric modeler that are assembled and checked for interference. In turn, the modified parts may be sent to the three-dimensional prototyping printer as a 3-D model, which as part of the PBL solution, could demonstrate the technology learned and help to communicate the process into a final presentation model as students present their solution.
Statement of the Problem
The intent of this study was to determine if knowledge, skills, and attitudes as learning outcomes of graphic engineering problems would significantly improve when problem-based learning was compared to traditional instructor-based learning in engineering graphics.
Principle Research Questions
The major research focus for this study was: Does the use of problem-based learning have any effect on knowledge, skills, and attitude when compared to students enrolled in traditional engineering graphics courses?
1. Will there be a significant gain in knowledge scores between the traditional lecture group and problem-based learning group?
2. Is there a significant difference in CAD skill performance scores between the traditional lecture group and problem-based learning group?
3. Will there be a significant difference in attitude scores between the traditional lecture group and problem-based learning group?
Hypothesis Statements
The null hypotheses indicated that for the control and treatment groups: H01: There will be no significant difference in knowledge gain between the
traditional lecture (control) and problem-based learning (treatment) groups. H02: There will be no significant difference in CAD skill between the traditional
lecture (control) and problem-based learning (treatment) groups.
H03: There will be no significant difference in attitude between the traditional lecture (control) and the problem-based learning (treatment) groups.
Assumptions of the Study
The following assumptions were made about the research sample for the study: 1. Students in the Foundation of Graphics class would participate voluntarily in
the study.
2. Students entering the course had little knowledge of 3-D computer-aided modeling.
5. Students would complete the MSLQ test to the best of their ability.
6. It was assumed that conditions for completing assigned problems are the same for all.
7. It was assumed the research individuals would be motivated to complete the study.
8. It was assumed the research sample had varying sketching skills during the study.
9. It was assumed the testing instruments used in the study accurately measure achievement, performance, and student attitude.
Limitations of the Study
The study was limited to undergraduate college students taking a Foundation of Engineering Graphics course at NC State University during the fall of 2002. Demographic limitations indicated that the random enrollment process limited the study to students mainly from the Design, Aeronautical, Engineering and Mechanical schools.
Summary
Research indicates that active-learning and small-group teaching, both significant features of PBL, are two deeply interrelated concepts. They represent two different types of theories. Activeness is one theory about how we learn, which in effect is a learning theory. Small-group teaching, a pedogogical theory, relates to how we can encourage and support learning in others. To this end, this study used the independent variable of pedagogical strategy to measure traditional lectures and compared it to problem-based learning in engineering graphics.
Research indicates that both industry and government reports suggest broad changes in the engineering curriculum to include problem-solving, active-learning, and visualization techniques. They also invite engineering education to include the foundation of successful practice, effective teaching, and relevant research in engineering design. Problem-based learning connects visualization to engineering graphics by associating problem solving with visualization in a number of ways. It allows us to process and retain form to creative ideas during problem solving and to connect two-dimensional spatial concepts to
three-dimensional solutions.
articulation can be rectified by the changes that engineering graphics is undergoing as 3-D solid modeling, problem solving, and visualization in both the industrial and educational environments.
CHAPTER TWO LITERATURE REVIEW
To discover the significance of problem-based learning in engineering graphics and the effectiveness of change in knowledge, skills, and attitudes, the literature review focused on multiple components of problem-based learning (PBL) research: (a) problem-solving ability, (b) individual attitudes, (c) group dynamics and social attitudes of PBL, (d) basic knowledge and its retention in engineering graphics, (e) challenges to implementing PBL, and (f) visualization in engineering. These multiple components became the broad nature and scope of the topic and the thinking behind the use of PBL in engineering. This chapter
comprises the following sections: 1. Introduction;
2. Defining problem-based learning;
3. Historic development of problem-based learning;
4. Group dynamics, social attitudes and facilitation of PBL;
5. Challenges and concerns for implementing PBL in engineering education; 6. Problem-based learning in engineering;
7. Historic development of engineering graphics;
8. Basic knowledge and its retention in engineering graphics; 9. Visualization research in engineering graphics; and
Introduction
For engineers to retain a competitive edge, they need the knowledge, skills, and attitudes that will provide them with futuristic problem-solving skills, the expertise to visualize in both two and three dimensions, and the ability to adapt to change. The literature reveals very few studies in the use of PBL for engineering graphics education. Yet the challenge and concern are to change our learning curriculum and teaching methods from instructor-led to student-centered learning and so provide our future workforce with the needed knowledge, skills, and attitudes of an advanced technological society.
The challenge for educators and their students, as Kenley (1995) pointed out, is to include industry partnerships, changing employer needs, and curriculum course design. Taylor (1995a, 1995b) indicated that educational improvement also involves providing students with experiences that help them adjust to a changing industry. Such thinking and analysis have permitted educational reform. This reform urges the educational system and institutions to upgrade their philosophies and teaching methodologies and to improve their ways of educating students toward their chosen career paths, whereby students are provided with realistic knowledge, skills, and attitudes in the world of work so they can achieve subsequent success in the modern global workforce. One reform Johnson (1991) suggested may be through teaching that allows students to solve problems creatively through an active-learning approach termed problem-based learning.
Defining Problem-based Learning
the acquisition and integration of new knowledge, the method is designed to create learning through prior learning experience and to reinforce existing knowledge. PBL is also based on constructivist values, where the curriculum moves from the whole to the part (Finkle, 2000).
Problem-based learning uses Maslow’s (1968) principles of two sets of forces or needs within us, wherein “one clings to safety, the other struggles for growth” (p. 45). Our problem-solving ability, according to Silberman and Auerbach (1998), builds on this need: One of the key ways to attain a feeling of safety is to be connected to other people in groups. This enables challenges to be set before us as we invoke emotional support to move beyond our present level of knowledge and skill. (p. 7)
Greening (1998) emphasized that problem-based learning does not prescribe fixed and narrow pathways for learning but rather broadens our outlook. Brooks and Brooks (1993) and Jones et al. (1997) stressed (a) big concepts and curricular activities using primary source materials; (b) the role of the student as thinker with emerging theories in collaboration with others; (c) teacher roles that mediate the learning environment; (d) assessment that is ongoing and integrated with student learning; and (e) teacher observation, student exhibition, and portfolio management. Greening (1998) and Savery and Duffy (1995) proposed that PBL be student centered, a discussion of knowledge, and faculty facilitated via active discussion to combine it into a learning experience. They concurred that PBL is cognitive complexity using real-world situations to achieve viable solutions.
Historic Development of Problem-based Learning
first introduced to North American medical schools in the 1960s as a tutorial process for promoting lifelong learning. Albanese and Mitchell (1993) traced its roots back to McMaster (Canada), University of Limberg at Maastricht (Netherlands), and Harvard University
(USA). The traditional school acceptance of PBL is based on Harvard Medical School, which employed a hybrid problem-based model of conferences, clinical sessions, lectures, and tutorials (Aspy, Aspy, & Quinby, 1993).
The mid-1980s saw PBL evolve as a more descriptive than analytical process, and the research of that period mostly relates to student perceptions and student performance in certain aspects of a course. Few impact studies of the time relate to graduates, the faculty, the institution, or the profession. Most literature evidence stems from a handful of medical schools, with no examples of coherent PBL curricula for other professions. In this period, the PBL model spread to form a network of professional schools, including Maastricht and the University of California at Berkeley. By the early 1990s, more than 50 medical schools had adopted PBL in some format. Today, over 80% of medical schools and many professional (e.g., architectural and construction) schools use PBL to teach professional cases (Bridges & Hallinger, 1992; Vernon & Blake, 1993). In time, overseas universities adopted and adapted PBL for medical school training, including Maastricht (the Netherlands) and Newcastle (Australia). In the United States, the University of New Mexico adopted the McMaster model (Aspy et al., 1993). Of all teaching methods, problem-based learning is best studied in a scientific sense.
Northwestern, Southern Illinois, Mercer, Tufts, University of Hawaii, University of Illinois, University of Missouri-Columbia, University of Pittsburgh, University of Texas-Houston, and Wake Forest-Bowman Gray (LeMaster, 1996; Robbs & Meredith, 1994). Other countries using it to teach undergraduates include Australia, Canada, Denmark (Aalborg), England, France, Finland, South Africa, the Netherlands, and Sweden (Biggs & Collis, 1982). These countries currently implement and use PBL in medical and professional schools.
In summary, problem-based learning as a teaching tool is now used globally in many areas of higher education, such as schools of dentistry, health sciences, nursing, pharmacy, public health, veterinary medicine, architecture, building, business, computing, education, engineering, forestry, law, police science, social work, and other professional fields.
Group Dynamics, Social Attitudes, and Facilitation of PBL
A typical public educational system has qualities and dynamics that influence how our professional knowledge, skills, relationships, and attitudes are established and informed within the system. In the social connectivity within a school and its system, we find
relationships and attitudes concerned with student–teacher, student–student, teacher–teacher, and teacher–administrator relationships (Giroux, 1988).
Lambros (2000) pointed out that PBL goes beyond this, with group dynamic elements as a social and intrapersonal side to learning. Her studies show that many traditional
environment, their acceptance as part of a group can play a pivotal part in their own progress and the progress of other members of that group. It is this attitude of accepting other
members of a group within PBL that students have to take individual weaknesses and
strengths and, by doing so, they are likely to become much more aware of their own strengths and weaknesses (Lambros, 2000).
The teacher workshops of LeMaster and Matthews (1996) saw PBL dynamics emerge in diverse positive and negative ways, including “tension, frustration, feelings of inadequacy, leadership, exploration, commitment, acceptance and self- awareness” (p. 12). Some students of PBL were “ready to engage in group dynamics as part of their own growth, they were candid, spoke up, and were ready to accept leadership” (Lambros, 2000, p. 12). Others appeared more inclined to avoid issues of “acceptance and self-awareness either because of their own tension, discomfort, unease, or simple lack of awareness,” (p. 14) or they changed due to group dynamics (Lambros, 2000).
subject area or arrive at a deeper understanding of a complex issue, the emotional
accompaniment he generated was excitement, along with an awareness of the fulfillment to come. It appeared to generate enthusiasm, passion, and creativity, which in turn was
conveyed to the group solution. On another occasion, “when curiosity showed up as fear of not knowing or as self-doubt, his emotional accompaniment was overwhelming frustration, defeatedness, and irritation” (p. 13).
The recognition of these attitudes and elements during PBL facilitation is a pivotal skill that can only be achieved through experience and interaction with students. Lambros (2000) reported the two types of tension as destructive and energizing (negative/positive). The troublesome side of tension in group dynamics is where you might feel stymied or confused and ill at ease with a situation, like having feelings you, as a teacher or student, or rest of the group do not want to be in that situation; that is, you are in a rut and cannot move on. One way around this in-group facilitation dynamic is to have everyone vent their feelings and prompt what they, or the group, wants as a constructive contribution to team work. Often this technique has a way of clearing the air and shifting the negative tension to a positive tension. It is a case of indicating what does and does not work for each member of the group. But it is through calm facilitation authority that this is made to happen in a quiet unassuming way, such as, “Let us stop at this point and express our feelings for what is happening and what we need to do.” The stakeholders can then move on, restart, and become engaged in team problems and learning content (LeMaster & Matthews, 1996).
(Albanese & Mitchell, 1993; Aspy et al., 1993). Authority is an expected central relationship of a teacher in any class situation (Giroux, 1988). While, as a facilitation skill, authority regulates social and intrapersonal skills, it is not there to merely focus on mediating the learning environment. Lambros (2000) indicated that this part of active learning in PBL is connected to learning and in-group dynamics. Authority underpins the facilitation process as a pivotal contributor to group dynamics and shows us how curiosity, or the lack thereof, can lead to either deeper understanding or self-doubt and frustration. It can lead to irritation and dissatisfaction, or it can invoke feelings of inadequacy, leadership, exploration,
self-awareness, commitment, and acceptance, and it underpins and is pivotal to the PBL process in the struggle for growth and safety. Lambros (2004) called this the social side of learning. Challenges and Concerns for Implementing PBL in Engineering Education In the quest to implement PBL as engineering knowledge, skills, and attitudes, many challenges and concerns can block the implementation of problem-based learning in a curriculum. Kenley (1995), a senior building lecturer from the University of Melbourne, Australia, stated:
teacher] and is guided in that learning process by a series of problems instead of a structured curriculum along academic discipline lines. (pp. 2-4)
Stepien, Gallagher, and Workman (1993) reported that corporate and government communities not only seek partnerships with industry and higher education but also require the provision of a workforce to meet economic and global competition and professional standards and integrity via higher education. Success in the workforce may depend on a person’s aptitude to meet changing needs of employers. Such changes include critical thinking and group problem solving skills. College graduates must be able to deal with numerous challenges that evolve from globalization and a complex and dynamic business environment.
To develop a PBL course, educators need to restructure course design to provide real-life problems and situations (Finkle & Torp, 1995). Also, it is necessary to prepare for a paradigm shift in teacher–student relationships and possibly assume a variety of teacher roles.
Mitchell (1993) suggested a few concerns, as evidenced in the case-study literature: (a) the process of change due to pre-conceived non-constructivist modes of learning, (b) the problems of assessment, and (c) problems relating to inherent difficulties with PBL as a mode of learning.
Problem-based Learning in Engineering
When applying problem-based learning to engineering students, who are familiar with traditional talk-and-chalk classrooms, they are likely, at first, to be uncomfortable with problem-based learning. It is up to the instructor to convince the students that they are researchers looking for information and a problem solution. The students often expect the instructor to describe what they have to do, as a cookbook approach to learning. The attitude of engineering students is that they normally want to know just what they have to do to get a grade (Belhot, 1999). The students find moving into a non-traditional learning or PBL format scary and horrifying, as it can lead to irritation and dissatisfaction.
Partnerships and prompting as facilitation also come in many forms, for example, by partnering through the facilitation process and through the instructor as a meta-cognitive coach. A coach who also thinks and prompts about solutions to the problem is one way to motivate and stimulate in students the PBL conduct expected of them, producing a positive attitude to learning. Facilitation questions are encouraged. What is going on here? Can anyone explain to me where we are at in the problem? Students are encouraged to divide and share the work through task delegation and to use technology. Further questions include: What do we need to know more about? What can we do in a more effective way? What should it look like visually? What is missing from the graphic? Is this better sketched as a 2-D or 3-2-D sketch? Facilitation is the process that keeps groups aligned and moving toward the engineering objectives and the imaginable two- or three-dimensional solution to the problem.
LeMaster and Matthews (1996) indicated that engineering facilitation rules are as follows:
1. Do not rush students, especially in the beginning.
2. Do not take the problem away from the students by being too directive. 3. Do not give students too much information because you are afraid they will
not find it.
4. Do not be afraid to say. “That sounds like a learning issue” instead of giving the answer.
6. Do not become the expert in the group just because you have the information they need.
7. Do not intervene as soon as you sense they are going off track—remember, mistakes are okay. (LeMaster & Matthews, 1996)
In the application of this principle to engineering, a big dilemma in engineering was preparing students in how to use imagination and visualization of their thought processes as proportional sketches with a tolerable degree of accuracy. In engineering graphics we need imagination for design. As Einstein said, “Imagination is more important than knowledge” (Calaprice, 1996, p. 223). Visualization is an area of graphics that can form a specialization in itself, for as humans we can receive visual input but we have no output mechanism for visually representing ideas, except in mental imagery and dreams. Unfortunately, these visions are not easily shared. Hence, humans need visual assistance to help them represent ideas visually (LaJoie, 2000).
Developing engineering sketches through visualization and spatial skills is an
develop spatial visualization skills (Baartmans & Sorby, 1996). In addition, “a relationship was found between the amount of experience high school students had in shop, drafting, and solid geometry and their scores on a three-dimensional spatial visualization test upon
entering college” (Sorby et al., 1998, p. 6).
Historic Development of Engineering Graphics
Geometry, sketching, and drawing are graphic language tools used by engineers and architects to solve problems and convey design intent. The history of engineering graphics may be viewed from two angles: important discoveries and instrumentation technology.
Important Discoveries in Engineering Graphics
Engineers use geometry, sketching, and drawing as mathematical and visual
analytical tools to converse in a common language. Research indicates these same tools also encouraged technological improvement and change, especially during the Renaissance when competition was the engine driving technological improvement in engineering, architecture, and art. This competition was among the Guilds, whose well-educated members included artisans, goldsmiths, artists, masons, metal workers, sculptors, compass makers, and so on. Renaissance engineering was also loosely intertwined with architecture. Geometry and sketching were used to instill dexterity and hand-and-eye coordination in apprentices as a means of mental training to help them solve problems and to think spatially and holistically as they captured new ideas (Bennett, 1926, 1937; Trachtenburg & Hymen, 1986).
Though mathematical analysis of space and geometry was considered unique to the Renaissance, it led Filippo Brunelleschi, a talented sculptor and Renaissance engineer and architect, to discover perspective drawing. Single-point perspective, roughly attributed to between 1410 to 1415, was an important discovery for architecture and art (Trachtenburg & Hymen, 1986).
Multiview drawing was another discovery attributed to the Renaissance. “In the latter half of the fifteenth century and the early part of the sixteenth century,” according to
Gardner (1980) wrote that “Durer became the first northern artist to travel to Italy and see its underlying theories at their source” (p. 608). After “Durer’s first Italian journey in 1495, he made a second trip in 1505-06, and from then on, it became his life mission to bring modern Italian Renaissance style north and establish it there” (p. 608).
These two accomplished artists, Francesca and Durer, used multiview drawings basically for anatomical reasons: they wanted to sketch body parts to correct dimensions and in perfect geometric proportion within their artistic paintings. But multiview projection as a drawing method was little used by engineers until it was rediscovered by Monge and put to practical use when the Ecole Polytechnique de France was first opened in Paris (Bennett, 1926). Likewise, multiviews as a graphic technique was also in use in China. Prior to its rediscovery by Monge, a Chinese by the name of Xi-Yao (1729) wrote geometric treatise lecture notes on perspective drawing, later revised in 1735.
Thus, artistic multiviews by Francesca and Durer eventually found a practical use in engineering, the proof of which is in a series of published lecture notes by Monge (1795) that later became the first geometry textbook in first-angle projection (Monge, 1800). This
practical use of geometry did not appear in America until Crozet returned from the Ecole Polytechnique in 1816. Thus, graphics discoveries of Europe were brought to 19th-century America by Crozet a West Point professor and graduate of the Ecole Polytechnique. Crozet (1821) published Descriptive Geometry, one of the first books in the United States on first-angle projection. In it he showed how to use first-first-angle projection as the basis for
in 1902 when Hall (1902) a professor from Lafayette College, Pennsylvania, wrote Descriptive Geometry, the first book on third-angle projection (Hammond et al., 1971).
Quickly following was the beginning of the modern direct or auxiliary method by Moyer (1904), who produced a book on Engineering Descriptive Geometry.
In the direct approach, solutions to spatial problems are accomplished by projecting onto auxiliary planes of projection that show directly the desired relationships. In the direct method, the spatial system is first referred to the principal planes of projection and then the spatial system and the views are simultaneously revolved until the solution is obtained.” (Hammond et al., 1971, p. 13).
The final combination of the direct method and third-angle projection came about in 1926 when Hood (1926) wrote Drawing Descriptive Geometry by the Direct Method. In the book, he combined the direct method and third-angle projection, which is now common to
America.
Classical architectural engineering forms also appeared in America and Europe through Andrea Palladio (1508-1580), the stonemason turned engineer and architect who produced a treatise in 1570 on architecture in which he illustrated and set out the
able to visualize clearly in space and form mental models of the subjects upon which they were working.
In the historic writings of Bennett (1926), we find that projection theory, as visualization in the classroom, was taught under different classification headings of sketching, technical drawing, geometry, drafting, and so on. Hammond et al. (1971) also indicated that engineering graphics as a communication tool was used to overcome the barrier of verbal language and as “an illustration can be understood by anyone who views it” (p. 11). To overcome the barrier of verbal language and learn the graphic language of
engineering or architecture, Hammond et al. indicated that trainees used different ways of learning, such as copying, imitating the master, and simple problem solving as a form of cognitive apprenticeship to the master. These different ways of learning were all to the same end, providing a form of mental training as 3-D spatial visualization to engineers, drafters, or both in order to produce 2-D standard drawings for the machine shop, structure, or fabrication (Bennett, 1926). Yet, the history of engineering graphics is not just limited to important discoveries, as instrumentation technology also played an important role in these discoveries.
Instrumentation Technology in Engineering Graphics Hand Tools
for example, was made of wood, which later became forged iron and then die-cast brass. One of the oldest references to the City and Guilds was a 1442 reference to the German Guild of Compass Forgers, so referenced because they created forged iron compasses by hand. Advances in materials show that die-cast brass came into use around the 16th century, then flat-sheet brass in the 18th and 19th centuries. References are also found of Swiss instrument mechanics who started manufacturing plants, Esser in 1770 and Kern in 1819 (Oppenheimer, 1956). Compared to the German compasses, the Swiss versions were made as improved precision instruments from rolled brass sheeting instead of die-casting or hand forging. An advance in design came in 1843 when Clemens Reifler, through his German factory, produced a compass with a pivot head-and-ball motion. Reifler exported this innovation to America in 1855 (Oppenheimer, 1956).
To this end, Theodore Alteneder, a Swiss-trained apprentice in the Reifler plant from 1841 to 1848, set up an instrument manufacturing plant in Philadelphia when he came to America around 1848. He also used a new imported material, nickelsilver (alloy of copper, zinc, nickel). The new material came from China to Europe in 1820 and was used in Swiss instrument manufacturing from 1850 on (Oppenheimer, 1956). Advances slowly followed in the 20th century, with improvements through knurled wheels, friction heads, center-screw adjustment, and the spring bow-and-beam-compass, until the computer took over as a tool. Computers
it is an extension of the drawing board as it embodies geometric techniques and the old hand tools of scale rule, protractor, compass, triangles, and dividers in a single package. However, traditional early CAD software followed the old hand geometry patterns, that of using multiview techniques as a layout on the drawing sheet. The modelers allowed CSG solid modeling of a three-dimensional part, but it was unwieldy and engineers had trouble learning how to manipulate true solid models into multiview documents. It required explicit size definition of all geometry, and the user had to maintain geometric relationships between entities, so editing was time intensive (Matthews, 2000).
The latest CAD software in engineering graphics is the parametric or constraint-based modeler, which allows geometric relationships to be directly coded into the model as
parameters or variables and the designer’s true intent is built into the model. Parametric design is an important modeling paradigm in computer-aided design as it allows relationships (constraints) among the degrees of freedom of the model, resulting in efficient design
modifications and variations. The geometric information is coded as parameters, which are assigned as (a) numeric values, (b) relations to other parameters through equations, or (c) relations to other parameters through geometric relationships. These parameters include (a) size and shape of the model and (b) constraints or relationships between entities, such as parallel, concentric, tangential, co-linear, and perpendicular constraints.
views could result in problems further down the line in production, assembly, sales, or marketing. Indeed, although engineers and machinists are trained to read and translate 2-D sketches into 3-D form, any non-specialists in sales and marketing as part of the team regularly had spatial difficulty visualizing the final product from 2-D section or multiview drawings, which were reflected as counter-productive to sales. To resolve this, artists were regularly hired to produce pictorials or three-dimensional sketches as visual solutions, but these costly pictorial interpretations were frequently inaccurate (Hobson, 2002). Now through complex and sophisticated 3-D computer modeling software, 3-D changes in engineering design problems and graphics are starting to correct some of the old 2-D difficulties (Matthews, 2000).
Basic Knowledge and Its Retention in Engineering Graphics
With engineering problem solving and problem-based learning, the research indicates a gap in the three-dimensional visual–spatial approach to problem solving. It is through teaching engineering students to think three dimensionally and use visualization techniques that we can enhance their spatial cognitive and problem-solving abilities and also help construct a memory link to the new knowledge (Adams et al., 1988). However, as we look for solutions to problem solving, especially with both traditional and problem-based
education, we see the manipulation of ideas and the actual mental problem-solving process in a small portion of the brain called short-term memory.
called into the short-term memory when it has to be used (Ledoux, 2002). A case in point, as Ledoux (2002) pointed out, is that we must practice to become skilled at selecting the
information we actually need to work with in our short-term memory. To aid memory, for instance, we can use repetition, make charts and diagrams, create clusters, or use chunks of information so the space in short-term memory does not impede our problem-solving process.
Cognitive psychologists generally agree that, for information to be retained in long-term memory, learners must construct a memory link between the new information and some related information already stored in long-term memory (Gagné, 1985). To apply this
memory link to engineering graphics, for example, we might construct a memory link by both sketching and reverse engineering a dimensioned part into two- and three-dimensional images in order to help retain the short-term ideas into long-term memory.
Auerbach (1998) indicated, people are inattentive in a lecture 40% of the time, and their attention span decreases with each passing minute.
When learning is passive, the learner comes to the encounter without curiosity, without questions, and without the interest in the outcome. When learning is active, the learner is seeking something. He or she wants an answer to a question, needs information to solve a problem, or is searching for a way to do the job. (Silberman & Auerbach, 1998, p. 5)
Since the advent of computer technology into engineering graphics some 40 years ago, the knowledge, skills, and attitudes for the practice of engineering drawing, problem solving, and teaching have been revolutionized. At one time, the use of visual thinking with a pencil, a slide rule, a scale rule, and a sketchpad (visualization) were all the basic design or analysis tools needed. Traditional teaching methods are useful for curricula where rules, procedures, formula, and so forth are applicable (Kenley, 1995). For mathematics and engineering, for example, the attraction of a traditional program is significant. Kenley indicated that the reliance on the teacher’s knowledge base is less critical, and it is also supplemented by standard references and guides.
In conclusion, the current teaching method in engineering graphics is often through an instructor-based or project-centered learning method, a ceteris-paribus approach, as opposed to the adoption of a problem-based learning style that is different insomuch that it requires the use of a cognitive problem as the primary teaching mechanism (Kenley, 1995). For instance, in problem-based learning, a learning situation is presented before any
knowledge is given. Once knowledge is acquired, it is applied to the problem. Through this method, the students are in control because they must select the knowledge needed to solve the problem, learn that knowledge and relate it to the problem. They select their own pace and sequence, and often evaluate themselves (Woods, 1996a).
Visualization Research in Engineering
Evidence shows that visualizing three-dimensional objects and manipulating them in the mind is important to engineers, and many graphics engineering professionals indicate that spatial visualization can be used successfully toward the solving of real problems (Deno, 1995; Miller & Bertoline, 1991a, 1991b; Parolini, 1994). In engineering, the field of spatial research has been examined by Branoff (1999), Miller (1990), Sorby et al. (1998), and others. Visualization research also appears to come under the heading of spatial ability and spatial rotation as a process of mental imagery manipulation. In an early example, Pellegrino, Alderton, and Shute (1984) subdivided and separated spatial ability into two components: spatial relations and spatial visualization. Yet the focus of their study was on the
spatial intelligence. Witkin, Moore, Goodenough, and Cox (1977) also cited similar results in their famous field dependent–field independent studies. Gaylean (1983) performed research that combined visualization and cognition. She presented visualization exercises that were designed as a learning aid to help students have more effective learning and to be more aware of themselves and others. She found that visualization increased cognitive accomplishment, provided more social interaction between student–student and teacher–student, and enhanced creativity.
The visualization research of Kosslyn (2000) indicated that visual imagery is produced in an area of the brain termed the visual cortex. This rear area of the brain lets us work visual processes in problem solving, allowing the formation of mental imagery, and through the use of our visual perception to work through visual problems.
Engineering projection theory and engineering graphics is both a 2-D and a 3-D image skill and cognitive process, and, to perform well, an engineer has to be able to spatially visualize in both two and three dimensions (Bertoline & Wiebe, 2002). Visual images in the field of graphics are a tool, a mental model, a mind tool or simple
communication device used to convey messages and ideas. In this visual age, images, drawings, sketches, or graphics all have the same common thread: They are communication devices and are used to convey design ideas to a client or an end user who will use the product (Matthews, 2000).
Summary
Today’s educational system is expected to respond to the knowledge, skills, and attitude needs of our future industry, though many believe that universities and colleges are inadequately equipped for an economy that is defined by technology, abrupt change, and competing global markets. Engineering workers need to be both Gestalt thinkers and meta-cognitive problem solvers. How these workers are trained in basic engineering graphics may influence the way they perform in industry and as lifelong learners. A worker’s success in the engineering workforce often depends on an ability to meet the changing needs of employers, which includes the possession of critical thinking as both individual and group problem-solving skills.
Not all studies are favorable to PBL. The research indicates that conflicting test results on basic knowledge comprehension. Albanese and Mitchell (1993) reported that, in the medical field, it was sometimes found that students schooled with problem-based learning performed worse on standardized tests, though they performed better on clinical tests and equal on essay tests to traditionally-schooled students. In another study, Albanese and Mitchell (1993) indicated that PBL students had knowledge deficits as compared with traditionally trained peers. Another study found that PBL students performed worse on immediate post-tests but over time they performed better and their scores equaled students taught in lecture mode at 3 months and 2 years, indicating that PBL knowledge is more deeply ingrained and less likely to be as easily forgotten (Albanese & Mitchell, 1993).
CHAPTER THREE METHODOLOGY
This chapter looks at methodology, procedure, and instrumentation and summarizes the major differences between the control and treatment group pedagogy. This study
examined the significance of problem-based learning and compared it to traditional teaching within engineering graphics. To discover the effectiveness of change in knowledge, skills, and motivational attitude, several measurable variables were selected. The independent variable of pedagogical strategy was a comparison of traditional lecture to problem-based learning. The measurable dependent variables were (a) content knowledge, which was measured using gain scores of pre-test and post-test engineering graphics problems; (b) skill, which measured CAD skill laboratory performance by creating a timed CAD model; and (c) student attitude, which was measured by the MSLQ survey. Scores were obtained to determine the effectiveness of the study.
For the independent variable of pedagogical strategy, students received traditional instruction and problem-based learning instruction through a series of specially prepared engineering graphic exercises created for the study within the Foundation of Graphics syllabus. In the treatment group, a problem-based learning pedagogy was used, which, instead of using a one-way live teacher–student lecture style of pedagogy, included probing questions and PBL grouped student–student–facilitator interaction style. This PBL
lecturing process, the researcher used prepared exercises, PBL facilitation, and probing questions as a problem-solving process for knowledge gain.
Major Research Questions
The major research question for this study was: Does the use of problem-based learning have any effect on knowledge, skills, and attitudes when compared to students enrolled in traditional engineering graphics courses? The question was based on the rationale that problem-based learning may be used as a problem-solving tool to help improve student learning outcomes in knowledge, skills, and attitudes when compared to instructor-based learning.
The following research hypotheses identify the study testing instruments and subsequent data analysis:
H01: There will be no significant difference in knowledge gain between the traditional lecture (control) and problem-based learning (treatment) groups. H02: There will be no significant difference in CAD skill between the traditional
lecture (control) and problem-based learning (treatment) groups.
H03: There will be no significant difference in attitude between the traditional lecture (control) and the problem-based learning (treatment) groups.
Subjects and Demographics
and the rest non-engineering majors. Eighty-three percent of the treatment group indicated it was their first course in engineering graphics, as opposed to 53% in the control group. The remainder of the groups indicated having a previous course in high school.
Subjects participated freely in the study. Of the sample, 85% were male and 15% were female. Ethnicity of the subjects obtained the following cell counts: 4
African-American (8%), 1 Asian (2%), 37 Caucasian (78%), 1 Latino (2%), and 5 Native-African-American (10%). The Foundation of Graphics course also served as a development course in
knowledge, skills, and attitude for higher Graphic Communication courses, where knowledge, skills, and motivational behavior were required for advanced graphics and technological activities.
In addition to their similarity, the GC120 and GC211 courses also had the following criteria for selection: (a) each section could be taught by different instructors but have similar student demographics for the target study; (b) any instructor chosen for the treatment group must have had prior experience in using problem-based learning and in teaching visual-spatial methods; (c) each course had been taught prior to the semester in which the research was conducted; (d) each course included engineering graphics theory and CAD skill for a final engineering project; (e) each course had common elements that included student– teacher interaction; and (f) subject demographics were from both engineering and non-engineering majors at the sophomore and junior levels.
Research Design of the Study and Sampling
The study was confined to two groups, a GC211 control group and a GC120
design (see Table 1), using statistics to explore gain among variables (Campbell & Stanley, 1969). The control group, comprised of 24 students registered for the GC211 Introduction to Engineering Graphics course, had an independent instructor who taught both the lecture and CAD lab to the control group. Chosen out of 10 possible Foundations of Graphics groups, the choice of control group was due to (a) instructor access, availability, and prior teaching of similar classes using common elements that included teacher–student lecture and student– teacher lab interaction and (b) subject demographics would be from both engineering and non-engineering majors at the sophomore and junior levels. Both the control and treatment groups used the same text (Bertoline & Wiebe, 2000), used the same CAD software and tutorials, and took the same mid and final tests and quizzes.
The GC120 Foundations of Graphics treatment group used problem-based learning (PBL) for specific manufactured graphic problems without lectures, and the Graphic Communications instructor was trained to work in small groups using problem-based learning that included student–student–facilitator interaction. Students had no knowledge of the study prior to registering for the course. Students in both the treatment and control groups had the same Foundations of Graphics syllabus, the same number of CAD labs, mid-term test, end-of-term test, and MSLQ survey. Only the PBL for the treatment group was different.
Pedagogical strategy was the independent variable treatment. The dependent variables were (a) knowledge pre- and post-test to compare knowledge gain; (b) CAD skill, a
Table 1
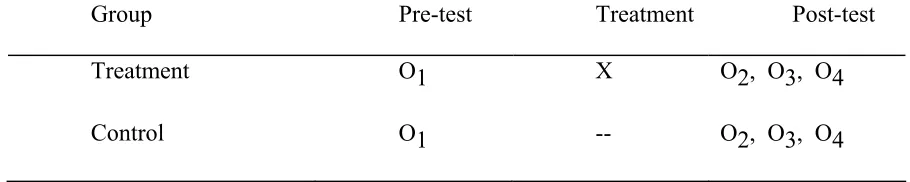
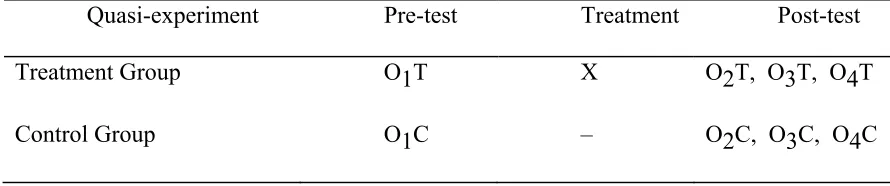
Quasi-experimental Research Design
Group Pre-test Treatment Post-test
Treatment O1 X O2, O3, O4
Control O1 -- O2, O3, O4
Note. O1 = knowledge pre-test, week 1. X = problem-based learning treatment, week 1 through 10. O2 = knowledge post-test, week 10. O3 = CAD skill evaluation (timed), week 11. O4 = MSLQ attitude survey, week 12.
The knowledge pre-test/post-test scores (O1, O2) measured engineering graphics content knowledge using a pre-test/post-test design as measurable dependent variables. The CAD skill scores (O3) measured the application of a timed CAD laboratory performance test by creating a three-dimensional CAD model and comparing its quality and completeness. The attitude survey (O4) used the MSLQ a self-report questionnaire to measure students’ attitude. The researcher selected four subscale measures, intrinsic goal orientation, extrinsic goal orientation, task value, and self-efficacy, to serve as indicators of student motivation.
Procedure