Combining angular response classi
fi
cation and backscatter imagery segmentation
for benthic biological habitat mapping
Rozaimi Che Hasan
a,b, Daniel Ierodiaconou
a,*, Laurie Laurenson
aaDeakin University, School of Life and Environmental Sciences, Faculty of Science and Technology, P.O. Box 423, Warrnambool, Victoria 3280, Australia bUTM Razak School of Engineering and Advanced Technology, Universiti Teknologi Malaysia, 54100 Kuala Lumpur, Malaysia
a r t i c l e i n f o
Article history: Received 6 July 2011 Accepted 5 October 2011 Available online 17 October 2011
Keywords: angular response supervised classification backscatter imagery segmentation biological habitat maps
a b s t r a c t
Backscatter information from multibeam echosounders (MBES) have been shown to contain useful information for the characterisation of benthic habitats. Compared to backscatter imagery, angular response of backscatter has shown advantages for feature discrimination. However its low spatial resolution inhibits the generation offine scale habitat maps. In this study, angular backscatter response was combined with image segmentation of backscatter imagery to characterise benthic biological habitats in Discovery Bay Marine National Park, Victoria, Australia. Angular response of backscatter data from a Reson Seabat 8101 MBES (240 kHz) was integrated with georeferenced underwater video observations for constructing training data. To produce benthic habitat maps, decision tree supervised classification results were combined with mean shift image segmentation for class assignment. The results from mean angular response characteristics show effects of incidence angle at the outer angle for invertebrates (INV) and mixed red and invertebrates (MRI) classes, whilst mixed brown algae (MB) and mixed brown algae and invertebrates (MBI) showed similar responses independent from incidence angle. Automatic segmentation processing produce over segmented results but showed good discrimi-nation between heterogeneous regions. Accuracy assessment from habitat maps produced overall accuracies of 79.6% (Kappa coefficient ¼0.66) and 80.2% (Kappa coefficient ¼0.67) for biota and substratum classifications respectively. MRI and MBI produced the lowest average accuracy while INV the highest. The ability to combine angular response and backscatter imagery provides an alternative approach for investigating biological information from acoustic backscatter data.
Ó2011 Elsevier Ltd. All rights reserved.
1. Introduction
Seabed habitat mapping is key to understanding the distribution of habitats in marine environments since it provides baseline knowledge for sustainable management (Bax et al., 1999) and is essential for planning of Marine Protected Areas (Jordan et al., 2005). In an environment with increasing anthropogenic activities, there is a need to map and quantify seafloor habitats and associated bio-logical benthic communities (Kostylev et al., 2001; Beaman et al., 2005; Brown and Collier, 2008). Benthic habitats, particularly the biological communities have been shown to have important biodi-versity roles in a variety of marine systems (Snelgrove, 1997).
The development of underwater acoustic technology, particu-larly multibeam echosounder systems (MBES) has revolutionised tools for seabed habitat mapping (Hughes Clarke et al., 1996). The
wide swath of MBES provides complete and full seabed acoustic coverage compared to single beam echosounders. In addition to acquiring depth information, backscatter (intensity of acoustic return) from MBES systems has also been used for a variety of applications such as geological analysis (Gardner et al., 2003; Le Gonidec et al., 2003; Dartnell and Gardner, 2004) and more recently benthic habitat characterisation (Ierodiaconou et al., 2007a, 2011; McGonigle et al., 2009; Rattray et al., 2009; De Falco et al., 2010; McGonigle et al., 2011).
While MBES bathymetry and backscatter imagery maps are being increasingly used for habitat mapping, analysis of angular dependent backscatter (i.e. angular backscatter response) has also been shown to contain important information on seafloor charac-teristics (Hughes Clarke, 1994; Fonseca and Calder, 2007; Fonseca et al., 2009). Incidence angle affects backscatter intensity (de Moustier and Alexandrou, 1991) and thus has the potential to be used as an important characteristic for classification processes. The use of parameter extractions and inversion models using angular response information has been extensively applied to discriminate
*Corresponding author.
E-mail addresses: [email protected], [email protected] (D. Ierodiaconou).
Contents lists available atSciVerse ScienceDirect
Estuarine, Coastal and Shelf Science
j o u r n a l h o m e p a g e : w w w . e l s e v i e r . c o m / l o c a t e / e c s s
between different sediment types (Hughes Clarke, 1994; Hughes Clarke et al., 1997; Chakraborty et al., 2000, 2002; Canepa and Berron, 2006; Fonseca and Mayer, 2007; Fonseca et al., 2009; Lamarche et al., 2010). Efforts have been made to relate angular response to benthic biological communities using unsupervised clustering (Hamilton and Parnum, 2011). The results (presented as point sample characterisations) demonstrate some similarities with the biological habitats such as rhodolith and seagrass areas previously mapped (Ryan et al., 2007). Additionally, the mean angular response from seagrass was found to be higher than sand and mud (Siwabessy et al., 2006) but similar to gravelly sand (De Falco et al., 2010). However to date there has been limited work investigating information contained within angular response to characterise benthic communities such as macro-algae communi-ties typical in cool temperate waters of Australia (Phillips, 1998; James et al., 2001; Wernberg et al., 2003).
Whilst angular response is applicable for the discrimination process, its spatial resolution is limited to the MBES swath width (Hughes Clarke, 1994; Hughes Clarke et al., 1997) and inhibits the construction offine resolution habitat maps.Fonseca et al. (2009)
demonstrates thatfine resolution benthic sediment maps can be constructed by integrating high resolution backscatter imagery with angular response analysis. They apply a manual segmentation method to the backscatter imagery to define areas that have similar angular response characteristics and recommend that automated image segmentation could be a more systematic approach. Auto-mated image segmentation serves as a first stage in the object
oriented classification approach and has been successfully applied to side-scan sonar backscatter imagery for reef based classifications (Lucieer, 2007, 2008). Meanwhile, automated feature extraction has been applied to MBES backscatter imagery to perform automated image classification (Cutter et al., 2003; Preston, 2009). This study will investigate whether automated image segmentation of back-scatter imagery can be combined with the supervised classification of angular response to produce benthic biological habitat maps.
2. Methods
2.1. Study area
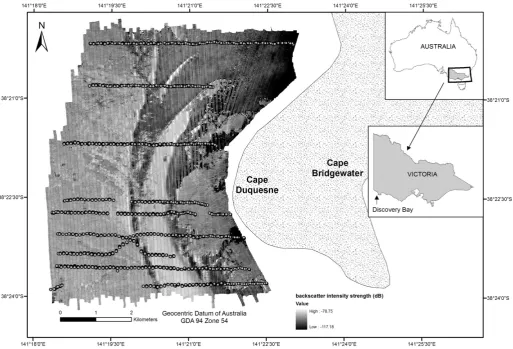
The study area is located in Discovery Bay, south-eastern Aus-tralia and covers a total area of 39.8 km2, with 26.3 km2situated in the Discovery Bay Marine National Park (Fig. 1). The site ranges in depth from 12 to 80 m. Vertical basalt reef structures rise up to 20 m from the seafloor, reflecting the region’s dynamic volcanic history (Boutakoff, 1963). This area is covered in a rich array of temperate southern Australianflora and fauna. The shallow reef structures support diverse assemblages of red algae and kelps (dominated byEcklonia radiata, Phyllospora comosaandDurvillaea potatorum), while the deeper regions are covered in sponges, ascidians, bryozoans and gorgonian corals (Ierodiaconou et al., 2007b). The variety of temperate marine habitats present in this site makes it ideal for testing the association of acoustic response with habitat classes.
2.2. MBES acoustic data
The acoustic data was collected using a Reson Seabat 8101 multibeam echo sounder (MBES) from 6 to 7 November 2005 with an operating frequency of 240 kHz, designed specifically for shallow water surveying purposes. This swath system consists of 101 individual beams and each beam has a beamwidth of 1.5 (along and across track). Horizontal positioning was accomplished using a Starfix HP Differential GPS system (0.30 m), integrated with a POS MV (Positioning and Orientating System for Marine Vessels) for heave, pitch, roll and yaw corrections (þ0.02 accu-racy). Daily sound velocity profiles were collected to correct for water column sound speed variations (deepest at 73 m).
The uncorrected backscatter amplitudes (snippets) were recor-ded from the Seabat 8101 and archived for subsequent post pro-cessing. We employed the Centre for Marine Science and Technology’s (CMST) multibeam sonar processing toolbox, written in MatlabÒ to process the amplitude data (Parnum, 2007). The CMST tool corrects for the time variable gain (TVG) in order to estimate the backscatter intensity strength. At this stage, the backscatter intensity strength is affected by the incidence angle, hence it is known as the angular backscatter intensity. To generate a backscatter map (backscatter imagery),first angular backscatter intensity needs to be compensated for the angular variation (Parnum, 2007), then it is gridded (5 m). We produced the angular response curve that is the average of angular backscatter intensity from stacks of 25 consecutive pings, defined by one spatial coor-dinate with port and starboard sides treated separately. The detailed description of CMST tool processing stage and algorithms can be found inParnum (2007). The tool has been applied to study the relationship between backscatter and seagrass distribution (De Falco et al., 2010) and differentiate between benthic biological habitats using the unsupervised clustering of angular response curves (Hamilton and Parnum, 2011).
2.3. Ground truth data
To determine benthic habitat associations with angular response, a training dataset was required to label angular response with defined user classes. Georeferenced underwater video data were collected and classified as part of the Victorian Habitat Mapping Project to investigate the distribution of benthic biological habitats in coastal waters of Victoria. The underwater video was collected using a Remotely Operated Vehicle (ROV) and positioned using DGPS and Tracklink Ultra Short Base Line (USBL) underwater acoustic system, with vessel errors (roll, pitch and yaw) corrected using a KVH (KVH Industries, Inc.) motion sensor (Rattray et al., 2009). The classified video produced five broad biota classes; Mixed Brown algae (MB), Invertebrates (INV)esponges, Mixed Red algae and Invertebrates (MRI), Mixed Brown algae and Inverte-brates (MBI) and No Visible Biota (NVB) and three substratum classes; Reef (R), Sediment (S) and Reef/Sediment (RS). We identi-fied the nearest groundtruth locations to angular response posi-tions by using an approximate intercept method which selects the most frequent class within a 10 m radius of each angular response position. Approximately 70% of the ground data provided a training label for angular response used in the classification process while the remaining 30% was selected for accuracy assessment (Table 1).
2.4. Decision tree classification
A decision tree approach was used to create a decision rule from the predictor variables (i.e. angular response curve with known class signature). The predictor variables were the angular response of backscatter strength values from 0to 70incidence angles (at
one degree intervals). The decision rules generated using the training data then were used to classify the angular response curves from the remaining locations for class assignment. A decision tree is defined as a classification procedure that recursively partitions a dataset into smaller subdivisions on the basis of a set of tests defined at a branch or node in the tree (Friedl and Brodley, 1997). A widely known decision tree technique is the Classification and Regression Tree (CART) (Breiman et al., 1984). CART has been used to classify substratum types (Rooper and Zimmermann, 2007) and to predict benthic biological distributions (Holmes et al., 2008). Several methods have been developed to improve CART decision trees to avoid overfitting in searching for splitting rules (Gray and Fan, 2008). Quick, Unbiased and Efficient Statistical Tree (QUEST) was selected to classify the angular response data. QUEST generates a similar decision tree to CART but it does not use an exhaustive variable search routine and is unbiased in choosing variables which afford more splits (Loh and Shih, 1997). QUEST has been used to predict the biological benthic habitat communities using MBES data (bathymetry, backscatter and their derivatives) and georefer-enced underwater video (Rattray et al., 2009; Ierodiaconou et al., 2011). We used the QUEST executable program available from
http://www.stat.wisc.edu/wloh/quest.html.
2.5. Image segmentation
Image segmentation techniques were used to group pixels with similar characteristics in the backscatter imagery. We applied the mean shift image segmentation technique (Comaniciu and Meer, 2002) through the Edge Detection and Image Segmentation System (EDISON) tool (http://coewww.rutgers.edu/riul/research/ code/EDISON/index.html). Although mean shift image segmenta-tion is not designed for object oriented classification, a comparison of segmentation quality between mean shift and other segmenta-tion techniques (mostly used in remote sensing applicasegmenta-tions) shows that it can produce promising results (Neubert et al., 2008). Mean shift segmentation is based on nonparametric feature space analysis and uses a kernel density estimation. The spatial parameter is used to define the radius of the density estimation search process in feature space until the mean shift vector is converged (Comaniciu, 1999; Christoudias et al., 2002; Comaniciu and Meer, 2002). The mean shift segmentation algorithm used five-dimensional feature space consisting of three colour space such as RGB (Red, Green and Blue) and two lattice coordinates (X and Y). If the image is greyscale, the segmentation performs
Table 1
The distribution of angular response data used for training and for accuracy assessment (biota and substratum). For accuracy assessment process, only the position and class of angular response are used.
Number of angular response used for training
Number of angular response used for accuracy assessment
Biota Class
Mixed Brown algae 66 26
Invertebrates 556 233
Mixed Red algae and Invertebrates
66 28
No Visible Biota 432 183
Mixed Brown and Invertebrates
25 11
Sum 1145 481
Substratum Class
Reef 171 72
Sediment 589 252
Reef/Sediment 423 177
similarly except the feature space consists of only three dimen-sions; the grey value and the lattice coordinates. Since the segmentation tool (i.e. EDISON) cannot handle an intensity image (floating point image) directly, we applied a pseudo colour image transformation (RGB) in Matlab. A pseudo colour image offers more than one colour parameter and has been shown to provide addi-tional information for the segmentation process when compared to greyscale imagery (Cheng et al., 2001, 2002). Pseudo colour image transformations have been applied in remote sensing applications such as change detection and have shown to provide rich and informative attribute from analogue maps (Saraf, 2003). We ran segmentation using the three main parameters, spatial resolution ¼ 7, colour resolution ¼ 6.5 and minimum region ¼100 pixels. All parameters were default except for the minimum region that was changed from 20 to 100 pixels to avoid generating too many small regions.
2.6. k nearest neighbour
The segmented regions (polygons) were joined with the spatial information of angular response and the predicted class (from the supervised classification process) so that all the polygons were assigned class information. This was done by computing the poly-gon centroid and usingknearest neighbour (k¼7) to search the nearest majority angular response class and assign class names to polygon centroid. We employed nearest neighbour algorithm as described inTheodoridis et al. (2010). The maps produced using the above methods were evaluated using the independent ground truth class information. We use an error matrix to measure indi-vidual class accuracy (user and producer accuracy), overall accuracy and Kappa coefficients (Congalton, 1991).
3. Results
3.1. Angular response characteristic from ground truth
The shape of mean angular response from the biota class showed that MB and MBI produced a similar profile (Fig. 2a), with MBI slightly higher than MB (Fig. 3a), especially from 20to over 60 incidence angle. The differences of mean angular response between MBI and MB consistently increased with incidence angle (maximum differences¼1.3 dB at 63) (Fig. 3b). These responses indicate that the presence of invertebrate (sponge dominated habitat) could produce a small increment of backscatter intensity in MBI compared to MB class (brown algae). INV and MRI show good separation in backscatter intensity as the incidence angle increased above 50(Fig. 2a) with the curves reducing drastically at 50(INV) and 60(MRI). These results show that the outer angle (55e70)
has strong discrimination characteristic for INV and MRI compared to the near (0e15) and moderate incidence angle (15e55).
Substratum classes were more easily distinguished compared to biota from the mean angular response (Fig. 2b). Although they have similar curve responses from 0 to 30, the moderate and outer angles provide separation for all classes. Reef class was found to have the highest backscatter intensity at the outer angle. Sediment and Reef/Sediment classes differed significantly from 30 to 50 and produced almost similar backscatter intensity towards 70. The mean angular response from substratum class shows that Reef/ Sediment response was the combination of responses between Sediment and Reef classes, particularly from 30to 70. The effect of incidence angle for substratum classes was more pronounced compared to biota.
3.2. Segmentation of backscatter imagery
Segmentation of the backscatter imagery shows that the size of polygons varies according to the homogeneity of the texture in the backscatter imagery and was capable of delineating between regions of differing backscatter characteristics (Fig. 4a). The segmentation process produced 5323 segmented regions with an average 365 pixels per segment. Nadir artefacts from individual survey lines appeared to affect some of the polygon boundary and shapes. Small polygons were also observed and produced over segmentation results. However, by performing the k nearest neighbour analysis, most of the smaller polygons were grouped into the majority surrounding class, minimising the effect of over segmentation in thefinal habitat map and reduced nadir boundary artefacts (Fig. 4c).
3.3. Accuracy assessment
The integration of the image segmentation of backscatter imagery and the supervised classification of the angular response enabled the construction of habitat maps for biota and substratum presented inFig. 5. For biota, the accuracy was 79.6% with Kappa coefficient 0.66 (Table 2). The average value between user and producer’s accuracy indicated that MRI has the lowest accuracy (35%), while INV produced the highest (84%). The results also show that most of the MRI class was misclassified as INV. MB on the other hand shows a better accuracy (78%) compared to MRI even though these classes were similar in sample size for training data. MBI has the smallest number of sample size (25 for training) producing a poor accuracy (44%).
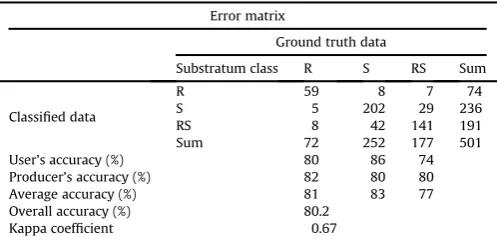
The substratum classification produced an overall accuracy of 80.2% and Kappa coefficient 0.67 (Table 3). Average accuracy indi-cates that all three classes achieved accuracies of more than 77%.
Fig. 3.Mean angular response curves (a) and their differences (b) between MBI and MB. MB¼Mixed Brown algae, MBI¼Mixed Brown algae and Invertebrates.
The error matrix shows that Reef was well classified with less confusion with the other two classes. Despite Reef having the smallest sample size, it still produced good accuracy (81%). Although some confusion occurred between Sediment and Reef/ Sediment, the proportions of uncorrected classes were small and both classes showed good accuracies (83% and 77% respectively).
4. Discussion
This study used angular response and backscatter imagery from MBES to examine whether they can be integrated to provide useful information that can be used to predict the distribution of benthic biological communities. We demonstrate how angular response is classified using a decision tree classification and automated image
segmentation of the backscatter imagery and how these two techniques can be integrated to produce habitat maps for benthic biological communities. This technique has the advantage of preserving the spatial resolution from the backscatter imagery, whilst taking advantage of the valuable information contained with the angular response. This information has been effectively used to discriminate different macro-algae habitats and invertebrate (sponge) from sediment class (no visible biota). This signifies that the present approach is capable of distinguishing between hard (reef based habitats) and soft classes (non reef).
Previous applications of angular response classifications have mostly concentrated on sediment characterisation (Hughes Clarke, 1994; Hughes Clarke et al., 1997; Canepa and Berron, 2006; Fonseca and Mayer, 2007; Fonseca et al., 2009; Lamarche et al., 2010) with
Fig. 5.Habitat maps of biota (left) and substratum (right).
Table 2
Accuracy assessment for biota classification.
Error matrix
Ground truth data
Biota class MB INV MRI NVB MBI Sum
Classified data
MB 26 6 6 3 8 49
INV 0 208 17 37 0 262
MRI 0 2 3 0 0 5
NVB 0 17 0 143 0 160
MBI 0 0 2 0 3 5
Sum 26 233 28 183 11 481
User’s accuracy (%) 53 79 60 89 60
Producer’s accuracy (%) 100 89 11 78 27
Average accuracy (%) 77 84 35 84 44
Overall accuracy (%) 79.6
Kappa coefficient 0.66
recent work applying these methods to biological communities.
Hamilton and Parnum (2011) demonstrated the usefulness of angular response information for biological habitats (seagrass and rhodolith) using unsupervised statistical clustering. This study shows that angular response is capable of differentiating between different biological habitats on reef structures. The low spatial resolution of angular response classification can be overcome with automated segmentation procedures which provide advantages in terms of repeatability compared to manual digitising methods previously demonstrated (Fonseca et al., 2009). With the increasing amount of acoustic backscatter data and coverage that can be collected through MBES systems (Hughes Clarke et al., 1996), it is essential that the primary data should be studied and explored in different ways to determine its full capability and whether it is useful for alternative applications.
The comparison of mean angular response between biological habitats in this study provides some information about their acoustic characteristics. Angular response is a complicated process derived from the geological and biological nature and upper morphology of the seabed; factors such as the water/sediment interface, roughness and the sediment volume structure influence the response (Canepa and Berron, 2006). In some studies, the presence of biological habitat (such as seagrass) has been shown to increase backscatter intensity when compared to sand (Siwabessy et al., 2006; Parnum, 2007; De Falco et al., 2010) and reef struc-tures often show higher backscatter intensity than sediment (Hamilton and Parnum, 2011). Angular response curves for biota (except MB and MBI) and substratum decreased as the incidence angle increased, matching the typical shape of the angular response curve (Hughes Clarke, 1994; Hughes Clarke et al., 1997), particularly for sediment. Despite the effect from sediment, INV and MRI (mostly distributed on Reef/Sediment) had angular response curves similar to sediment at the outer angle while the mean angular response from biological habitats on reef structures (MB and MBI) seemed to be independent of the incidence angle. When comparing these habitats with other biota classes, the angular response curve was almost horizontal. The results presented here are similar to those ofSiwabessy et al. (2006)who reported that the slope of mean angular response (between 10 and 35 incidence angle) from algae on reefs was likely to be small andflat. This shows that the combination of substratum and biota habitats influences the angular response characteristic. However, there will be difficulties in determining which layer contributes most to the scattering process. A further study using water column data extracted from MBES backscatter (McGonigle et al., 2011) could be combined with angular response data to investigate this issue.
The use of decision tree supervised classification has allowed the production of thematic habitat maps with moderate accuracy (Congalton and Green, 2009). The accuracy assessment is
a summative process derived from training data, the decision tree model, image segmentation and joining processes between angular response classification and the segmented polygons. The accuracy assessment shows misclassification occurring between MB with MBI, and MRI with INV. These classes were most likely to be in the same acoustic group because they share similar species composi-tion and substratum types and are often differentiated based on changes in canopy density. Low classification accuracy has been observed with algal classes that have similar characteristics using bathymetry, backscatter and their derivatives (Rattray et al., 2009). The use of mean shift image segmentation in the present study has been shown to be a useful technique for integration with angular response classifications to produce benthic habitat maps. Spatial clustering in the segmentation provides polygons that serve as base maps for point class information. Segmentation approaches combined with other classification techniques such as object oriented classification have been shown to be useful for differen-tiating sand and reef classes using backscatter from side-scan sonar (Lucieer, 2007, 2008). By creating polygons from similar adjacent pixels, thefinal classification maps can reduce the‘salt and paper’
effect that commonly appears in pixel based classifications. The main drawback of image segmentation is that it is easily affected by under or over segmenting depending on the technique used. Under segmentation produces large polygons whereas over segmentation will generate too many smaller polygons. Although over segmen-tation is observed with mean shift image segmensegmen-tation in the present study, their effects have been decreased by taking the nearest neighbour for angular response class labelling.
The angular response classification presented here (e.g.Fig. 4b) is useful even when not combined with backscatter image segmentation. The class information can be mapped as single point features for the study area at a scale of half the swath width (port and starboard sides) (Hamilton and Parnum, 2011) and spatial distribution of each habitat can be recognised and determined. However, there will be limitations where the results are to be combined or compared with other small scale map information such as from the high resolution bathymetric maps. Depth has been shown to influence the distribution of benthic biological habitat communities and provides useful information to the habitat clas-sification using MBES data (Brown et al., 2011). Further investiga-tion is required to determine whether depth and its derived seascape metrics can be integrated with angular response classifi -cation in explaining benthic biological habitat distributions.
The construction of angular response of backscatter is generated from a number of consecutive sonar pings (port and starboard are handled separately) which assumes that the seafloor habitat within this range is homogeneous, which often is not the case as the variability of seafloor habitats occurs between swaths (Hamilton and Parnum, 2011). Moreover only single spatial information is given to each side of the swath to represent the position of the angular response curve that causes uncertainty when the merging process is carried out between the angular response position and the segmented polygons. Some adjacent angular response positions will overlap which initially should be filtered, since the swath coverage from the original MBES survey lines is targeted to be at least 50% overlap. Ambiguity is also caused when assigning video observation classes to the angular response positions within its 10 m radius. Computing the angular response curve only from homogeneous segmented regions rather than across the sonar swath may also improve class differentiation. Techniques of combining angular response classification with its similar acoustic region from backscatter imagery such as the acoustic theme method could be essential in minimising the errors occurred with angular response position (Fonseca et al., 2009). The segmentation algorithm used in this study also has limitations because of high
Table 3
Accuracy assessment for substratum classification.
Error matrix
Ground truth data
Substratum class R S RS Sum
Classified data
R 59 8 7 74
S 5 202 29 236
RS 8 42 141 191
Sum 72 252 177 501
User’s accuracy (%) 80 86 74
Producer’s accuracy (%) 82 80 80
Average accuracy (%) 81 83 77
Overall accuracy (%) 80.2
Kappa coefficient 0.67
computational complexity limiting its application for processing large volumes of data (Wan and Deng, 2011). We found a 5 m pixel resolution appropriate for our dataset to avoid memory limitations.
5. Conclusion
This study provides techniques to produce benthic biological habitat maps using the combination of angular response and backscatter imagery. The use of angular response for supervised classification is important because backscatter intensity from different habitats on the seabed is presented at different angles and provides more information than a single normalised backscatter value (i.e. backscatter imagery). By combining with mean shift image segmentation, habitat maps have been successfully gener-ated. The ability to use angular response and backscatter imagery to produce habitat maps has improved our understanding of the level of benthic biological information that can be extracted from MBES acoustic backscatter. Results from this study have extended angular response applications from seafloor substrate classifications to biological habitat mapping. The quantitative analysis of angular response is not limited to the decision tree technique presented in this study, with scope to test the performance of other supervised approaches. Additionally, the role of image segmentation is rec-ognised as an important tool in the identification of homogeneous areas to be used for further analysis (i.e. classification process). This study provides a framework for linking backscatter data with benthic biological identities and overcomes low spatial resolution of angular response data for benthic habitat mapping using acoustic techniques. With a variety of techniques and data available to generate marine habitat maps, the integration and assimilation of these datasets allows the extraction of more information to further understand marine ecosystem processes and provides a more systematic approach to managing and preserving marine biodiversity.
Acknowledgements
The authors would like to thank the crew from the Australian Maritime College research vessel Bluefin and Fugro Survey for the multibeam data collection. We thank Alex Rattray and Jacquomo Monk for suggestions and comments. This work was supported by Natural Heritage Trust and Caring for Country as part of the Victorian Marine Habitat Mapping Project. We also would like to thank Iain Michael Parnum from Centre for Marine Science and Technology, Curtin University and P.J.W. Siwabessy from Geo-science Australia (formerly with Centre for Marine Science and Technology, Curtin University) for providing support on the CMST tool software. This manuscript was significantly improved by comments from two anonymous reviewers.
References
Bax, N., Kloser, R., Williams, A., Gowlett-Holmes, K., Ryan, T., 1999. Seafloor habitat definition for spatial management infisheries: a case study on the continental shelf of southeast Australia. Oceanologica Acta 22, 705e720.
Beaman, R.J., Daniell, J.J., Harris, P.T., 2005. Geologyebenthos relationships on a temperate rocky bank, eastern Bass Strait, Australia. Marine and Freshwater Research 56, 943e958.
Boutakoff, N., 1963. The geology and geomorphology of the Portland area. Geological Survey of Victoria Memoir 22.
Breiman, L., Friedman, J.H., Olshen, R.A., Stone, C.J., 1984. Classification and Regression Trees. Wadsworth International Group, Belmont, CA, USA. Brown, C.J., Collier, J.S., 2008. Mapping benthic habitat in regions of gradational
substrata: an automated approach utilising geophysical, geological, and bio-logical relationships. Estuarine, Coastal and Shelf Science 78, 203e214. Brown, C.J., Smith, S.J., Lawton, P., Anderson, J.T., 2011. Benthic habitat mapping:
a review of progress towards improved understanding of the spatial ecology of the seafloor using acoustic techniques. Estuarine, Coastal and Shelf Science 92, 502e520.
Canepa, G., Berron, C., 2006. Characterization of Seafloor Geo-acoustic Properties from Multibeam Data. OCEANS, pp. 1e6.
Chakraborty, B., Schenke, H.W., Kodagali, V., Hagen, R., 2000. Seabottom charac-terization using multibeam echosounder angular backscatter: an application of the composite roughness theory. Geoscience and Remote Sensing, IEEE Trans-actions 38, 2419e2422.
Chakraborty, B., Schenke, H.W., Kodagali, V., Hagen, R., 2002. Estimating deep seafloor interface and volume roughness parameters using the multibeam-hydrosweep system. Marine Geodesy 25, 19e26.
Cheng, H.D., Jiang, X.H., Sun, Y., Wang, J., 2001. Color image segmentation: advances and prospects. Pattern Recognition 34, 2259e2281.
Cheng, H.D., Jiang, X.H., Wang, J., 2002. Color image segmentation based on homogram thresholding and region merging. Pattern Recognition 35, 373e393. Christoudias, C.M., Georgescu, B., Meer, P., 2002. Synergism in Low Level Vision, Pattern Recognition, 2002. In: Proceedings. 16th International Conference On, vol. 154, pp. 150e155.
Comaniciu, D., 1999. In: Peter, M. (Ed.), Mean Shift Analysis and Applications, pp. 1197e1197.
Comaniciu, D., Meer, P., 2002. Mean shift: a robust approach toward feature space analysis. Pattern Analysis and Machine Intelligence, IEEE Transactions 24, 603e619.
Congalton, R.G., 1991. A review of assessing the accuracy of classifications of remotely sensed data. Remote Sensing of Environment 37, 35e46.
Congalton, R.G., Green, K., 2009. Assessing the Accuracy of Remotely Sensed Data. Principles and Practices CRC Press, Boca Raton.
Cutter, G.R., Rzhanov, Y., Mayer, L.A., 2003. Automated segmentation of seafloor bathymetry from multibeam echosounder data using local Fourier histogram texture features. Journal of Experimental Marine Biology and Ecology 285e286, 355e370.
Dartnell, P., Gardner, J.V., 2004. Predicting seafloor facies from multibeam bathymetry and backscatter data. Photogrammetric Engineering & Remote Sensing 70, 1081e1091.
De Falco, G., Tonielli, R., Di Martino, G., Innangi, S., Simeone, S., Michael Parnum, I., 2010. Relationships between multibeam backscatter, sediment grain size and Posidonia oceanica seagrass distribution. Continental Shelf Research 30, 1941e1950.
de Moustier, C., Alexandrou, D., 1991. Angular dependence of 12-kHz seafloor acoustic backscatter. The Journal of the Acoustical Society of America 90, 522e531.
Fonseca, L., Brown, C., Calder, B., Mayer, L., Rzhanov, Y., 2009. Angular range analysis of acoustic themes from Stanton Banks Ireland: a link between visual interpretation and multibeam echosounder angular signatures. Applied Acoustics 70,1298e1304. Fonseca, L., Calder, B., 2007. Clustering Acoustic Backscatter in the Angular Response Space. U.S. Hydrographic Conference (U.S. HYDRO), May 14e18, 2007. Norfolk, Virginia, USA.
Fonseca, L., Mayer, L., 2007. Remote estimation of surficial seafloor properties through the application angular range analysis to multibeam sonar data. Marine Geophysical Researches 28, 119e126.
Friedl, M.A., Brodley, C.E., 1997. Decision tree classification of land cover from remotely sensed data. Remote Sensing of Environment 61, 399e409. Gardner, J.V., Dartnell, P., Mayer, L.A., Hughes Clarke, J.E., 2003. Geomorphology,
acoustic backscatter, and processes in Santa Monica Bay from multibeam mapping. Marine Environmental Research 56, 15e46.
Gray, J.B., Fan, G., 2008. Classification tree analysis using TARGET. Computational Statistics & Data Analysis 52, 1362e1372.
Hamilton, L.J., Parnum, I., 2011. Acoustic seabed segmentation from direct statistical clustering of entire multibeam sonar backscatter curves. Continental Shelf Research 31, 138e148.
Holmes, K.W., Van Niel, K.P., Radford, B., Kendrick, G.A., Grove, S.L., 2008. Modelling distribution of marine benthos from hydroacoustics and underwater video. Continental Shelf Research 28, 1800e1810.
Hughes Clarke, J., 1994. Toward remote seafloor classification using the angular response of acoustic backscattering: a case study from multiple overlapping GLORIA data. Oceanic Engineering, IEEE Journal 19, 112e127.
Hughes Clarke, J.E., Danforth, B.W., Valentine, P., 1997. Areal Seabed Classification Using Backscatter Angular Response at 95 kHz, NATO SACLANTCEN Conference Proceed-ings Series CP-45, High Frequency Acoustics in Shallow Water, pp. 243e250. Hughes Clarke, J.E., Mayer, L.A., Wells, D.E., 1996. Shallow-water imaging multibeam
sonars: a new tool for investigating seafloor processes in the coastal zone and on the continental shelf. Marine Geophysical Researches 18, 607e629. Ierodiaconou, D., Burq, S., Reston, M., Laurenson, L., 2007a. Marine benthic habitat
mapping using multibeam data, georeferenced video and image classification techniques in Victoria, Australia. Journal of Spatial Science 52, 93e104. Ierodiaconou, D., Monk, J., Rattray, A., Laurenson, L., Versace, V.L., 2011. Comparison
of automated classification techniques for predicting benthic biological communities using hydroacoustics and video observations. Continental Shelf Research 31, S28eS38.
Ierodiaconou, D., Rattray, A., Laurenson, L., Monk, J., Lind, P., 2007b. Victorian Marine Habitat Mapping Project. Deakin University.
James, N.P., Bone, Y., Collins, L.B., Kyser, T.K., 2001. Surficial sediments of the Great Australian Bight: facies dynamics and oceanography on a vast cool-water carbonate shelf. Journal of Sedimentary Research 71, 549e567.
Kostylev, V.E., Todd, B.J., Fader, G.B.J., Courtney, R.C., Cameron, G.D.M., Pickrill, R.A., 2001. Benthic habitat mapping on the Scotian Shelf based on multibeam bathymetry, surficial geology and sea floor photographs. Marine Ecology Progress Series 219, 121e137.
Lamarche, G., Lurton, X., Verdier, A.-L., Augustin, J.-M., 2010. Quantitative charac-terisation of seafloor substrate and bedforms using advanced processing of multibeam backscattereApplication to Cook Strait, New Zealand. Continental Shelf Research 31, S93eS109.
Le Gonidec, Y., Lamarche, G., Wright, I., 2003. Inhomogeneous substrate analysis using EM300 backscatter imagery. Marine Geophysical Researches 24, 311e327. Loh, W.Y., Shih, Y.S., 1997. Split selection methods for classification trees. Statistica
Sinica, 815e840.
Lucieer, V.L., 2007. The application of automated segmentation methods and fragmen-tation statistics to characterise rocky reef habitat. Journal of Spatial Science 52, 81e91. Lucieer, V.L., 2008. Object-oriented classification of sidescan sonar data for mapping benthic marine habitats. International Journal of Remote Sensing 29, 905e921. McGonigle, C., Brown, C., Quinn, R., Grabowski, J., 2009. Evaluation of image-based multibeam sonar backscatter classification for benthic habitat discrimination and mapping at Stanton Banks, UK. Estuarine, Coastal and Shelf Science 81, 423e437.
McGonigle, C., Grabowski, J.H., Brown, C.J., Weber, T.C., Quinn, R., 2011. Detection of deep water benthic macroalgae using image-based classification techniques on multibeam backscatter at Cashes Ledge, Gulf of Maine, USA. Estuarine, Coastal and Shelf Science 91, 87e101.
Neubert, M., Herold, H., Meinel, G., 2008. Assessing image segmentation qualitye concepts, methods and application. In: Blaschke, T., Lang, S., Hay, G.J. (Eds.), Object-based Image Analysis. Springer, Berlin Heidelberg, pp. 769e784. Parnum, I.M., 2007. Benthic Habitat Mapping Using Multibeam Sonar Systems. PhD
thesis, Curtin University of Technology, Australia.
Phillips, J.A., 1998. Marine conservation initiatives in Australia: their relevance to the conservation of macroalgae. Botanica Marina 41, 95e104.
Preston, J., 2009. Automated acoustic seabed classification of multibeam images of Stanton Banks. Applied Acoustics 70, 1277e1287.
Rattray, A., Ierodiaconou, D., Laurenson, L., Burq, S., Reston, M., 2009. Hydro-acoustic remote sensing of benthic biological communities on the shallow South East Australian continental shelf. Estuarine, Coastal and Shelf Science 84, 237e245.
Rooper, C.N., Zimmermann, M., 2007. A bottom-up methodology for integrating underwater video and acoustic mapping for seafloor substrate classification. Continental Shelf Research 27, 947e957.
Ryan, D.A., Brooke, B.P., Collins, L.B., Kendrick, G.A., Baxter, K.J., Bickers, A.N., Siwabessy, P.J.W., Pattiaratchi, C.B., 2007. The influence of geomorphology and sedimentary processes on shallow-water benthic habitat distribution: Esperance Bay, Western Australia. Estuarine, Coastal and Shelf Science 72, 379e386.
Saraf, A.K., 2003. Development of a pseudo colour transformation technique using satellite image and survey map for change detection studies. International Journal of Remote Sensing 24, 1183e1187.
Siwabessy, P.J.W., Parnum, I., Gavrilov, A., McCauley, R.D., 2006. Overview of Coastal Water Habitat Mapping Research for the Coastal CRC. Cooperative Research Centre for Coastal Zone, Estuary & Waterway. Technical Report 86.
Snelgrove, P.V.R., 1997. The Importance of marine sediment biodiversity in ecosystem processes. Ambio 26, 578e583.
Theodoridis, S., Pikrakis, A., Koutroumbas, K., Cavouras, D., 2010. Classifiers Based on Bayes Decision Theory, Introduction to Pattern Recognition: a MATLAB Approach. Academic Press, Boston, pp. 1e27.
Wan, F., Deng, F., 2011. Remote sensing image segmentation using mean shift method. In: Lin, S., Huang, X. (Eds.), Advanced Research on Computer Educa-tion, Simulation and Modeling. Springer, Berlin Heidelberg, pp. 86e90. Wernberg, T., Kendrick, G.A., Phillips, J.C., 2003. Regional differences in