107
Prediction of Process Parameters for Single Cylinder Piston Type
Compressed Air Engine by Using Design of Experiment
and Regression Analysis
1
Lalit Patel ,
2Ratnesh Shukla
1Assistant Professor, Department of Mechanical Engineering, GEC Dahod,Gujarat, India 2Principal, Government Engineering College , Bharuch ,Gujarat, India
Abstract: This study presents a physical model of compressed air engines (CAEs) is established from existing 4 stroke petrol engine. A conventional 100CC four stroke internal combustion engine was modified to a two stroke compressed air engine To obtain performance on the CAEs, a setup is prepared with dynamometer. The output torque and brake power are obtained through experimental study. The investigation on piston type compressed air engine for different loading condition on a test bench and brake power has been examined with different loading condition by use of design of experiments. For design of experiments L9taguchi method is used for experimentation and parametric analysis. Mathematical model was developed by using regression analysis. The predicted value from the developed model and experimental values are found to be very close to each other justifying the significance of the model. Confirmation runs demonstrates that the optimized result and the values obtained through regression analysis are within the prescribed limit. The results show that CAE has a good economic performance at pressure 5 kg/cm2 provide maximum 0.9283 kW power output with varying load 1.5 kg to 2.5 kg for modified air engine from existing 4 stroke engine and 2 stroke engine.
Key words: Design of experiment, Regression analysis, Compressed air engine (CAE), piston type, different loading condition
1. INTRODUCTION
Fossil fuel burning has been identified as the main cause of severe environmental problems, including greenhouse effect, ozone layer depletion and acid rain [1]. Renewable fuels such as wind, solar, compressed air, etc. are used as perfect solutions [2]. A wide variety of renewable energy technologies are needed to meet the challenges of sustainable energy development [3]. Air pollution has become a serious problem that affects the survival and development of humankind [4]. Regarding environmental conservation, Shafi and Topale believe that oil and gas reserves can be reduced in 2042; This renewable energy enhances competition in the field of vehicles [5].Because transportation accounts for a huge stake of global primary energy demand [6] and exhaust emissions from internal combustion engines make a significant contribution to carbon emissions [7], it is urgent to find sources of energy alternatives for clean and environmental friendly energy carrier. Certain types of zero emission vehicles have been widely explored. Battery electric vehicles offer high energy efficiency, energy diversification, power system equalization and smooth operation [8]; however, heavy metal pollution, high initial cost, limited life span development and application [9]. The power of the hydrogen energy carrier is of high energy density; however, the lack of safety, energy efficiency and storage currently hinders the development of hydrogen fuel cell vehicles [10]. Compressed air is a potentially clean and environmentally friendly energy carrier. When the pressure and temperature of the compressed air are respectively 30MPa and 300K, the energy density is close to that of the lithium battery [11]. In addition, the air tank can be fully recharged in less than time [12 ] and the price of the compressed air motor (CAE) is relatively cheaper [13].Due to its low cost, safe storage, easy access, reusability, high energy storage density and long lifespan, compressed air energy storage will become an advanced and rapidly developing area in the future. Compressed air flow characteristics have been studied in [14-16]. Most programs in compressed air engines
focus on supporting systems or systems that help IC engines [17-19]. Only a few studies or industrial projects have focused on the use of compressed air engines as the main power system [20].Liu and X Yu [21] analyzed the feasibility and prospects of compressed air vehicles by thermodynamic analysis and experimental data. H Ibrahim et al. [22] introduces various energy storage techniques and their field of application. The energy stored in the compressed air could be divided into transmission energy and relaxation energy. The higher the air pressure, the greater the expansion energy ratio [23].
India is one of the fastest developing countries with stable economic growth, which increases the demand for transport in many cases. Fuel consumption is relatively proportional to this demand. Due to shortage of fossil fuel reserves, India relies heavily on imported fuel and has a great effect on the economy. India has to find alternative to maintain growth rate. In India only 52.5% of rural households have access to electricity and 93.1% are in urban households. A total of 35.5% of the total Indian population does not have own electricity. Compressed Air Engine is a better option for producing power to operate automobile, generator, etc. It does not require any known fossil fuels such as petrol, diesel, CNG, LPG, hydrogen etc. It works on high pressure air and is therefore pollution free and is 100% eco-friendly [24]. High pressure air is inserted into the engine, which makes movement forward to the piston. The main advantage of this engine is that no hydrocarbon fuel is needed so there is no combustion process [25].
2. EXPERIMENTAL METHOD
108 Conventional cam and modified cam. Fig. 3 and 4 shows the
Valve timing diagram for conventional cam and modified cam and Fig.5and 6 labels the dimension and Actual view of cam. For replacing the original cylinder head, a new set two flank cams has been designed for operating the inlet and exhaust valves of the modified engine. Both the exhaust and inlet cams are symmetric about the center line of the cam shaft. The cams are made of mild steels. The cam shaft originally had two cams with one lobe each which were mutually perpendicular to each other. The crank rotates due to the movement of the piston; the camshaft is attached with the crankshaft by a timing chain or a timing belt. And as the crank rotates the camshaft also rotates
and hence the timing of the valves is managed. In the traditional camshaft the inlet and exhaust valve both functions.
Table (1) lists the specification of the 4-stroke IC engine, which was modified in the current study as a single cylinder piston type compressed air engine. Before the experiments, the 97.2 cc Internal Combustion engine was modified and connected to a compressed air tank. The cam profile was modified to be conjugate to change the engine from 4-stroke to 2-stroke operation. After the engine was installed, the intake and exhaust valves were examined for possible leakage under high-air-pressure operation.
Table 1: Engine Specifications for 4-stroke engine
Parameter Honda Sleek Engine displacement 97.2 cc
Engine type air cooled ,4 stroke Number of cylinder 1
Valves per cylinder 2
Max power 7.0 ps @8000 rpm Max torque 7.5 nm
Bore*Stroke 50 mm*49.5 mm Fuel type petrol
Starter kick
Number of speed gear 4
Figure.1 Pictorial view of the Conventional cam Figure.2 Pictorial view of the Modified cam
Figure.3 Valve timing diagram of the Conventional cam
[image:2.595.92.534.232.704.2]109
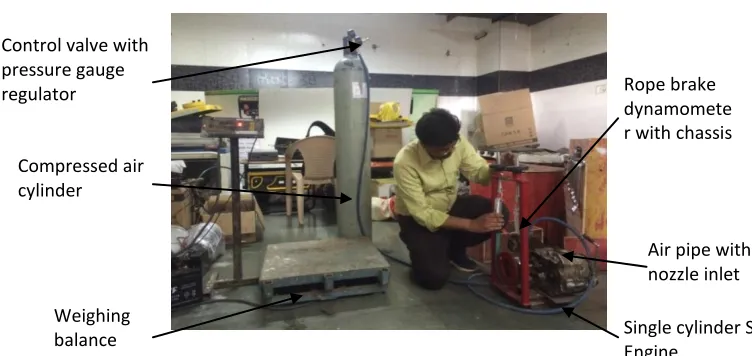
The seepage of the intake valve was consequently close to the flow rate in the experiments, and it seriously affected the performance of the compressed air engine. The exhaust valve leakage was examined when the engine was locked in the intake process, and no leakage was observed. The experimental set up for 4 stroke single cylinder air engine is shown in Fig.7.
3. EXPERIMENTAL DESIGN
The purpose of the formation of the experiment is to determine the critical parameters and their target values[26]. On the basis of selected parameters, experimental design is carried out. The Taguchi experimental design is done for L9 OA for two parameters which are air pressure and different load condition.
A.Processparameters
Process parameters are one of the most important factors for any experimental work. In the current case, the process parameters are selected based on the reviews of various literature. The different levels for process parameters are shown in table 2below.
Table 2 Levels for process parameters
B.Output Process Parameters
In present study parameter taken as a response is brake power.
4. RESULT AND DISCUSSION
For load testing of air engine, it is connected with the rope brake dynamometer with brake drum, spring balance, belt and holding frame. During testing, brake power were measured to determine effective parameters of air pressure
with loading condition by using taguchi design of experiments L9
A.Taguchi Analysis Of Brake Power Of Air Engine Versus Pressure, Load
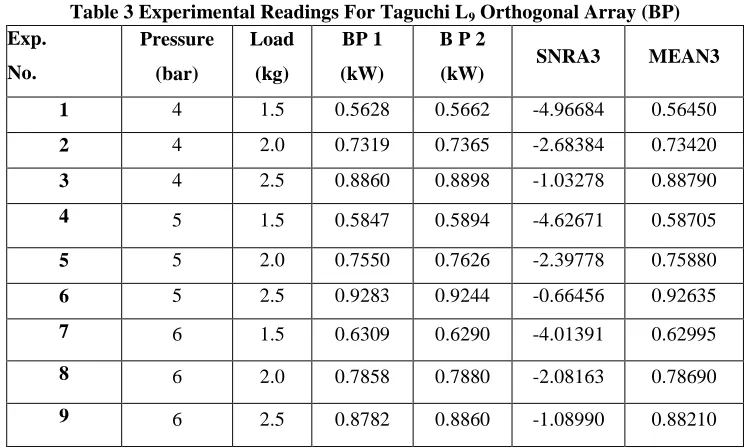
Table 3 shows the Experimental Readings For Taguchi L9 Orthogonal Array for brake power. The response tables 4 and 5 show the average of the selected characteristic for each level of the factors. The response tables include ranks based on Delta statistics, which compare the relative magnitude of
[image:3.595.88.536.79.206.2]Figure.5 Sectional front view of Modified cam Figure.6 Actual view of the Modified cam
Figure.7 Experimental set up for single cylinder piston type air engine
Factor Symbol Unit -1 0 +1
AIR PRESSURE p kg/cm2 4 5 6
LOAD L KG 1.5 2 2.5
Compressed air cylinder
Rope brake dynamomete r with chassis
Air pipe with nozzle inlet
Single cylinder SI Engine
[image:3.595.111.487.246.424.2]110 effects. The Delta statistic is the highest average for each factor minus the lowest average for each factor.
Table 3 Experimental Readings For Taguchi L9 Orthogonal Array (BP)
Table 4 Response Table for Signal to Noise Ratios Level Pressure
(bar)
Load (kg)
1 -2.8945 -4.5358
2 -2.5630 -2.3878
3 -2.3951 -0.9291
Delta 0.4993 3.6067
Rank 2 1
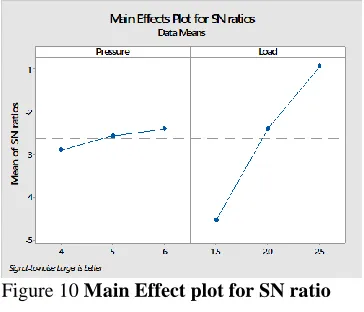
Based on the analysis, from the table 4 and 5., it can be seen that for, the factor with the biggest impact on the S/N ratio is load (delta =3.6067,Rank =1 ) so load is given more impact as compare to air pressure for brake power. Ranks are
assigned based on Delta values; Rank 1 is assigned to the highest Delta value, Rank 2 to the second highest Delta value, and so on. The main effects plot provides a graph of the averages in the response table.
6 5 4 0.90
0.85
0.80
0.75
0.70
0.65
0.60
2.5 2.0 1.5 pressure
M
e
a
n
o
f
M
e
a
n
s
load Main Effects Plot for Means
Data Means
2.5 2.0 1.5
0.9
0.8
0.7
0.6
6 5 4 0.9
0.8
0.7
0.6
pressure
load
4 5 6 pressure
1.5 2.0 2.5 load
[image:4.595.313.508.341.479.2] [image:4.595.312.535.547.713.2]Interaction Plot for Means Data Means
Figure 8 Main Effect plot for Means (Brake Power) Figure 9 Interaction plot for Means (Brake Power)
From figure 8,for the case of brake power, if compressed air pressure is high then brake power would increase vice versa. Also the graph shows that at low value of load, brake power would decrease and vice versa. Here it is clear that
brake power would be less for low compressed air pressure at intake stroke and
lower value of load acting on air engine.
Figure 9 shows that interaction effect between load and brake power depends on the value of the pressure. Here, as
Exp. No.
Pressure (bar)
Load (kg)
BP 1 (kW)
B P 2
(kW) SNRA3 MEAN3
1 4 1.5 0.5628 0.5662 -4.96684 0.56450
2 4 2.0 0.7319 0.7365 -2.68384 0.73420
3 4 2.5 0.8860 0.8898 -1.03278 0.88790
4 5 1.5 0.5847 0.5894 -4.62671 0.58705
5 5 2.0 0.7550 0.7626 -2.39778 0.75880
6 5 2.5 0.9283 0.9244 -0.66456 0.92635
7 6 1.5 0.6309 0.6290 -4.01391 0.62995
8 6 2.0 0.7858 0.7880 -2.08163 0.78690
9 6 2.5 0.8782 0.8860 -1.08990 0.88210
Table 5 Response Table for Means Level Pressure
(bar)
Load (kg)
1 0.7289 0.5938
2 0.7574 0.7600
3 0.7663 0.8988
Delta 0.0374 0.3049
[image:4.595.69.279.550.711.2]111 per the plot at 2.5 kg load and 5bar pressure this combination is associated with the higher brake power .
[image:5.595.98.280.123.279.2]
Figure 10 Main Effect plot for SN ratio Figure 11 Interaction Plot for SN ratio (Brake Power) (Brake Power)
From figure 10 shows the response diagram for brake power. It can be seen that if compressed air pressure and load acting on compressed air engine both the input parameters are increased then brake power would increase means the brake power greatly increases as the engine load is increased. Figure 11 shows that interaction plot for SN ratio between the effect of load acting on air engine and compressed air pressure on brake power. Here same results are obtained as per the interaction plot for means so it can be seen that same optimum condition at 2.5 kg load and 5bar compressed air pressure is associated with the higher brake power.
4.1 Contour Plot Analysis
A contour plot is a graph that it has been use to explore the potential relationship between three variables. Contour plots display the 3-dimensional relationship in two dimensions, with x- and y-factors (predictors) plotted on the x- and yscales and response values represented by contours. A contour plot is like a topographical map in which x-, y-, and z-values are plotted instead of longitude, latitude, and elevation.
Load
P
re
ss
u
re
2.50 2.25
2.00 1.75
1.50
2.50 2.25
2.00 1.75
1.50
6.0
5.5
5.0
4.5
4.0 6.0
5.5
5.0
4.5
4.0
> – – – – – – < 0.60 0.60 0.65 0.65 0.70 0.70 0.75 0.75 0.80 0.80 0.85 0.85 0.90 0.90 MEAN6 Contour Plot of MEAN of BP vs Pressure, Load
Figure.12 Contour plot of Mean of brake power vs Pressure & load
Here, fig.12 shows how pressure (y) and load (x) affect the contours of a brake power. The darker green regions indicate higher brake power. From the figure12 it can be seen that the combination of 5 bar pressure and 2.5 kg load gives maximum brake power i.e darker green area in convex shape. This graph gives the means of brake power range so prediction of compressed air pressure on different loading condition for air engine will be very easy to predict.
4.2 Validation of Results
The validation of experiment is the final step in verifying the conclusions drawn based on Taguchi’s parameter design approach. The confirmation experiment is very important in parameter design, particularly when screening or small fractional factorial experiments are utilized [26]. In this study, a validation of experiment for 4 Stroke air compression test rig was conducted by utilizing the level of
parameters for brake power, here Regression Analysis is carried out and developed regression equations for different parameters by using minitab 16 statical software.
5. REGRESSION ANALYSIS
[image:5.595.194.412.447.586.2]112 5.1 Linear Regression
It is one of the most widely known modeling techniques. Linear regression is usually among the first few topics which people pick while learning predictive modeling. In this technique, the dependent variable is continuous, independent variable(s) can be continuous or discrete, and nature of regression line is linear [27-28]
Linear Regression establishes a relationship between dependent variable (Y) and one or more independent variables (X) using a best fit straight line (also known as regression line).
Regression Analysis: MEAN of BP versus pressure, load The regression equation is
[image:6.595.38.503.183.511.2]MEAN of BP = 0.0473 + 0.0187 pressure + 0.305 load
Table 6 Results of Validation Test for Brake Power
Predictor Coef SE Coef T P Constant 0.04734 0.05920 0.80 0.454 pressure 0.018725 0.009171 2.04 0.087 load 0.30495 0.01834 16.63 0.000
S = 0.0224633 R-Sq = 97.9% R-Sq(adj) = 97.2%
Table 6 depicts the values of Brake power for regression equation and experiment for different loading condition and pressure range of 4kg/cm2 to 6kg/cm2.
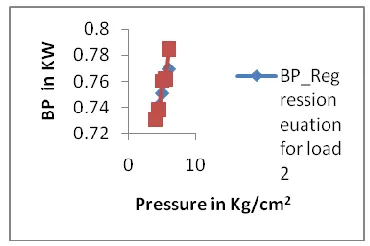
Figure 13 shows the relationship between compressed air pressure and Brake power for load of 1.5 kg by experiment
and equation for 4 stroke air engines. From this figure it can be seen that for 1.5kg load values of Brake power by experiment and equation are matched well. It can also be seen that for air pressure of 4 kg/cm2 max error between experiment and equation is observed about 2 %.
Figure 13 Comparison plot for Brake Power Figure 14 Comparison plot for Brake Power at 1.5kg Load at 2 kg Load
In Figure 14, Brake power measured by experiment and computed from equation is shown. From this figure one can said that the Brake power measured and predicted Brake
power are close to each other. For instant, for a pressure of 6 kg/cm2 max error between experiment and equation is observed about 1.96 %
Sr.No.
Regression equation Derived by Using
taguchi L9 experimentations
Predicated pressure
value
Predicated load value
BP by equation
BP by experiment 1
MEAN of BP = 0.0473 + 0.0187 pressure +
0.305 load
6 1.5 0.617 0.625739
2 5.5 1.5 0.60765 0.6153485
3 5 1.5 0.5983 0.60034
4 4.5 1.5 0.58895 0.586486
5 4 1.5 0.5796 0.568014
6 6 2 0.7695 0.78489
7 5.5 2 0.76015 0.761805
8 5 2 0.7508 0.760266
9 4.5 2 0.74145 0.73872
10 4 2 0.7321 0.731025
11 6 2.5 0.922 0.923616
12 5.5 2.5 0.91265 0.9178434
13 5 2.5 0.9033 0.9082224
14 4.5 2.5 0.89395 0.894753
[image:6.595.41.499.184.505.2] [image:6.595.338.523.608.731.2] [image:6.595.83.287.612.731.2]113
[image:7.595.62.276.99.279.2]
Figure 15 Comparison plot for Brake Power Figure 16 Comparison plot for Brake Power at 2.5kg Load by Measured and prediction value
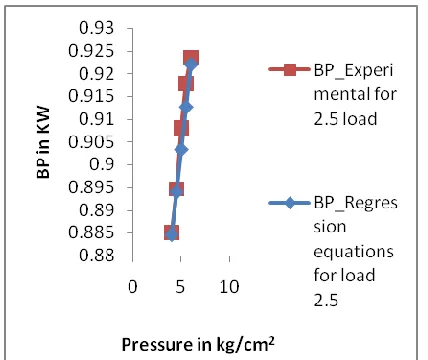
Figure 15 shows the comparison of Brake Power obtained by experimental and equation for different values of pressure and load of 2.5 kg. From the figure it can be seen that the Brake power values are coordinated well.
Figure16 show the comparison of measured and predicted values of brake power for load range from 1.5kg to 2.5kg and compressed air pressure values from 4kg/cm2 to 6kg/cm2. From this graphs it can be seen that the values of the brake power by equation and by experiment are consistent with each other as R2 values are close to unity.
6. CONCLUSIONS
Present work based on DOE L9 three different values of pressure viz; 4bar ,5bar and 6 bar and three different values of load i.e 1.5 kg ,2kg and 2.5kg are experimentally investigated on air engine test rig i.e modified from the existing 4 stroke IC engine. Based on experimental observation, graphs are plotted and results are critically discussed for the different responses.. From the results following conclusions have been observed: Load is given more impact for brake power as compare to air pressure. At 2.5 kg load and 5bar pressure this combination is associated with the higher brake power. In this study, the taguchi method gives effective methodology in order to find out the effective performance output for any machines. After validated of all the results of speed, mass flow rate and brake power based on experiment switch respect to prediction values of load range from 1.5kg to 2.5kg and compressed air pressure values from 4kg/cm2 to 6kg/cm2following points are concluded
1) The values of brake power derived from equation and derived from experiment are consistent with each other as R2 values are close to unity.
2)Maximum error between experiment and equation is observed about 2 %.for brake power when 1.5kg load is applied with given air pressure of 4 kg/cm2 on 4 stroke single air engine test rig.
Finally from the above conclusions, Single cylinder compressed air engine can be encouraged for its use as an alternate for an internal combustion Engine in future.
Exhaust gases is at very low temperature than conventional internal combustion Engine which solves problem of engine heating up to a great extent. Engine can be made up of lighter weight as heating of engine is reduced. This can be a major step towards pollution free environment and recycle the scrape engines. This address both the problems of fuel crisis and pollutions. Optimization of process parameters for compressed air engines gives the significant value of compressed air pressure as well as desire output or desire performance characteristics and in this study all the performance characteristics were within the acceptable limit so it will be very useful technical and commercial viability.
REFERENCES
[1] Veziroğlu, T. N., &Şahi, S. (2008). 21st Century’s
energy: Hydrogen energy system. Energy conversion and management, 49(7), 1820-1831.
[2] Li, Y., Chen, H., Zhang, X., Tan, C., & Ding, Y. (2010). Renewable energy carriers: Hydrogen or liquid air/nitrogen?. Applied Thermal Engineering, 30(14-15), 1985-1990.
[3]Shi, Y., Wu, T., Cai, M., Wang, Y., & Xu, W. (2016). Energy conversion characteristics of a hydro pneumatic transformer in a sustainable-energy vehicle. Applied
energy, 171, 77-85.
[4] Shen, Y. T., & Hwang, Y. R. (2009). Design and implementation of an air-powered motorcycles. Applied Energy, 86(7-8), 1105-1110.
[5]Shafiee, S., &Topal, E. (2009). When will fossil fuel reserves be diminished?. Energy policy, 37(1), 181-189.
[6]Shi, Y., Wang, Y., Liang, H., & Cai, M. (2016). Power characteristics of a new kind of air‐powered vehicle. International Journal of Energy Research, 40(8), 1112-1121.
[7]Liu, C. M., You, J. J., Sung, C. K., & Huang, C. Y. (2015). Modified intake and exhaust system for piston-type compressed air engines. Energy, 90, 516-524.
[image:7.595.332.533.101.281.2]114
automobile system with nonlinearity. Advances in
Mechanical Engineering, 8(11), 1687814016672784.
[9] Chan, C. C. (2007). The state of the art of electric, hybrid, and fuel cell vehicles. Proceedings of the IEEE, 95(4), 704-718.
[10]Hwang, H. T., & Varma, A. (2014). Hydrogen storage for fuel cell vehicles. Current Opinion in Chemical Engineering, 5, 42-48.
[11] Chen, H., Ding, Y., Li, Y., Zhang, X., & Tan, C. (2011). Air fuelled zero emission road transportation: a comparative study. Applied Energy, 88(1), 337-342.
[12] Xu, Q., Cai, M., & Shi, Y. (2014). Dynamic heat transfer model for temperature drop analysis and heat exchange system design of the air-powered engine system. Energy, 68, 877-885.
[13] Shi, Y., Li, F., Cai, M., & Yu, Q. (2016). Literature review: Present state and future trends of air-powered vehicles. Journal of Renewable and sustainable Energy, 8(2), 025704.
[14]Bergant, A., Kruisbrink, A., &Arregui de la Cruz, F. (2012). Dynamic behaviour of air valves in a large-scale pipeline apparatus. In Strojniškivestnik¿ Journal of
Mechanical Engineering (Vol. 58, No. 4, pp. 225-237). ASSOC MECHANICAL ENGINEERS TECHNICIANS SLOVENIA.
[15] Vukčević, V., Werner, A., &Degiuli, N. (2013).
Application of smoothed particle hydrodynamics method for simulating incompressible laminar flow. Transactions of FAMENA, 36(4), 1-12.
[16] Dudić, S. P., Ignjatović, I. M., Šešlija, D. D.,
Blagojević, V. A., &Stojiljković, M. M. (2012). Leakage quantification of compressed air on pipes using thermovision. Thermal science, 16(suppl. 2), 555-565.
[17] Papson, A., Creutzig, F., & Schipper, L. (2010). Compressed air vehicles: Drive-cycle analysis of vehicle performance, environmental impacts, and economic costs. Transportation Research Record: Journal of the Transportation Research Board, (2191), 67-74.
[18] Kang, H., & Tai, C. (2010). Demonstration of Air-Power-Assist Engine Technology for Clean Combustion and Direct Energy Recovery in Heavy Duty Application. Mack Trucks Incorporated.
[19] Schechter M. 1 March 1999, New Cycles for Automobile Engines. In Proceedings of International Congress and Exposition, Detroit, MI, USA; SAE International: Warrendale, PA, USA.
[20] Motor Development International (MDI) Web Page. (accessed on 27 August 2012).AIRPod. Available online: http://www.mdi.lu/ english/airpod.php
[21] Liu, L., & Yu, X. (2008). Practicality study on air-powered vehicle. Frontiers of Energy and Power Engineering in China, 2(1), 14-19.
[22] Ibrahim, H., Ilinca, A., &Perron, J. (2008). Energy
storage systems—characteristics and
comparisons. Renewable and sustainable energy reviews, 12(5), 1221-1250.
[23]Cai, M., Kawashima, K., & Kagawa, T. (2006). Power assessment of flowing compressed air. Journal of fluids engineering, 128(2), 402-405.
[24]Lal, A. (2013). Design and dynamic analysis of single stroke compressed air engine. International Journal of Renewable Energy Research (IJRER), 3(2), 315-319.
[25]Dudhat, R. B., Patel, N. R., Kanadiya, V. M., Mistry, M. K., & Joshi, K. M. (2013). The investigational study of pragmatic model of compressed air single cylinder engine for increases the performance. Int J Adv Engg Tech/IV/III/July-Sept, 46, 49.
[26] Douglas C.Montgomery , International Student Version,Wiley, 8th edition .2013,pp450-455.
[27] AAherwar, D Unune, B Pathri, J kishan (2014) Statistical And Regression Analysis Of Vibration Of Carbon Steel Cutting Tool For Turning Of En24 Steel Using Design Of Experiments, International Journal of Recent advances in Mechanical Engineering,3, 137-151