NAGARAJAN, ANITA Analyzing Memory Performance Bottlenecks in OpenMP Programs on SMP Architectures using ccSIM. (Under the direction of Assistant Professor Frank Mueller).
As computing demands increase, performance analysis of application behavior has become a widely researched topic. In order to obtain optimal application performance, an understanding of the interaction between hardware and software is essential. Program performance is quantified in terms of various metrics, and it is important to obtain detailed information in order to determine potential bottlenecks during execution. Upon isolation of the exact causes of performance problems, optimizations to overcome them can be proposed. In SMP systems, sharing of data could result in increased program latency due to the requirement of maintaining memory coherence.
The main contribution of this thesis is ccSIM, a cache-coherent multilevel mem-ory hierarchy simulator for shared memmem-ory multiprocessor systems, fed by traces obtained through on-the-fly dynamic binary rewriting of OpenMP programs. Interleaved parallel trace execution is simulated for the different processors and results are studied for several OpenMP benchmarks. The coherence-related metrics obtained from ccSIM are validated against hardware performance counters to verify simulation accuracy. Cumulative as well as per-reference statistics are provided, which help in a detailed analysis of performance and in isolating bottlenecks in the memory hierarchy.
by
Anita Nagarajan
A thesis submitted to the Graduate Faculty of North Carolina State University
in partial satisfaction of the requirements for the Degree of Master of Science in Computer Science
Department of Computer Science
Raleigh
2003
Approved By:
Dr. Purushothaman Iyer Dr. Gregory Byrd
Biography
Acknowledgements
I sincerely thank my advisor, Dr. Frank Mueller, for his invaluable guidance and support during this research. It has been a great experience discussing ideas and working on my thesis as part of his research group.
I am very grateful to Dr. Byrd and Dr. Iyer for agreeing to be on my thesis committee and for the valuable feedback regarding the thesis document.
I am thankful to Jaydeep Marathe for his help with understanding METRIC and the many discussions about the framework and related issues.
I would like to thank Arthi, Subhashini and Vidhya for just about everything. Graduate life here has been great with these wonderful roommates. Thanks to all my friends for their help on various occasions.
Contents
List of Figures vii
List of Tables viii
1 Introduction 1
1.1 SMP architectures . . . 1
1.2 OpenMP Parallel Programming Paradigm . . . 3
1.3 Mapping the OpenMP programming model to SMP architecture . . . 3
1.4 Performance Analysis Tools . . . 4
1.4.1 Hardware Performance Counters . . . 4
1.4.2 Simulators . . . 4
1.5 Motivation, Contribution and Organization of Thesis . . . 4
2 The Framework: Design and Implementation 7 2.1 Instrumentation and Trace Generation . . . 7
2.2 ccSIM: A Multi-Processor Cache Simulator . . . 8
2.2.1 Simulation Components . . . 8
2.2.2 Threaded Simulation . . . 8
2.2.3 Coherence Simulation . . . 11
2.2.4 Metrics . . . 14
3 Experimental Setup 17 3.1 Characterization Metrics . . . 17
3.2 Platform . . . 18
3.3 Experimental Methodology . . . 18
3.4 Benchmarks / Applications . . . 19
4 Results and Analysis 21 4.1 Modes of Simulation . . . 22
4.2 Characterization of Benchmarks . . . 23
4.2.1 MG . . . 24
4.2.3 IS . . . 25
4.2.4 FT . . . 29
4.2.5 EQS . . . 29
4.2.6 EQS-RB . . . 29
4.2.7 NBF . . . 32
4.3 Per-Reference Statistics . . . 34
4.4 Opportunities for Transformations . . . 37
4.4.1 Analysis . . . 37
4.4.2 Optimizing Transformations . . . 39
5 Related Work 42
6 Conclusions and Future Work 44
List of Figures
1.1 SMP architecture with shared bus . . . 2
1.2 Framework . . . 6
2.1 Illustration: Trace Events and Simulator Actions . . . 10
2.2 State Transitions for the Write-Once Protocol . . . 12
2.3 State Transitions for the MESI Protocol . . . 13
2.4 Classification of Invalidates . . . 15
4.1 L2 Invalidates: HPM vs. ccSIM . . . 22
4.2 L2 Invalidates comparison: NBF . . . 23
4.3 NBF: with and without pingpong . . . 24
4.4 Results for MG . . . 26
4.5 Results for CG . . . 27
4.6 Results for IS . . . 28
4.7 Results for FT . . . 30
4.8 Results for EQS . . . 31
4.9 Results for EQS-RB . . . 33
4.10 Results for NBF . . . 35
4.11 Overall metrics for NBF . . . 38
List of Tables
2.1 Mapping transitions of Write-Once protocol to MESI protocol . . . 11
3.1 Mean and Confidence Interval for Total L2 Invalidates from HPM . . . 18
3.2 Input data sizes for each benchmark . . . 20
4.1 HPM on Power3 vs. ccSIM . . . 21
4.2 NBF(Data Structures): Processor1 L1cache . . . 34
4.3 NBF(Data Structures): Processor1 L2cache . . . 34
4.4 NBF(Data Structures): Processor2 L1cache . . . 36
4.5 NBF(Data Structures): Processor2 L2cache . . . 36
4.6 NBF(Data Structures): Processor3 L1cache . . . 36
4.7 NBF(Data Structures): Processor3 L2cache . . . 36
4.8 NBF(Data Structures): Processor4 L1cache . . . 37
4.9 NBF(Data Structures): Processor4 L2cache . . . 37
4.10 Comparison of per-reference statistics for each optimization strategy . . . . 39
Chapter 1
Introduction
Parallel computer architectures have ushered in a new era of computing. With the introduction of various parallel programming methodologies, interesting opportunities to explore the hardware-software interaction in these systems have arisen. It has become essential to investigate the details of mapping parallel programming paradigms to the un-derlying hardware. The increasing demands of scientific computing necessitate the study of the causes of suboptimal program behavior on specific architectures. Due to the increasing processor-memory gap, it is essential to consider the effects of memory latency on observed performance. Storage hierarchies play an important role in the overall analysis. To this end, performance tools make a highly useful contribution in determining and isolating per-formance bottlenecks, which is a prerequisite for exploring, implementing and verifying the effectiveness of potential optimization opportunities.
1.1
SMP architectures
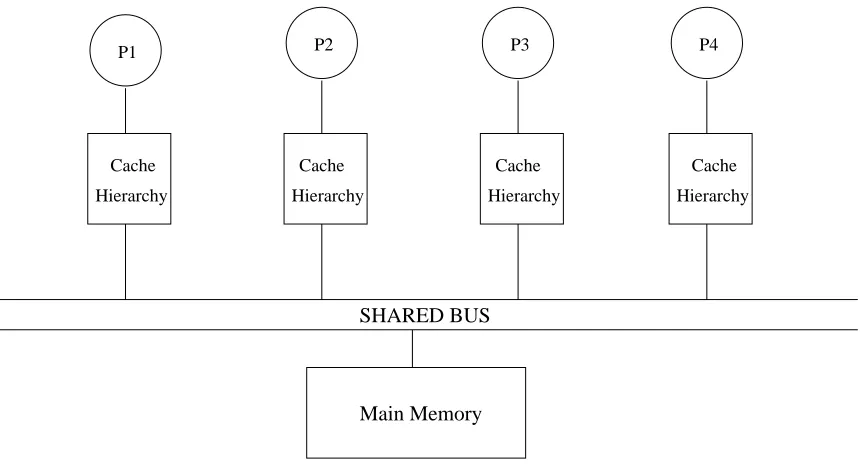
Caches may also be shared at certain levels between processors. The shared interconnect is a potential cause of contention in these architectures, leading to performance bottlenecks. Cache coherence protocols ensure consistency of global shared memory across processors. The common coherence protocols used are MSI, MESI, Dragon and their variants([8]). The degree of contention increases with greater sharing of data across processors. This is caused by increased traffic on the communication medium arising from the need to maintain coherence. Therefore, on such architectures, it is imperative that the overhead caused by maintaining coherence should not overshadow the benefits of parallelizing the program.
Figure 1.1 depicts a symmetric multiprocessor architecture with a global bus as the communication medium. In these multiprocessors, access to main memory is symmetric from all processors i.e. access to main memory from any processor requires the same number of cycles.
SHARED BUS
Cache Cache
Hierarchy Hierarchy Hierarchy
Cache Cache
Hierarchy P4
P1 P2 P3
Main Memory
1.2
OpenMP Parallel Programming Paradigm
OpenMP is a portable standard for shared memory parallel programming [6]. It provides a set of directives and library routines in Fortran and C/C++ to write parallel applications for shared memory multiprocessors. It follows a fork-join model. The sequential portion of the code is executed by a master thread. On encountering a parallel construct, slave threads are created. The master thread and the slave threads execute the section of code enclosed within the parallel region. At the end of this region, the threads join and the master thread continues execution. Work-sharing constructs are provided, which distribute the work in a loop between the parallel threads. Synchronization directives, such as barriers and critical sections, are also available in this standard.
1.3
Mapping the OpenMP programming model to SMP
ar-chitecture
1.4
Performance Analysis Tools
1.4.1 Hardware Performance Counters
Hardware Performance Counters on many microprocessors record a specified set of events occuring in hardware while an application executes. Interfaces like PAPI [3], VTune [7] and HPM toolkit [9] are now available to access the counters in order to obtain counts of these events. They cover a wide variety of platforms. Thus, the behavior and performance of a program on a particular architecture can be analyzed using these statistics. The limitation of hardware performance counters lies in the fact that they provide only raw counts of metrics. The inefficiencies in the application detected from these metrics cannot be attributed to specific data structures in the source code. They provide a useful source of analysis, but the extent of detail provided is not sufficient to allow us to pinpoint the exact causes of performance problems.
1.4.2 Simulators
An extensive range of simulators is available for uniprocessor and multiproces-sor systems. These include trace-driven simulators like Cprof [20] and MemSpy [22] and execution-driven simulators like Augmint [24]. Some simulators [27], [18] concentrate on detailed architectural or instruction-level simulation and present statistics obtained.
1.5
Motivation, Contribution and Organization of Thesis
Our objective is the design of a trace-driven tool that performs incremental mem-ory hierarchy simulation for OpenMP parallel programs executing on shared memmem-ory mul-tiprocessor systems and provides detailed coherence-related statistics that relate program behavior to data structures in source code. We do not model instruction-level simulation or cycle-accuracy. Our interests lie in identifying exact causes of observed coherence behavior and trying to determine if opportunities for optimization exist. Results can be verified against hardware performance counters for accuracy.
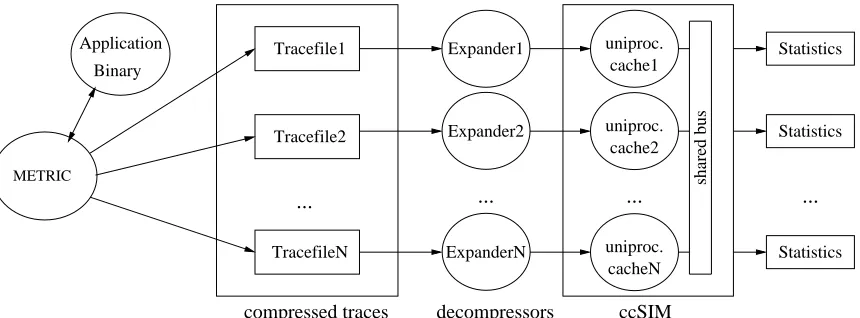
pro-grams on shared memory multiprocessors. It performs a simulation of memory references by the processors in an SMP node for a specified cache configuration using traces obtained through on-the-fly dynamic binary rewriting. Figure 1.2 represents the entire framework. METRIC generates compressed trace files by dynamically instrumenting the memory ref-erences of each OpenMP thread in the executing application binary. These trace files serve as input to driver threads representing the processors in the system. Each driver thread performs the simulation for its corresponding trace in parallel. A shared bus serves as the common interconnect and it uses a MESI bus-based protocol to maintain cache co-herence. Execution is simulated by implementing the OpenMP semantics, and detailed statistics for the execution are obtained. Statistics for hits, misses, temporal and spatial locality, eviction-related information and, most significantly, coherence-related metrics are provided. The important contribution lies in the simulation of coherence traffic. This helps to isolate the causes of invalidations and coherence misses leading to increased program latency. A notable feature is the ability of the simulator to derive cumulative as well as per-reference statistics. This helps in an in-depth analysis of application behavior on the platform of interest. Causes of bottlenecks can be accurately determined and can be used to propose optimization techniques to avoid the detected problems.
Experiments were performed for different interleaved orders of execution with sev-eral OpenMP benchmarks, and results were validated against statistics obtained from hard-ware performance counters.
Statistics Tracefile1
Binary Application
Statistics TracefileN
Expander2
Tracefile2 Statistics
shared bus
cache1
... ... ... ...
ExpanderN
compressed traces decompressors ccSIM
uniproc.
uniproc.
uniproc. cache2
cacheN Expander1
METRIC
Chapter 2
The Framework: Design and
Implementation
2.1
Instrumentation and Trace Generation
Cache simulation for SMPs is based on address traces collected by METRIC, a framework for dynamic binary instrumentation of memory references [21]. METRIC inserts probes through a controller into an executing application to generate highly compressed address traces.
Dynamic Binary Rewriting: The control program instruments the target OpenMP application executable using customized extensions of theDynInst binary rewrit-ing API [4]. These customizations, part of the METRIC framework, have been further extended to capture traces of OpenMP threads for this work. For each OpenMP thread, the memory access points (i.e., the loads and stores) are instrumented to capture the ap-plication access trace.
Once the instrumentation is complete, the target is allowed to continue. Each OpenMP thread’s accesses are traced in parallel without interaction with other OpenMP threads, thus increasing the tracing speed1. For each thread, the instrumentation code calls handler functions in a shared library. The handler functions compress the generated trace online and write the compressed trace to stable storage.
OpenMP supports SMP parallelismviacompiler directives (#pragma ompor!$OMP). The compiler-generated functions implementing these directives are instrumented.
2.2
ccSIM: A Multi-Processor Cache Simulator
The compressed access trace generated from the instrumented OpenMP applica-tion is used for incremental multiprocessor memory hierarchy simulaapplica-tion. A memory access simulator has been designed and implemented for cache coherent shared-memory multi-processor systems. The unimulti-processor components were derived from MHSim [23]. Next, implementation details of ccSIM are described.
2.2.1 Simulation Components
A processor is represented by a driver object with a trace file containing entries corresponding to the sequence of events during its execution (Figure 1.2). Each driver drives an instance of a uniprocessor cache hierarchy. A scripter is responsible for controlling the execution of the driver objects. Statistics generated from the memory-hierarchy simulation provide important feedback about the application behavior and performance. Causes of bottlenecks on the SMP architecture of interest can be determined from the information obtained.
2.2.2 Threaded Simulation
driver object maps to a unique processor on an SMP node. Code execution by the OpenMP threads is simulated as separate threads of control.
Within a single OpenMP parallel region, ccSIM does not impose an explicit or-dering between arbitrary accesses from different OpenMP threads. However, ccSIM must implement the semantics of OpenMP constructs which affect the execution order of threads atsynchronization points,i.e.,barriers,critical sections,atomicsections and accesses protected by explicit mutex locks (omp get lock,omp set lock). Entry and exit events for these constructs are recorded in the trace for each thread.
The scripter enforces synchronization of these threads at OpenMP synchroniza-tion points. We refer to the program code between two synchronizasynchroniza-tion points in an SPMD model as a region. At the start of a region, the scripter assigns the number of events to be processed to each driver corresponding to that region. Every thread then consumes the events from the corresponding trace file and passes the memory references to its cache hi-erarchy for simulation of accesses. Barrier events cause the driver threads to synchronize, thereby ensuring that all access events across all processors before the barrier are processed before any event after the barrier. Criticaland atomic entry/exit events are mapped to calls to representative Pthread mutex locks [31]. Driver threads processing critical or
atomicentry and exit events acquire and release these locks, thereby preserving the seman-tics of mutual exclusion. It is straightforward to handle omp get lock and omp set lock
constructs in a similar manner, though we currently do not support them. The simulator can execute in two modes:
• Interleaved: After the scripter gives control to the threads at the beginning of each region, the order of execution of threads within a region is not controlled. This leads to interleaved execution of events from the different threads simulating an average-case, non-deterministic behavior.
• Pipelined: Beginning with the first thread, each thread simulates the events in its trace file until it encounters a synchronization point and then passes control to the next thread. Thus, the order of simulation of events is controlled. This mode results in forced sequentially ordered execution of the events from each thread with round-robin scheduling of thread execution simulating a deterministic behavior.
enters this region, it must execute all the references within the region before another thread is allowed to enter. Since all processors synchronize at the end of the region, a pingponging effect is simulated for the references in a critical section of code. A comparison of results from the interleaved and pipelined modes reflects the extent to which program latency is affected by the non-deterministic orders of execution of OpenMP threads.
... ... A[N−1] Write B[N−1] Read A[N−1] Read A[N/2] Write B[N/2] Read A[N/2] Read #pragma omp parallel
{
#pragma omp for for(i=0; i < N;i++)
{
A[i] = A[i] * B[i];
... ... B[0] Read A[N/2−1] Write A[0] Write B[N/2−1] Read A[N/2−1] Read A[0] Read
Parallel Start Parallel Start
} /* end OpenMP for */ Barrier Exit Synchronize Synchronize
Parallel End Parallel End Synchronize } /* end OpenMP parallel */
Barrier Exit
Activate
Source Code Trace Events Simulator Actions
Accesses A[0],B[0],A[0] ... ... ... A[N/2−1],B[N/2−1],A[N/2−1] ... ... ... Simulate Simulate Accesses OpenMP Thread 0 OpenMP Thread 1 Simulator Thread 0 Simulator Thread 1
Activate
Synchronize Deactivate A[N/2],B[N/2],A[N/2]
A[N−1],B[N−1],A[N−1]
Figure 2.1: Illustration: Trace Events and Simulator Actions
Example: Figure 2.1 shows the trace events and simulator actions for a simple OpenMP program with two active OpenMP threads. Aand Bare shared arrays of size N, and iis a local variable. Static loop scheduling is assumed for the OpenMP forloop. The entry into the parallel OpenMP region is logged as a trace event and causes the simulator to activate two driver threads. Accesses generated by each OpenMP thread to the A and
B arrays are logged separately. The driver threads simulate these accesses in parallel, as shown. When an OpenMP thread exits from the implicit barrier at the end of theforloop, a barrier exit event is logged for that thread. Detection of a barrier event causes the driver threads to synchronize. Another synchronization takes place when theparallel end
For each thread, the address of the memory access is mapped to the unique machine instruction location that generated that access. The access address is also mapped to the language-level data structure to which it belongs. These mappings allow us to tag cache access and coherence statistics with higher level abstractions, such as line numbers and source code data structure identifiers.
2.2.3 Coherence Simulation
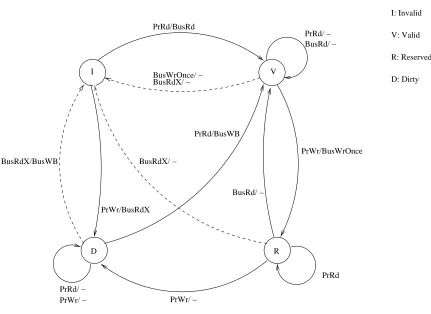
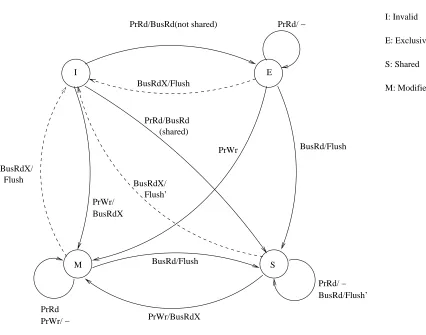
The ccSIM component is a multiprocessor multi-level memory hierarchy simulator (for offline analysis). It has been modeled to simulate a shared-memory multiprocessor architecture. For our experiments, the memory hierarchy simulated is that of the Power3 processor. Each processor has an L1 and L2 cache. The number of levels of cache is a configurable parameter in the configuration input file. Goodman’s write-once protocol [12] has been implemented to maintain cache coherence. This is a write-back invalidate-based snoopy cache coherence protocol. The transitions in this protocol can be mapped to the transitions in the MESI protocol of the Power3 processor [26] as shown in Table 2.1. Figure 2.2 is the state transition diagram for the write-once protocol and Figure 2.3 depicts the transitions for the MESI protocol.
Table 2.1: Mapping transitions of Write-Once protocol to MESI protocol Write-Once Transitions MESI Transitions
V → I E → I
S → I
R → I M → I
D→ I
I V D R PrRd PrRd/BusRd PrWr/BusRdX PrWr/BusWrOnce PrRd/ − BusRd/ − BusWrOnce/ − BusRdX/ − BusRdX/ − BusRd/ − PrWr/ − PrRd/ − PrWr/ − BusRdX/BusWB PrRd/BusWB I: Invalid V: Valid R: Reserved D: Dirty
Figure 2.2: State Transitions for the Write-Once Protocol
The cache simulator accepts a file specifying the cache configuration parameters as input. The configurable parameters include the number of cache levels and, for each level, the set-associativity, set size, number of sets and the line-size.
I E S M PrRd/BusRd(not shared) PrWr/ BusRdX BusRd/Flush BusRdX/Flush BusRd/Flush’ PrWr/BusRdX PrRd BusRdX/ Flush Flush’ BusRdX/ PrRd/ − PrRd/ − PrWr/ − PrRd/BusRd (shared) BusRd/Flush PrWr I: Invalid E: Exclusive S: Shared M: Modified
Figure 2.3: State Transitions for the MESI Protocol
2.2.4 Metrics
A key metric for the identification of memory performance bottlenecks in a mul-tiprocessor system is the number of invalidates to lines in the lowermost level of cache of each processor. This is a major source of coherence traffic, potentially causing the shared bus to be a bottleneck in a symmetric multiprocessor architecture. These invalidates could lead to coherence misses, thus increasing memory latency. An increasing number of inval-idates leading to coherence misses can greatly hamper performance. The main motivation in reducing the invalidate traffic is to decrease the number of coherence misses. Hence, classifying misses in a processor is imperative. This will help in determining if efforts to minimize invalidations caused might be beneficial in reducing the number of misses, thus improving application performance. The ability to identify coherence misses in the multi-level memory hierarchy has been incorporated in ccSIM. A coherence miss is caused if the cache line referenced would have resulted in a hit in cache if it had not been invalidated by another processor.
Invalidates to cache lines can further be classified as true-sharing invalidates and false-sharing invalidates in each level of cache. True-sharing invalidates arise from accesses to the same shared memory location by more than one processor, with at least one access being a write access. False-sharing invalidates are caused due to accesses to different memory locations that map to the same cache line on more than one processor. This level of classification gives a better view of the causes of the invalidates, which helps in determining the applicability of various techniques for optimization. True-sharing invalidates represent inherent communication and are a characteristic of the parallel application. False-sharing invalidates are dependent on the architectural configuration, and granularity of coherence and data allocation in the cache hierarchy.
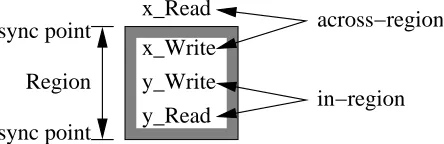
With respect to OpenMP parallel programs, another level of classification can be introduced, which is instrumental in determining the feasibility of using certain opti-mization techniques to reduce the coherence traffic. This involves determining whether the invalidates to cache lines occur due to references across synchronization points or between synchronization points in a parallel program (Figure 2.4).
References across processors leading to true sharing invalidates within a region can be distinguished into two classes:
single/multiple-y_Write y_Read Region sync point sync point x_Write x_Read across−region in−region
Figure 2.4: Classification of Invalidates
reader scenario where one processor writes to a common location and one or more processors read from it.
• References protected by locks: Typically occurs in the multiple-writer, single/multiple-reader scenario where multiple processors write and read from a common location.
While determining opportunities for optimization, it should be noted that invali-dates arising from references within a region are immediate targets for consideration. In this case, it is interesting to explore different orders of interleaved execution between processors and observe the effect on the metrics obtained from the simulation. On the other hand, true-sharing invalidates caused by references across synchronization points are inherent to the parallel application.
In addition to these metrics, the simulator also generates per-processor statistics for hits, misses, temporal and spatial locality, and eviction-related information. It is ex-tremely beneficial to maximize temporal and spatial locality of data, thus increasing the number of hits to resident cache lines and potentially reducing program latency caused by the need to fetch non-resident blocks into cache. Evictor information assists us in locating conflicting cache lines, which may lead to conflict misses. Evictions and locality are highly interrelated metrics. A reduction in the number of evictions is likely to result in improved temporal and spatial locality. Hence, these metrics are also extremely valuable in locating potential bottlenecks in the program.
Chapter 3
Experimental Setup
Experiments were performed with these seven OpenMP benchmarks: Equation Solver kernel, Equation Solver with red-black method, the Non-Bonded Force kernel [13], and four benchmarks from the NAS OpenMP benchmark suite - IS, MG, CG, FT [19]. The traces obtained and the simulations performed are for a 4-way SMP architecture.
3.1
Characterization Metrics
For each benchmark, the following sets of metrics are recorded per-processor:
1. The proportion of coherence misses contributing to the total misses in each level of cache;
2. The total number of invalidates caused, the number of true-sharing invalidates and the number of false-sharing invalidates in each level of cache;
3. The classification of the aggregate invalidates intoin-region true-sharing invalidates, across-region true-sharing invalidates,in-region false-sharing invalidates and across-region false-sharing invalidates in each level of cache;
3.2
Platform
The Hardware Performance Monitor Toolkit[9] version 2.4.2 was used for col-lecting hardware counter statistics. HPM metrics were obtained by executing the bench-marks on 4 processors of a single 4-way node of an IBM SP RS/6000 Winterhawk-II system with Power3-II processors. Dedicated access to the processors was requested in the command file in order to avoid interference and cache effects due to other appli-cations. The Power3 processor has a set of 8 hardware counters, which record various events. The hardware counter metric used for our validation experiments is the number of invalidates to the lines in the L2 cache. Therefore, the events of interest to us are PM SNOOP L2 E OR S TO I and PM SNOOP L2 M TO I, which represent the snoop-based L2 transitions from E or S to I state and the snoop-snoop-based L2 transitions from M to I state, respectively.
The IBM OpenMP compilers, xlc r for OpenMP C and xlf r for OpenMP Fortran, were used to compile the benchmarks. The compile options used were: -qarch=auto,
-qsmp=omp, -qnosave and the default optimization level, O2.
3.3
Experimental Methodology
In case of the HPM metrics, an average of the values from several runs was con-sidered. Table 3.1 shows the mean and the confidence interval of the HPM values measured for each benchmark.
Table 3.1: Mean and Confidence Interval for Total L2 Invalidates from HPM Benchmark Mean Confidence Interval
EQS 2749 2749 ±71.5
EQS (Red-Black) 858 858±32.3
IS 6959 6959±531.53 MG 17829.78 17829.78±1238.17 CG 114523.5 114523.5±807.16 FT 369082 369082 ±9412.55 NBF 157560.3 157560.3±4076.31
and a 8MB direct-mapped L2 cache. The TLB is not simulated.
3.4
Benchmarks / Applications
We utilized the OpenMP version of the following benchmarks:
1. Equation Solver Kernel (EQS with Stencil): This kernel solves a simple partial dif-ferential equation on a grid using a finite differencing method. Each interior element is computed using its value and the values of its four neighboring elements. This is done iteratively until convergence. The equation solver kernel is used in applications like Ocean, which is part of the SPLASH benchmark suite [30].
2. Equation Solver Kernel (EQS-RB with Red-Black): This is a modified version of EQS. The grid points are alternately assigned as red and black points.
3. IS [19]: It performs a large integer sort that is used in “particle method” codes.
4. MG [19]: This benchmark uses a V-cycle MultiGrid method to compute the solution of the 3-D scalar Poisson equation.
5. CG [19]: The kernel uses a Conjugate Gradient method to compute an approximation to the smallest eigenvalue of a large, sparse, unstructured matrix.
6. FT [19]: It contains the computational kernel of a 3-D fast Fourier Transform (FFT)-based spectral method.
7. Non-Bonded Force Kernel: This represents the kernel of a Molecular Dynamics sim-ulation. It computes non-bonded forces due to interactions between molecules. The NBF kernel is a part of GROMOS [13].
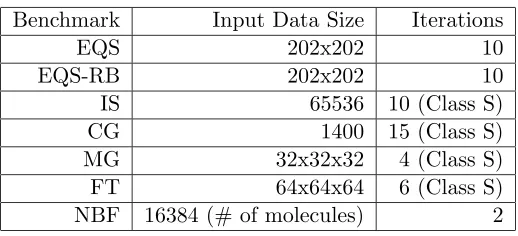
Table 3.2: Input data sizes for each benchmark
Benchmark Input Data Size Iterations
EQS 202x202 10
EQS-RB 202x202 10
IS 65536 10 (Class S)
CG 1400 15 (Class S)
MG 32x32x32 4 (Class S)
FT 64x64x64 6 (Class S)
Chapter 4
Results and Analysis
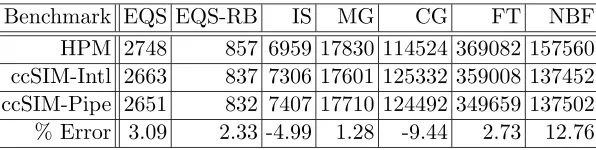
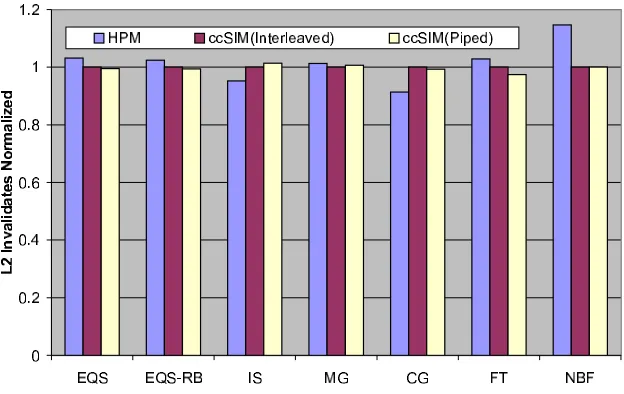
The total number of L2 invalidates obtained from ccSIM in both modes of execu-tion were validated against the total number of L2 invalidates obtained from the hardware counters using HPM for each benchmark. The results for this set of experiments are sum-marized in Table 4.1. The error percentage is reported for the values from the interleaved mode of the simulator with respect to the HPM values recorded. Figure 4.1 provides a visual comparison for these validation experiments. In this plot, the statistics for the interleaved mode of the simulator have been normalized to one for all benchmarks.
Table 4.1: HPM on Power3 vs. ccSIM
Benchmark EQS EQS-RB IS MG CG FT NBF
HPM 2748 857 6959 17830 114524 369082 157560 ccSIM-Intl 2663 837 7306 17601 125332 359008 137452 ccSIM-Pipe 2651 832 7407 17710 124492 349659 137502 % Error 3.09 2.33 -4.99 1.28 -9.44 2.73 12.76
Figure 4.1: L2 Invalidates: HPM vs. ccSIM
synchronized at OpenMP synchronization points such as barriers, but not within a region delimited by consecutive synchronization points. In the next section, it will be shown that ordering of accesses for simulationdoes matter between critical sections.
4.1
Modes of Simulation
So far, we have considered simulation across synchronization points and concluded that loosely coupled simulations capture the actual coherence traffic. Here, we will consider the handling of critical sections inside parallel section, as found in the NBF benchmark. Recall from Section 2.2 that execution in critical sections is treated as a “pingpong” serial-ization: Only one trace may proceed in its entirety within a critical section. Upon unlocking, a synchronization is forced, which allows a blocked thread simulating another processor to enter its critical section and so on. Hence, we ensure the execution of one critical section per processor before resuming past the barrier point to reflect SPMD behavior. In the following, results were obtained without “pingpong”,i.e., we do not consider the exit point of an OpenMP criticalconstruct to be a synchronization point.
Figure 4.2: L2 Invalidates comparison: NBF
closer match of the actual behavior (HPM on the Power3) is observed with “pingpong”. Figure 4.3 depicts the statistics for in-region true-sharing invalidates with and without simulation of pingpong serialization in critical sections. Metrics are plotted on a log scale. The number of true-sharing invalidates occurring within a region is much higher (at least an order of a magnitude) when pingponging is simulated, which contributes in large part to the accuracy of simulations. This demonstrates the necessity of pingpong serialization in simulations. Next, we consider the results for the benchmarks and general trends for the benchmark suite.
4.2
Characterization of Benchmarks
Figure 4.3: NBF: with and without pingpong
4.2.1 MG
can further classify in-region invalidates into two classes: Those due to references within a critical section (while holding a lock) and those outside of critical sections (without holding a lock). Figure 4.4(d) indicates that in-region true-sharing invalidates are due to accesses without locks. Finally, not all invalidates may lead to subsequent misses, but ccSIM allows us to determine if an invalidate is followed by a miss, as depicted in Figure 4.4(e). The percentage of invalidates leading to misses is significant (around 50–70%) in the L1 cache and very high (approximately 95%) in the L2 cache.
4.2.2 CG
Figures 4.5(a) to 4.5(e) depict the results for CG. Figure 4.5(a) illustrates that most of the misses in the L1 cache are uniprocessor misses; however, in the L2 cache, a very high percentage of misses are caused due to invalidates to shared data. The total number of misses, the number of coherence misses and the number of invalidates across processors is almost uniform. Most invalidates are due to true sharing, as seen in Figure 4.5(b). This is caused by references across regions (see Figure 4.5(c)) while any in-region true sharing is due to accesses without locks depicted in Figure 4.5(d). False-sharing invalidates mainly occur due to references across regions. 90% of the invalidates in L1 cache and 99% of the invalidates in L2 cache result in misses in the correponding levels of the memory hierarchy (see Figure 4.5(e)).
4.2.3 IS
(a) Misses (b) Invalidates
(c) Region-wise Classification of Invalidates (d) In-Region True-Sharing Invalidates
(e) Invalidates causing Misses
(a) Misses (b) Invalidates
(c) Region-wise Classification of Invalidates (d) In-Region True-Sharing Invalidates
(e) Invalidates causing Misses
(a) Misses (b) Invalidates
(c) Region-wise Classification of Invalidates (d) In-Region True-Sharing Invalidates
(e) Invalidates causing Misses
4.2.4 FT
Figures 4.7(a) to 4.7(e) depict the results for FT. Figure 4.7(a) shows that L2 coherence misses are the cause of 55–68% of misses at this level. These are mainly caused by true-sharing invalidates resulting from references across regions. Invalidates caused due to false-sharing contribute to a very low percentage of total invalidates, as depicted in Figure 4.7(b). False sharing dominates across regions (Figure 4.7(c)) while true sharing within regions is due to accesses without locks 4.7(d). The behavior of this benchmark with respect to the considered metrics is uniform across processors. The percentage of total invalidates that cause coherence misses is between 60 and 70% in the first level of cache and 91–93% in the second level of cache (see Figure 4.7(e)).
4.2.5 EQS
The statistics recorded for the equation solver kernel are shown in Figures 4.8(a) to 4.8(e). It can be seen from Figure 4.8(a) that misses in the first level of cache are not caused by coherence. These are predominantly uniprocessor misses. Coherence contributes to 4–27% of misses in the L2 cache across other processors. Processor 1 incurs a higher number of misses (Figure 4.8(a)) and a significantly greater number of invalidates in the second level of cache (Figure 4.8(b)) when compared to the other processors. In Figure 4.8(c) it is observed that these invalidates in processor 1 are caused across regions. The large number of invalidates in Processor 1 is due to the initialization of the entire shared global data structure by this processor. In the other processors, invalidates occur across as well as within regions. A very small number of false-sharing invalidates is seen. The in-region true-sharing invalidates are not protected by locks (Figure 4.8(d)). From Figure 4.8(e) it can be inferred that 90–98% of invalidates in the L2 cache cause coherence misses in processors 2, 3 and 4. In the L1 cache, this effect of invalidates on misses is not seen.
4.2.6 EQS-RB
(a) Misses (b) Invalidates
(c) Region-wise Classification of Invalidates (d) In-Region True-Sharing Invalidates
(e) Invalidates causing Misses
(a) Misses (b) Invalidates
(c) Region-wise Classification of Invalidates (d) In-Region True-Sharing Invalidates
(e) Invalidates causing Misses
a larger number of invalidates and coherence misses than processors 1 and 4. From this, we can conclude that in processors 2 and 3, the degree of sharing of global data is greater than in the others. Processor 4 has a negligible number of invalidates in the L1 cache as compared to the others(Figure 4.9(b)). Figure 4.9(c) shows that in all processors, true-sharing invalidates, which dominate the invalidate traffic, are mainly caused across regions. A small number of lines is invalidated due to false-sharing. Only few in-region true-sharing invalidates (without lock) are observed, as seen in Figure 4.9(d). Figure 4.9(e) shows that approximately 95% of the invalidates in the L2 cache lead to misses, however, this effect is not seen in the first level of cache.
For all benchmarks, with the exception of NBF, we observe similar trends in the ratio between total misses and coherence misses and the ratio between L1 and L2 misses. We find that true-sharing invalidates dominate with these highly tuned benchmarks and, within these, most accesses cross regions. The remaining in-region accesses occur without locks. Finally, a large portion of invalidates, particularly in L2, will subsequently result in a coherence miss.
4.2.7 NBF
(a) Misses (b) Invalidates
(c) Region-wise Classification of Invalidates (d) In-Region True-Sharing Invalidates
(e) Invalidates causing Misses
1 has a lower number of total misses as compared to the other processors. The behavior with respect to the other statistics is similar across processors. In all processors, 95% of the invalidates result in coherence misses in both levels of cache (shown in Figure 4.10(e)). The coherence results obtained for NBF indicate opportunities for optimizations with respect to in-region true-sharing with locks (critical sections), but only more detailed simulation can provide conclusive information to determine beneficial transformations.
4.3
Per-Reference Statistics
In this section, per-reference statistics obtained for the NBF benchmark are pre-sented and analyzed. These values are shown for each processor and in each level of cache in Tables 4.2 to 4.9.
Table 4.2: NBF(Data Structures): Processor1 L1cache
Ref CohMiss InRegTSInv AcrRegTSInv InRegFSInv AcrRegFSInv
f Read 30706 23735 0 0 8456
f Write 0 23735 0 0 8456
Table 4.3: NBF(Data Structures): Processor1 L2cache
Ref CohMiss InRegTSInv AcrRegTSInv InRegFSInv AcrRegFSInv
f Read 31677 23735 7936 1 1001
x Read 768 0 1532 0 6
f Read 384 56 200 0 0
f Write 0 56 200 2 0
f Write 0 23735 7936 1 1000
(a) Misses (b) Invalidates
(c) Region-wise Classification of Invalidates (d) In-Region True-Sharing Invalidates
(e) Invalidates causing Misses
Table 4.4: NBF(Data Structures): Processor2 L1cache
Ref CohMiss InRegTSInv AcrRegTSInv InRegFSInv AcrRegFSInv
f Read 30705 25856 0 0 6470
f Write 0 25856 0 0 6470
Table 4.5: NBF(Data Structures): Processor2 L2cache
Ref CohMiss InRegTSInv AcrRegTSInv InRegFSInv AcrRegFSInv
f Read 31656 25856 6083 0 762
x Read 768 4 1534 0 2
f Read 414 73 183 0 0
f Write 0 73 183 2 0
f Write 0 25856 6083 0 762
Table 4.6: NBF(Data Structures): Processor3 L1cache
Ref CohMiss InRegTSInv AcrRegTSInv InRegFSInv AcrRegFSInv
f Read 30701 23180 0 0 8970
f Write 0 23180 0 0 8970
Table 4.7: NBF(Data Structures): Processor3 L2cache
Ref CohMiss InRegTSInv AcrRegTSInv InRegFSInv AcrRegFSInv
f Read 31669 23180 8451 1 1050
x Read 768 2 1534 0 4
f Read 370 58 198 0 0
f Write 0 23180 8451 1 1050
f Write 0 58 198 2 0
of invalidates and coherence misses in L2 cache.
With this detailed information, one can conclude thatf is the cause of coherence-related bottlenecks during the execution of the NBF benchmark. Optimizations could be implemented to reduce the latency caused by this data structure, and ccSIM can be used to verify if improvements in performance are obtained. A reduction in the in-region true-sharing invalidates caused to data structuref could potentially reduce the number of coherence misses, leading to improved performance.
Table 4.8: NBF(Data Structures): Processor4 L1cache
Ref CohMiss InRegTSInv AcrRegTSInv InRegFSInv AcrRegFSInv
f Read 30710 25533 0 0 6774
f Write 0 25533 0 0 6774
Table 4.9: NBF(Data Structures): Processor4 L2cache
Ref CohMiss InRegTSInv AcrRegTSInv InRegFSInv AcrRegFSInv
f Read 31628 25533 6357 0 809
x Read 768 2 1534 0 4
f Read 408 106 150 0 0
f Write 0 106 150 2 0
f Write 0 25533 6357 0 809
4.4
Opportunities for Transformations
In this section, we demonstrate how ccSIM can be used to detect and isolate coherence traffic bottlenecks, and we derive opportunities for transformations leading to reduced coherence traffic and, thereby, potential performance gains. For illustration, we use the NBF kernel described in the previous section. A full access trace was obtained for the OpenMP NBF kernel. The OpenMP environment was set to four threads and static scheduling (OMP NUM THREADS = 4, OMP SCHEDULE STATIC).
4.4.1 Analysis
(a) Break-down of misses for each processor
(b) Comparison of Invalidates with Coherence Misses
Figure 4.11: Overall metrics for NBF
coherence misses cause significant coherence traffic, affecting the scalability and throughput of the application.
We have now detected that a coherence bottleneck exists. We can use the per-reference coherence and cache statistics generated by ccSIM to determine the causeof the bottleneck. Table 4.10 shows the per-reference statistics on processor one for the three major references for the original code and two optimization strategies (serialized and round-robin) discussed in the following. Only L2 cache statistics are shown.
We observe that access metrics across all processors are uniform. Thef Read
Table 4.10: Comparison of per-reference statistics for each optimization strategy
Invalidations
Line Ref Optimization Misses Miss % Coherence True False
No. Strategy Ratio Misses Total In Across In Across
Region Region Region Region 166 f Read Original 31100 0.99 96.78% 31101 24389 5874 0 838 Serialized 2050 1.0 50.30% 2048 2048 0 0 0 Round-robin 2050 0.87 43.01% 2048 6 2042 0 0 132 x Read Original 1540 0.35 49.87% 1538 2 1536 0 0 Serialized 1540 0.35 49.87% 1538 0 1538 0 0 Round-robin 1540 0.35 49.87% 1538 0 1532 0 6 309 f Read Original 383 0.74 100% 256 52 204 0 0 Serialized 512 1.0 100% 256 0 256 0 0 Round-robin 512 1.0 100% 256 0 255 0 1
Moreover, more than 95% of the misses for this reference are coherence misses. The
invali-dation data shows that the large number ofin-region invalidates are the primary cause for
these misses. The relation of this reference to the source code indicates that line 166 is of
interest:
#pragma omp parallel ...
for (i = 0; i < natoms; i++) { #pragma omp critical
f[i] = f[i] + flocal[i]; }
The for loop updates the global shared array fwith values from the local private copy flocal for each OpenMP thread. The large number of invalidations attributed to
f Readreference is due to the ping-ponging of the shared farray between processors as all of them try to update the global farray simultaneously.
4.4.2 Optimizing Transformations
We have isolated the coherence bottleneck to the updates of the shared global array
f. We shall discuss two ways of reducing the number of coherence misses. One method
they require mutually exclusive writes. This is achieved by moving the critical section to
encompass the entire for loop instead of the single update. The modified code is shown
below.
#pragma omp parallel ...
#pragma omp critical
for(i = 0; i < natoms; i++) { f[i] = f[i] + flocal[i]; }
Moving thecriticalstatement outside the loop also reduces the number of times that the mutual exclusion region must be entered and exited, decreasing the execution overhead. Table 4.10 indicates that the total number of misses and invalidates has decreased over an order of a magnitude as a result forf Readon line166. Half of the overall misses are due to coherence misses, and all coherence misses are now in-region due to the placement of the critical section.
Although this reduces the number of coherence misses, the above method does not exploit the potential for parallel updates to separate parts of the f array by different threads. Hence, we consider an alternate transformation. We can exploit parallelism by partitioning the arrayfinto number of segments. Each thread updates a distinct segment until all segments are updated. We call this scheme the round-robin update scheme. The modified code is shown below as pseudocode.
i=0;
for each thread {
1. segment_number = i + thread_id; 2. update segment
3. synchronize w/ other threads (barrier) 4. i = (i+1) MOD max_segments
}//run till all segments are updated
Table 4.10 indicates that forf Readon line166, the round-robin barrier approach results in identical reductions in the total number of misses and invalidates as seen in the serialized version. But now, coherence misses are across-region due to the placement of the barrier (except for six startup references).
Figure 4.12: Coherence Misses (Transformed)
and are very similar for the other processors. In the original code, the f Read reference was the most significant cause of coherence misses. Both optimization strategies discussed above drastically reduce the coherence misses for this reference, thereby decreasing the total number of coherence misses by an order of magnitude. Table 4.11 depicts the wall-clock execution time (a) for the routine that updates the shared arrayf, (b) for the remainder and (c) for the entire program. We observe that the transformations radically reduce execution time. For both the serialized and round-robin schemes, 3 milliseconds are spent in the update routine vs. close to 5 seconds prior to the transformations. These savings are the combined result of reductions in coherence traffic and reduced overhead for OpenMP runtime calls. The overall savings are marginally higher for the serialized version as opposed to the round-robin updates with barriers. We attribute these difference to slight variations outside of the transformed code section.
Table 4.11: Wallclock Times (Seconds) Code Original Serialized Round-robin Segment
Chapter 5
Related Work
Analyzing causes of inefficiencies in utilizing the memory hierarchy has been a popular area of research. The approaches range from detailed simulation of hardware models in order to derive inferences about the hardware-software interaction to program analysis and optimization techniques on the software side.
Trace-driven and execution-driven approaches are used for modeling memory sys-tem performance for uniprocessors and multiprocessors. A framework typically consists of an instrumenting tool which is used in collaboration with a memory hierarchy simulator to provide details of program performance on hardware. Cache simulators are associated with particular instrumentation tools depending on the type of input that they process.
DineroIV [15] and Tycho [16] are trace-driven uniprocessor cache simulators. Diner-oIV simulates multilevel caches, classifies misses and mainly provides hit and miss infor-mation. Timing is not simulated. Tycho simulates various uniprocessor cache designs simultaneously to evaluate tradeoffs. CPROF [20] is a cache profiler which relates cache misses to the source code and data structures.
Among other simulators, SimOS [27] is a complete machine simulator for unipro-cessor and multiprounipro-cessor systems, while RSIM [18] simulates instruction-level parallelism and a great level of detail in hardware. MTool [11] is also a useful tool for shared memory multiprocessors, but it does not have the ability to relate metrics to data structures.
MemSpy [22], which is built over the TangoLite trace collector [14] associates statistics obtained through simulation with data structures in source code. Our objectives are similar, though our framework differs in the instrumentation mechanism. MemSpy uses static annotation of source code, while we use dynamic instrumentation.
Interfaces like VTune [7] on Intel x86 platforms, PAPI [3] and the HPM toolkit [9] are now available to access hardware performance counters on several platforms. These counts, which reflect hardware events, provide only cumulative statistics. Also, a limited number of events are available and only certain events can be tracked simultaneously.
With regard to shared memory parallel programs, synchronization and scheduling overheads in OpenMP have been quantified [5], implementation of OpenMP constructs on various platforms has been investigated [2] and performance characteristics of OpenMP benchmarks have been analyzed [1]. An interesting approach to performance analysis was pursued by instrumenting the SMP system interconnect to observe and record hardware activity [25]. OMPtrace is a tool that dynamically instruments OpenMP applications and derives metrics from hardware counters [10]. Optimization techniques have been explored at various levels. Hu et al. illustrate the effectiveness of data reordering in improving the performance of fine-grained irregular benchmarks on different platforms [17]. Recent work includes development of various techniques for compiler optimization of applications [28].
Chapter 6
Conclusions and Future Work
In this thesis, ccSIM, a simulator to assist in detection of memory performance bottlenecks in OpenMP programs on SMP architectures was introduced. ccSIM is driven by traces obtained through on-the-fly dynamic binary rewriting of OpenMP programs execut-ing on an SMP node. It performs simulation of memory references for a specified multilevel memory hierarchy configuration for shared memory multiprocessor systems. A threaded model of simulation is employed, in which threads representing processors execute in par-allel. Significant coherence-related metrics are generated by simulation of coherence traffic. Results from interleaved orders of execution were recorded and analyzed. In addition to aggregate metrics for the application, detailed information is provided on a per-reference basis, relating all statistics to data structures in source code. This is an important contri-bution in terms of isolating exact locations in the code that contribute to overall program latency. When this is achieved, it can be determined if these bottlenecks could be eliminated or reduced by code transformations. Optimization techniques may be proposed based on the comprehensive statistics generated.
Experiments were performed for various OpenMP benchmarks and the results obtained were validated against statistics obtained from hardware performance counters on the architecture of interest. The comparison showed good accuracy of simulation. For one benchmark, the per-reference statistics were discussed and analyzed.
METRIC, provides a useful framework to achieve this goal.
Bibliography
[1] V. Aslot and R. Eigenmann. Performance Characteristics of the SPEC OMP2001 Benchmarks. InProceedings of the European Workshop on OpenMP (EWOMP2001), 2001.
[2] R. Berrendorf and G. Nieken. Performance Characteristics for OpenMP Constructs on Different Parallel Computer Architectures. InProceedings of First European Workshop on OpenMP, September 1999.
[3] S. Browne, J. Dongarra, N. Garner, and P. Mucci. A Portable Programming Interface for Performance Evaluation on Modern Processors. The International Journal of High Performance Computing Applications, 14(3):189–204, Fall 2000.
[4] Bryan Buck and Jeffrey K. Hollingsworth. An API for Runtime Code Patching. The International Journal of High Performance Computing Applications, 14(4):317–329, Winter 2000.
[5] J. M. Bull. Measuring Synchronisation and Scheduling Overheads in OpenMP. In Proceedings of the European Workshop on OpenMP (EWOMP1999), 1999.
[6] Rohit Chandra, Ramesh Menon, Leo Dagum, David Kohr, Dror Maydan, and Jeff McDonald. Parallel Programming in OpenMP. Morgan Kaufmann Publishers, Los Al-tos, CA 94022, USA, 2000. http://www.mkp.com/books catalog/catalog.asp?ISBN=1-55860-671-8.
[7] Intel corporation. VTune Performance Analyzer. http://developer.intel.com/
vtune/analyzer/index.htm.
[9] L. DeRose. The Hardware Performance Monitor Toolkit. InProceedings of Euro-Par, pages 122–131, August 2001.
[10] J. Caubet et al. A Dynamic Tracing Mechanism for Performance Analysis of OpenMP Applications. In Workshop on OpenMP Applications and Tools(WOMPAT), 2001.
[11] A. Goldberg and J. Hennessy. Performance Debugging Shared Memory Multiproces-sor Programs with MTOOL. In Proceedings of Supercomputing ’91, pages 481–490, November 1991.
[12] J. R. Goodman. Using cache memory to reduce processor-memory traffic. In Proceed-ings of the 10th International Symposium on Computer Architecture, pages 124–131, June 1983.
[13] W. Gunsteren and H. Berendsen. GROMOS: GROningen MOlecular Simulation soft-ware. TR, Laboratory of Physical Chemistry, University of Groningen, 1988.
[14] S. A. Herrod. TangoLite: A Multiprocessor Simulation Environment, 1994.
[15] M. Hill and J. Elder. Dinero IV Trace-Driven Uniprocessor Cache Simulator, 1998. http://www.cs.wisc.edu/ markhill/DineroIV/.
[16] M.D. Hill. Tycho. Unpublished UNIX-style manual page. The Tycho simulator is available from Prof. Mark Hill, Computer Sciences Dept., University of Wisconsin.
[17] Y. C. Hu, A. Cox, and W. Zwaenepoel. Improving Fine-Grained Irregular Shared-Memory Benchmarks by Data Reordering. InProceedings of SC2000, November 2000.
[18] C. Hughes, V. Pai, P. Ranganathan, and S. Adve. Rsim: Simulating Shared-Memory Multiprocessors with ILP Processors. IEEE Computer, 35(2):40–49, February 2002.
[19] H. Jin, M. Frumkin, and J. Yan. The OpenMP Implementations of NAS Parallel Benchmarks and Its Performance. TR NAS-99-011, NASA Ames Research Center, October 1999.
[21] J. Marathe, F. Mueller, T. Mohan, B. R. de Supinski, S. A. McKee, and A. Yoo. METRIC: Tracking Down Inefficiencies in the Memory Hierarchy via Binary Rewriting. In International Symposium on Code Generation and Optimization, pages 289–300, March 2003.
[22] M. Martonosi, A. Gupta, and T. Anderson. MemSpy: Analyzing memory system bottlenecks in programs. In Proceedings of the 1992 ACM SIGMETRICS Conference on Measurement and Modeling of Computer Systems, pages 1–12, June 1992.
[23] J. Mellor-Crummey, R. Fowler, and D. Whalley. Tools for Application-Oriented Perfor-mance Tuning. In International Conference on Supercomputing, pages 154–165, June 2001.
[24] A.-T. Nguyen, M. Michael, A. Sharma, and J. Torrellas. The Augmint Multiprocessor Simulation Toolkit: Implementation, Experimentation and Tracing Facilities. InIEEE International Conference on Computer Design: VLSI in Computers and Processors, pages 486–491, Washington, October 1996. IEEE Computer Society.
[25] L. Noordergraaf and R. Zak. SMP System Interconnect Instrumentation for Perfor-mance Analysis, 2002. citeseer.nj.nec.com/noordergraaf02smp.html.
[26] F. P. O’Connell and S. W. White. POWER3: The Next Generation of PowerPC Processors. IBM Journal of Research and Development, 44(6):873–884, 2000.
[27] Mendel Rosenblum, Stephen A. Herrod, Emmett Witchel, and Anoop Gupta. Complete Computer System Simulation: The SimOS Approach. IEEE Par-allel and Distributed Technology: Systems and Applications, 3(4):34–43, Winter 1995. http://www.computer.org/concurrency/pd1995/p4034abs.htm; http://dlib.computer.org/pd/books/pd1995/pdf/h40034.pdf.
[28] Shigehisa Satoh, Kazuhiro Kusano, and Mitsuhisa Sato. Compiler optimization tech-niques for OpenMP programs. Scientific Programming, 9(2-3):131–142, 2001.
[29] J. Seward and N. Nethercote. Valgrind, version 2.0.0. http://developer.kde.org/
~sewardj/docs-1.9.5/manual.html.