P R O C E E D I N G S
Open Access
Evaluating the concordance between sequencing,
imputation and microarray genotype calls in the
GAW18 data
Ally Rogers
1, Andrew Beck
2, Nathan L Tintle
1*From
Genetic Analysis Workshop 18
Stevenson, WA, USA. 13-17 October 2012
Abstract
Genotype errors are well known to increase type I errors and/or decrease power in related tests of genotype-phenotype association, depending on whether the genotype error mechanism is associated with the genotype-phenotype. These relationships hold for both single and multimarker tests of genotype-phenotype association. To assess the potential for genotype errors in Genetic Analysis Workshop 18 (GAW18) data, where no gold standard genotype calls are available, we explored concordance rates between sequencing, imputation, and microarray genotype calls. Our analysis shows that missing data rates for sequenced individuals are high and that there is a modest amount of called genotype discordance between the 2 platforms, with discordance most common for lower minor allele frequency (MAF) single-nucleotide polymorphisms (SNPs). Some evidence for discordance rates that were different between phenotypes was observed, and we identified a number of cases where different technologies identified different bases at the variant site. Type I errors and power loss is possible as a result of missing genotypes and errors in called genotypes in downstream analysis of GAW18 data.
Background
Over the past decade, a large body of literature has been amassed related to genotype errors for SNP microarrays. We now have a clear understanding of the prevalence of such errors and of many potential sources of the errors, as well as an understanding of the downstream implications of genotype errors on the type I error rate and power of related single SNP tests of genotype-phenotype association [1]. In particular, nondifferential genotyping errors, that is, errors that are the result of a random process unrelated to the phenotype, decrease power [2-4]. However, differential genotyping errors, errors that occur according to different random processes according to the value of the phenotype, may inflate the type I error rate [5,6]. Additional work has confirmed that similar results hold for analysis of imputed genotypes using standard single-marker tests of genotype-phenotype association [7].
With the advent of next-generation sequencing (NGS), multimarker analysis methods have increased in popular-ity. Recent papers demonstrate similar results (i.e., decreased power and increased type I error for nondiffer-ential and differnondiffer-ential genotyping errors) are true for multimarker tests as well. In particular, for collapsing tests [e.g., [8-10]], the effects of both differential and nondiffer-ential genotyping errors can be exacerbated by the cumu-lative nature of genotyping errors across a set of markers [11,12]. The relationship for particular collapsing tests is anticipated to hold for the larger set of all collapsing (bur-den) and variance components tests based on structural similarities in these classes of tests [13]. To date, large error rates have been observed for sequence data [14-16], much larger than were typical in the early days of SNP microarrays [17]. Thus, there is the potential for substan-tial power loss and inflated type I error for multimarker tests involving NGS data.
For the typical researcher, it is often costly and impracti-cal to invest in large-simpracti-cale quality control studies to obtain study-specific estimates of genotype reliability. However, * Correspondence: [email protected]
1
Department of Mathematics, Statistics and Computer Science, Dordt College, Sioux Center, IA 51250, USA
Full list of author information is available at the end of the article
as was seen in the GAW18 data, it is reasonable to think that as more and more studies sequence existing samples, a typical quality control approach may involve evaluating the concordance between genotypes obtained on the sam-ples using SNP microarrays with genotypes obtained using the new NGS technology. We conducted our analysis using sequencing data (measured with NGS technology or through imputation) and SNP microarray data. After eval-uating the overall concordance levels between genotype calls, we evaluated which types of discordance are most common and the potential for concordance rates, which are related to the phenotype.
Methods
We used the following procedure to evaluate the con-cordance of sequence and microarray data. First, we considered all SNPs for which both sequence and microarray data were available in the distributed GAW18 files by matching SNP identification (rs) num-bers. Prior to our analysis, each set of data went through separate data cleaning pipelines, which included cleaning observed mendelian errors within the pedigrees for both the sequence and microarray data and which are described in detail elsewhere [18]. This yielded a preli-minary data set containing 297,197 SNPs. After elimi-nating SNPs for which the major and minor alleles present at the variant site differed between the 2 tech-nologies (56,741 SNPs), the resulting final analysis data set consisted of 240,456 SNPs, spread across all odd-numbered autosomes. Even-odd-numbered autosomes and sex chromosomes were not part of the GAW18 data release. Next, for each of the 240,456 SNPs in the analy-sis data set, we identified and recorded both the gen-ome-wide association studies (GWAS) and NGS genotypes (including missing) for each of 959 people for whom both GWAS and NGS data was available. The 959 people include 464 individuals who were actually sequenced and 495 individuals for whom sequence data was imputed using MaCH as described elsewhere [18].
Statistical analysis
For each SNP in the analysis we computed a variety of sta-tistics evaluating the concordance between genotype calls on the 3 different platforms (NGS, imputed, and SNP microarray). We started by counting the overall number of concordant and discordant genotypes for sequenced and microarray data. There are 16 possibilities for each indivi-dual-SNP combination: AA-AA, AA-AB, AA-BB, AA-XX, AB-AA, AB-AB, AB-BB, AB-XX, BB-AA, BB-AB, BB-BB, BB-XX, XX-AA, XX-AB, XX-BB, and XX-XX, wherei-j indicates that the individual is identified as genotypeifor sequence data and genotypejfor microarray data. (Note that we use“A”to represent the reference allele for the NGS technology,“B”to represent the nonreference allele
for the NGS technology, and × to represent missing throughout this article.)
In addition to overall concordance, concordance rates were computed conditional on the observed genotype for the microarray technology. Concordance rates were also computed for individuals with different phenotype groups (males vs. females; hypertensive [systolic blood pressure >140 mm Hg or diastolic blood pressure >90 mm Hg at any of 4 exams]; vs. nonhypertensive smokers [self-identified at any of 4 waves] vs. nonsmokers). T-tests were used to compare average concordance rates between technologies and between phenotypes across the set of all SNPs.
Results
Table 1 cross-classifies all 240,456 SNPs for which both SNP microarray and sequence data are available, and which met our initial screening criteria (see Methods for details). Across the 230,597,304 (240,456 SNPs × 959 indi-viduals) possible genotype calls, there are more than 500,00 discordant genotypes (both technologies call a genotype, and the genotypes are different), and more than 5 million genotypes that are missing on at least 1 of the 2 platforms. This means that the overall proportion of discordant genotypes (including missing) is 2.63%, while the proportion of discordant called genotypes is 0.23%.
To gain a better understanding of the distribution of the discordant genotypes noted in Table 1, we computed con-ditional concordance rates (Table 2). In particular, we examined the probabilities that the sequence technology yields each different genotype (or missing) conditional on the genotype identified by the microarray technology. Table 2 provides separate conditional concordance rates for NGS and imputed genotypes.
the site. There is also a strong association between MAF and concordance rates. In particular, SNPs with lower MAF have substantially lower concordance between plat-forms than do SNPs with larger MAFs (detailed results not shown).
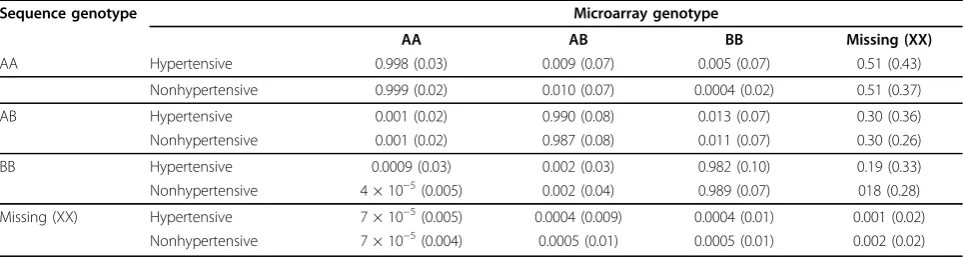
Finally, Table 3 illustrates an analysis comparing the average conditional concordance rates for hypertensive individuals compared to nonhypertensive individuals. The strongest evidence for significant differences (p<2 × 10⁻¹⁶) in average conditional concordance were observed between hypertensive and nonhypertensives for sequence AA or BB given GWAS AA, sequence AA or AB given GWAS AB, and sequence AA, AB, or BB given GWAS BB. Some evidence of differential average conditional con-cordance rates between males and females and smokers and nonsmokers also exists (detailed results not shown).
Discussion
Although most genotypes are the same for both technol-ogies, there are still substantial numbers of discordant genotype pairs. The most common type of discordance comes from missing genotypes on the sequence technol-ogy, which occurred most frequently when the microar-ray technology identified at least 1 reference allele at the variant site. Power loss will occur when genotypes are not called, and so using sequence technology genotypes will, when analyzing single SNPs or sets of SNPs consid-ered in this analysis, yield lower power overall than using microarray genotypes. We note, however, that overall power may still be higher when using sequenced genotypes as our analysis necessarily precludes the inclu-sion of less common SNPs, which are not measured by the microarray technology.
Table 1 Cross-classification of results summed over all SNPs and individuals
Sequence genotype1 Microarray genotype Total
AA AB BB Missing (XX)
AA 117,284,236 58,271 1,309 2,554 117,346,370
AB 101,015 65,584,521 29,302 8,970 65,723,808
BB 6,844 339,856 41,656,995 24,361 42,028,056
Missing (XX) 3,009,304 1,506,621 977,234 5,911 5,499,070
Total 120,401,399 67,489,269 42,664,840 41,796 230,597,304
Table 2 Conditional concordance rates (conditional on microarray genotype; SE in parentheses)
Sequence genotype1 Microarray genotype
AA AB BB Missing (XX)
AA NGS 0.998 (0.03) 0.003 (0.03) 0.004 (0.06) 0.52 (0.36)
Imp 0.998 (0.02) 0.02 (0.11) 0.0006 (0.02) 0.44 (0.46)
AB NGS 0.0009 (0.02) 0.996 (0.04) 0.02 (0.08) 0.30 (0.24)
Imp 0.002 (0.02) 0.980 (0.12) 0.006 (0.06) 0.38 (0.43)
BB NGS 0.0007 (0.02) 0.0006 (0.02) 0.98 (0.10) 0.19 (0.28)
Imp 8 × 10⁻⁵(0.008) 0.003 (0.05) 0.993 (0.07) 0.18 (0.35)
Missing (XX) NGS 8 × 10⁻⁵(0.005) 0.0006 (0.02) 0.0007 (0.01) 0.001 (0.02)
Imp 8 × 10⁻⁵(0.005) 0.0003 (0.009) 0.0004 (0.01) 0.007 (0.07)
Table 3 Conditional concordance rates of hypertensive vs. nonhypertensive individuals (conditional on microarray; SE in parentheses)
Sequence genotype Microarray genotype
AA AB BB Missing (XX)
AA Hypertensive 0.998 (0.03) 0.009 (0.07) 0.005 (0.07) 0.51 (0.43)
Nonhypertensive 0.999 (0.02) 0.010 (0.07) 0.0004 (0.02) 0.51 (0.37)
AB Hypertensive 0.001 (0.02) 0.990 (0.08) 0.013 (0.07) 0.30 (0.36)
Nonhypertensive 0.001 (0.02) 0.987 (0.08) 0.011 (0.07) 0.30 (0.26)
BB Hypertensive 0.0009 (0.03) 0.002 (0.03) 0.982 (0.10) 0.19 (0.33)
Nonhypertensive 4 × 10⁻⁵(0.005) 0.002 (0.04) 0.989 (0.07) 018 (0.28)
Missing (XX) Hypertensive 7 × 10⁻⁵(0.005) 0.0004 (0.009) 0.0004 (0.01) 0.001 (0.02)
Although discordance between called genotypes is less common than with missing genotypes, the amount of discordance (500,000 discordant genotypes; 0.23% overall discordance rate) is still notable. Of particular note are the high proportions of heterozygote (microarray) to nonrefer-ence allele homozygote and refernonrefer-ence allele homozygote (microarray) to heterozygote (sequence) discrepancies; more than 80% of all called genotype discordance is from these 2 types of discrepancies. The conditional discor-dance rates in Table 2 suggest that the majority of the dis-cordance occurs in the imputed sequence (not the NGS sequence) data. Given that the NGS data comes from 60× coverage, the microarray genotype calling pipeline is well established, and the imputation procedure used in the GAW18 data is both novel and complex, we conclude it likely that aspects of the imputation procedure is what yielded the majority of observed discordant genotypes.
It is reasonable to view the conditional discordant genotype rates in Table 2 as conservative estimates of the genotype error rate because, if the technologies are applied independently, the vast majority of genotype errors of each technology will appear in a discordant genotype pair. However, if genotype errors are corre-lated between the 2 technologies (eg, at a particular var-iant site, similar samples are prone to error on both technologies), using the conditional discordant rate as an estimate of the genotype error rate may be substan-tially lower than the true genotype error rate.
As documented for single-marker tests, genotyping errors from the major homozygote to the minor homo-zygote are the most costly (in terms of power loss) [2,4,19]. Recently, Powers et al [11] documented poten-tially large declines in statistical power for collapsing tests in case-control designs, when genotype errors (particularly from more common to less common geno-types) are present, as is the case here. For example, with genotype error rates of 0.2% to 0.5% for more common to less common genotypes (as estimated in Table 2), power loss between 2% and 5% for most collapsing tests will occur. Genotype error rates of up to 2% from less common to more common genotypes have only modest impact on power (<0.5% decline). Because these results were for case-control studies, further research is needed to demonstrate similar effects of genotyping errors on family based collapsing tests. These papers [2,4,11,19] also found that power loss increases as the MAF decreases; because discordance was larger for lower MAF SNPs, power loss will be larger for lower MAF SNPs in GAW18 data. Furthermore, our analysis only considered SNPs with MAF above 5%, as rarer SNPs were not genotyped using the microarray technology. If the trend we observed continues, these SNPs may have even larger error rates and, hence, even more dramatic power loss.
These problems are further compounded when we consider that there was some evidence of differential dis-cordance between phenotypes. Differential disdis-cordance can lead to inflated type I errors; for example, in line with our observation, for collapsing tests, error rates of 0.2% in cases and 0.1% in controls (or vice versa) can inflate the type I error rate from 5% to between 15% and 25% for most tests [5,6,12]. Although quality-control approaches (eg, Q-Q plots) can detect large-scale type I error devia-tions, isolated differential genotyping errors may escape typical quality control and manifest themselves as false positives. To minimize the effect of differential genotyping errors, random assignment of subjects across genotyping laboratories, laboratory assistants and plates should always be practiced. Although the precise cause of the modest differential genotyping errors observed here is unknown, it may be a result of familial aggregation of hypertension and nonrandom assignment of family members to sequencing runs, imputation quality differences between families, or other unmeasured covariates.
We note that our analysis did not consider many of the most egregious inconsistencies: namely, 56,741 SNPs where the allele calls were different. Further analysis is needed to identify whether the allele call differences yield substantially different genotype distributions in the cases and controls between the 2 technologies, or it is simply a matter of exchanging one base for another in the calling algorithms (eg, reverse and forward strand differences between the 2 technologies).
It is likely that, increasingly, sequence and microarray data will be available for the same sample as was the case here. In addition to providing an opportunity to empiri-cally evaluate data quality, as was done here, discordant genotypes present an opportunity to utilize better quality data in downstream analyses. Recently, we showed that, under modest assumptions of independence of the 2 independent genotype mechanisms, a 50-50 weighting strategy of the 2 discordant genotypes should be used in analyses of phenotype-genotype association [20]. Thus, a reasonable choice for the genotype to be analyzed in cases of discordance is the dosage, where dosage = 0.5 is used for major homozygote-heterozygote discordant pairs and dosage = 1.5 is used for heterozygote-minor homozygote pairs. Further work is needed to confirm the optimality of this result for multimarker rare variant tests of association.
Conclusions
here will likely lead to power loss and/or type I errors in downstream analysis, further research is needed to under-stand the impact of errors on tests of association in family based studies using sets of markers. However, it is reason-able to expect that errors and missing data will likely impact the type I and/or power for family based tests as they do for case-control tests.
Competing interests
The authors declare that they have no competing interests.
Authors’contributions
NT designed the overall study, AB created the necessary datasets, AR and NT conducted the statistical analysis, and NT drafted the manuscript. All authors read and approved the final manuscript.
Acknowledgements
This work was funded by the National Human Genome Research Institute (R15HG004543; R15HG006915). We acknowledge the use of the Hope College parallel computing cluster for assistance in data analysis, and the involvement of Alexander Luedtke, Brian Greco, Carolina Alvarez, and Allison Hainline in early phases of this project.
The GAW18 whole genome sequence data were provided by the T2D-GENES Consortium, which is supported by NIH grants U01 DK085524, U01 DK085584, U01 DK085501, U01 DK085526, and U01 DK085545. The other genetic and phenotypic data for GAW18 were provided by the San Antonio Family Heart Study and San Antonio Family Diabetes/Gallbladder Study, which are supported by NIH grants P01 HL045222, R01 DK047482, and R01 DK053889. The Genetic Analysis Workshop is supported by NIH grant R01 GM031575.
This article has been published as part ofBMC ProceedingsVolume 8 Supplement 1, 2014: Genetic Analysis Workshop 18. The full contents of the supplement are available online at http://www.biomedcentral.com/bmcproc/ supplements/8/S1. Publication charges for this supplement were funded by the Texas Biomedical Research Institute.
Authors’details 1
Department of Mathematics, Statistics and Computer Science, Dordt College, Sioux Center, IA 51250, USA.2Department of Mathematics, Loyola University Chicago, Chicago, IL 60660, USA.
Published: 17 June 2014
References
1. Gordon D, Finch SJ:Factors affecting statistical power in the detection of genetic association.J Clin Invest2005,115:1408-1418.
2. Ahn K, Haynes C, Kim W, Fleur RS, Gordon D, Finch SJ:The effects of SNP genotyping errors on the power of the Cochran-Armitage linear trend test for case/control association studies.Ann Hum Genet2007,71:249-261. 3. Gordon D, Finch SJ, Nothnagel M, Ott J:Power and sample size
calculations for case-control genetic association tests when errors are present: application to single nucleotide polymorphisms.Hum Hered
2002,54:22-33.
4. Kang SJ, Gordon D, Finch SJ:What SNP genotyping errors are most costly for genetic association studies?Genet Epidemiol2004,26:132-141. 5. Ahn K, Gordon D, Finch SJ:Increase of rejection rate in case-control
studies with differential genotyping error rates.Stat Appl Genet Mol Biol
2009,8:25.
6. Moskvina V, Craddock N, Holmans P, Owen MJ, O’Donovan MC:Effects of differential genotyping error rate on the type I error probability of case-control studies.Hum Hered2006,61:55-64.
7. Huang L, Wang C, Rosenberg NA:The relationship between imputation error and statistical power in genetic association studies in diverse populations.Am J Hum Genet2009,85:692-698.
8. Li B, Leal SM:Methods for detecting associations with rare variants for common diseases: application to analysis of sequence data.Am J Hum Genet2008,83:311-321.
9. Madsen BE, Browning SR:A group-wise association test for rare mutations using a weighted sum statistic.PLoS Genet2009,5:e1000384. 10. Morris AP, Zeggini E:An evaluation of statistical approaches to rare
variant analysis in genetic association studies.Genet Epidemiol2010,
34:188-193.
11. Powers S, Gopalakrishnan S, Tintle NL:Assessing the impact of non-differential genotyping errors on rare variant tests of association.
Hum Hered2011,72:153-160.
12. Mayer-Jochimsen M, Tintle NL:Assessing the impact of differential genotyping errors on rare variant tests of association.PLoS One2013,
8:e56626.
13. Liu K, Fast S, Zawistowski M, Tintle NL:A geometric framework for the evaluation of rare variant tests of association.Genet Epidemiol2013,
37:345-357.
14. Awadalla P, Gauthier J, Myers RA, Casals F, Hamdan FF, Griffing AR, Côté M, Henrion E, Spiegelman D, Tarabeux J,et al:Direct measure of the de novo mutation rate in autism and schizophrenia cohorts.Am J Hum Genet
2010,87:316-324.
15. Ilie L, Fazeyeli F, Ille S:HiTEC: accurate error correction in high-throughput sequencing data.Bioinformatics2011,27:295-302. 16. Nielsen R, Paul JS, Albrechtsen A, Song YS:Genotype and SNP calling
from next-generation sequencing data.Nat Rev Genet2011,12:443-451. 17. Tintle NL, Ahn K, Mendell NR, Gordon D, Finch SJ:Characteristics of
replicated single-nucleotide polymorphism genotypes from COGA: Affymetrix and Center for Inherited Disease Research.BMC Genet2005,
6(Suppl 1):S154.
18. Genetic Analysis Workshop 18: 2012 [http://www.gaworkshop.org], GAW18_Data_Description.pdf. Distributed with workshop materials. July. 19. Kang SJ, Finch SJ, Haynes C, Gordon D:Quantifying the percent increase
in minimum sample size necessary for SNP genotyping errors in genetic model-based association studies.Hum Hered2004,58:139-144.
20. Tintle NL, Gordon D, McMahon FJ, Finch SJ:Using duplicate genotyped data in genetic analyses: testing association and estimating error rates.
Stat Appl Genet Mol Biol2007,6, Article 4.
doi:10.1186/1753-6561-8-S1-S22
Cite this article as:Rogerset al.:Evaluating the concordance between sequencing, imputation and microarray genotype calls in the GAW18 data.BMC Proceedings20148(Suppl 1):S22.
Submit your next manuscript to BioMed Central and take full advantage of:
• Convenient online submission
• Thorough peer review
• No space constraints or color figure charges
• Immediate publication on acceptance
• Inclusion in PubMed, CAS, Scopus and Google Scholar
• Research which is freely available for redistribution