R E S E A R C H
Open Access
Research on mathematical model and
calculation simulation of wireless sensor
solar cells in Internet of Things
Li Cai
*, Nina Dai and Zefu Tan
Abstract
Wireless sensor is an important part of the Internet of Things, which uses solar cells as power supply. Therefore, it is of great significance to study the characteristics of solar cells. In this paper, a new mathematical model of photovoltaic power generation is established, and the tuning methods of light intensity, temperature, photocurrent, reverse current, and open-circuit voltage are introduced in detail. The simulation experiment of software calculation shows that this method can accurately test the performance characteristics of the PV module. Under different conditions, the mathematical model can calculate the output voltage, the output current, the output power, and the power characteristic curve. The conclusions of this paper have practical application and guiding significance for solar cells as wireless sensor energy sources.
Keywords:Mathematical model, Solar cell, Calculation, Simulation, Photovoltaic module
1 Introduction
A wireless sensor network is a wireless network com-posed of a large number of stationary or mobile sensors in a self-organizing and multi-hop manner to coopera-tively perceive, collect, process, and transmit information about perceived objects within a geographic area covered by the network, and ultimately to the network owner. Wireless sensors typically use solar cells as a power source [1, 2]. The basic principle of photovoltaic power generation is the use of silicon containing semiconduc-tors to produce photovoltaic effects, which directly con-vert light energy into electrical energy. Photovoltaic power generation device mainly consists of photovoltaic component array, control module, and power electronic inverter module of three major parts. The photovoltaic component array is made up of a series of solar cells connected in series and encapsulated and protected. It is the key device for converting light energy into electric energy (Fig.1).
Solar photovoltaic cells (referred to as photovoltaic cells) are used to convert the energy of the sun into electricity directly. At present, a large number of silicon solar cells
based on silicon are used in ground photovoltaic system, which can be divided into monocrystalline silicon, poly-crystalline silicon, and amorphous silicon solar cells. In the aspect of energy conversion efficiency and service life, monocrystalline silicon and polycrystalline silicon cells are superior to amorphous silicon cells [3–5]. The conversion efficiency of polysilicon is lower than that of monocrystal-line silicon, but the price is cheaper.
In practical applications, the generation characteristics of PV modules are affected by environmental factors. For example, when the intensity of illumination is large, the output voltage of PV modules is higher. Because the effi-ciency of photovoltaic module output power and power system is directly related, the photovoltaic power station must be real-time adjustment of the PV array operating point near the maximum power point, in order to ensure the power generation efficiency optimization, this method is called MPPT. Therefore, it is of great significance to study the generation characteristics of PV modules.
2 Methods
2.1 Principles of solar power generation
If the light is irradiated on the solar cell and the light is absorbed at the interface layer, photons with sufficient energy can excite electrons from the covalent bonds in * Correspondence:[email protected];[email protected]
Key Laboratory of Information and Signal Processing, Chongqing Three Gorges University, No. 666 Tianxingjie, Wanzhou, China
© The Author(s). 2018Open AccessThis article is distributed under the terms of the Creative Commons Attribution 4.0 International License (http://creativecommons.org/licenses/by/4.0/), which permits unrestricted use, distribution, and reproduction in any medium, provided you give appropriate credit to the original author(s) and the source, provide a link to the Creative Commons license, and indicate if changes were made.
Caiet al. EURASIP Journal on Wireless Communications and Networking
(2018) 2018:116
p-type silicon and type N silicon, resulting in an electron hole pair. The electrons and holes near the interface layer will be separated from each other by the electric field of the space charge. Electrons move toward posi-tively charged N regions and holes toward negaposi-tively charged P regions [6]. Through the charge separation of the interface layer, an outward, testable voltage between the P region and the N region will be generated.
At this point, electrodes can be placed on both sides of the wafer and connected to the voltmeter. For
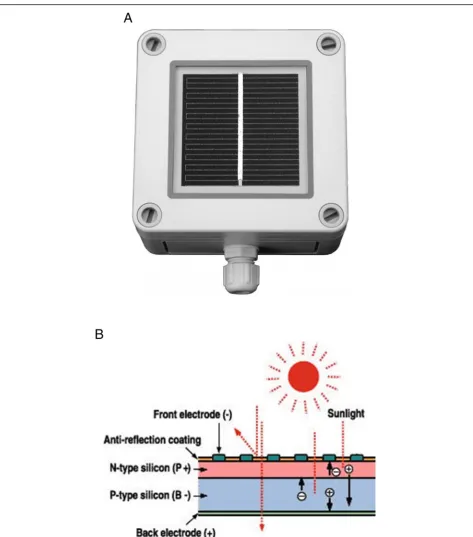
crystalline silicon solar cells, the typical values of open-circuit voltage are from 0.5 to 0.6 V. The greater the electron hole pair produced by illumination at the inter-face layer, the greater the current. The more energy absorbed by the interface layer, the larger the interfacial layer, i.e., the larger the cell area, the greater the current in the solar cell (Fig.2).
Solar cell power generation system, also known as solar power generation system, is the conversion of solar energy to electricity, through the solar charging and
A
B
Fig. 1Photovoltaic cell and system.aWireless sensor networks system.bExplanation of the principle of solar cell power generation system: sunlight is irradiated to the solar panel to generate electric current, which is provided to the electric equipment or battery energy storage system
discharging controller to power the load, while charging the battery. The solar power generation system consists of a solar cell, a solar controller, and a battery (group). If the output power is AC 220 or 110 V, the inverter must also be configured.
2.2 Mathematical model
The equivalent model of photovoltaic module is shown in Fig.3.
In a unit time period, the illumination intensity is stable, so the photovoltaic component is equivalent to
A
B
Fig. 2Solar cell power generation schematic.aThe solar cell of wireless sensor.bExplanation of the working principle of solar cells: the n-type silicon’s spare electrons jump over to fill the gaps in the p-type silicon. The n-type silicon becomes positively charged, and the p-type silicon is negatively charged, creating a current field across the cell
the constant current source, and the R is the series re-sistance of the multi solar panel, which can be obtained according to Kirchhoff’s current law:
I¼ILC−IRC ð1Þ
According to Ohm’s law, the relationship between the current and the voltage in the P-N junction is as follows:
Voc¼
The mathematical model of the generation characteris-tics of conventional photovoltaic modules can be ob-tained from the following [7]:
I¼ILC−IRC e
q Vð ocþIRÞ
AKT −1
h i
ð4Þ
The parameters of the upper formula are as follows: ambient temperature is T, light intensity is C, light current is ILC, open-circuit voltage Voc, reverse cutoff
current IRC, and PV component resistance R. The
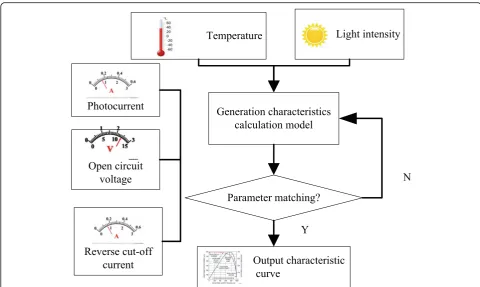
algorithm contains the following five parameters, just as Fig. 4.
(1) Open-circuit voltageVoc: the solar cell is placed under the 100 mW/cm2light source, and the output voltage of the solar cell is both ends open. (2) Short-circuit current: short-circuit currentIsc: that
is, the solar cell is placed under the irradiation of the standard light source, and the current flowing through the solar cell is shorted when the output terminal is short circuited.
(3) Large output power: the working voltage and current of the solar cell vary with the resistance of the load, and the voltage and current value of the different resistance values are made into curves to obtain the
volt ampere characteristic curve of the solar cell. If the selected load resistance can maximize the product of the output voltage and current, the maximum output power can be obtained, expressed in symbolicPm. The operating voltage and the operating current are called the best operating voltage and the best working current. They are represented by symbolsVmandIm, respectively [8,9].
(4) Fill factor: another important parameter of the solar cell is the fill factor which is the ratio of the maximum output power to the open-circuit voltage and the short-circuit current. Fill factor is an important indica-tor to measure the output characteristics of solar cells. It represents the maximum power output of solar cells with the best load, and the greater the value, the greater the output power of solar cells.
The value of fill factor is always less thanL. In fact, due to the influence of series resistance and shunt resistance, the value of the filling factor of the actual solar cell is lower than the ideal value given by the upper formula. The series and parallel resistances have a great influence on the filling factor. The series resistance is greater, the short-circuit current decreased more, also reduced the number of fill factor; parallel resistance is smaller, the greater part of the current, open-circuit voltage drop more, along with the decline of the filling factor. (5) Conversion efficiency: the conversion efficiency of
solar cells refers to the maximum energy
conversion efficiency when the best load resistance is connected on an external circuit, equal to the ratio of the output power of the solar cell to the energy on the surface of the solar cell [10]. The photoelectric conversion efficiency of solar cells is an important parameter to measure the battery quality and technical level, the structure, and battery junction characteristics, material properties,
Fig. 3Photovoltaic power generation schematic. The equivalent model of photovoltaic:Uis the power,Iis the current, andRis the resistance
working temperature, radioactive radiation damage, and environmental change and so on.
2.3 Calculation simulation
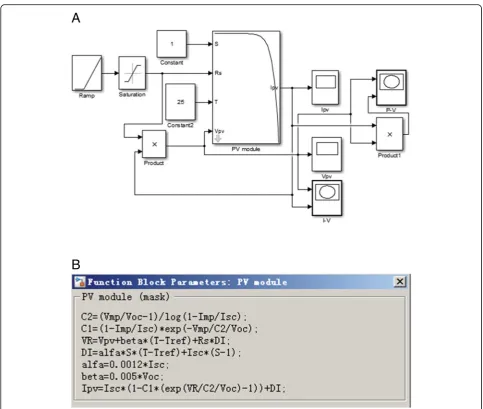
In building the test platform, the hardware for the Intel CPU i7-7700 K, 4GigaByte RAM, ASUS GTX1070 8GigaByte display memory, display card, Samsung 256GigaByte SSD hard disk, Windows 7 software (6.1. 7601), and MATLAB2015R (8.5.0197613) are used. The increase of the time observation statement in theM file and run, the simulation model, and related parameter settings are shown in Fig.5.
3 Results
Take the three steps for engineering experiments: first of all, the experimental samples are fixed on the experimen-tal platform placed on the mountain. The semiconductor is connected to the load by a wire, and an ammeter is added to the voltmeter to measure the data. By changing the distance between the mountain and the light source, the light intensity and temperature are changed, and the fan is used to assist the control of temperature.
Second, 104oF was selected as the reference temperature, and the characteristics of samples were observed during the change of light intensity from 250 to 750 W/m2and then
keep the light intensity under the 250 W/m2 condition and record the data of the temperature change. Finally, select the next sample and repeat step 2.
A series of output voltage output current and output voltage output power curves are obtained under differ-ent environmdiffer-ental parameters. The data of four time nodes are selected randomly, and the output characteris-tic curve is shown in Fig.6.
With the increase of illumination intensity E, the open-circuit voltageVocincreases with the logarithm of
incident light intensity. In addition, considering the working principle of solar cells, the open-circuit voltage
Vocwill not increase indefinitely with the incident light
intensity increasing. The maximum value of the open-circuit voltage is the voltage value at which the PN junc-tion barrier height is zero [11].
In other words, the maximum light solar battery voltage of PN junction barrier corresponding to the potential of
VDis a bandgap and doping level-related value. In
prac-tice, the open-circuit voltageVocis equivalent toEg/q.
4 Discussion
The results showed that significantly affected the I-V characteristics and photovoltaic properties of sunlight intensity and series resistance of solar cells. When
Fig. 4The system work flow chart:Uis the power,Iis the current, andRis the resistance. The sensor collects temperature and intensity, calculates the parameters of the equivalent model, and outputs the results after matching the parameters
sunlight intensity increases, the short-circuit current, open-circuit voltage, and maximum output power creased, while the fill factor is reduced; when the in-crease of series resistance, open-circuit voltage of the
battery remains unchanged, and the short-circuit
current, maximum output power, the power conversion efficiency, and fill factor decrease [12].
The results also showed that the output power curve of solar cell has obvious nonlinear characteristics, and each curve has only one maximum output power point and an optimum load resistance value.
5 Conclusions
Through the analysis of DC equivalent circuit of solar cell, using MATLAB to establish the simulation model
of solar cell, study the effect of sunlight intensity and battery internal resistance of battery volt ampere charac-teristics, short-circuit current, open-circuit voltage and the fill factor and power output performance. Draw the following conclusions:
(1) If the solar cell surface temperature increases, the output power drops, showing negative temperature characteristics. The temperature of the surface of the battery under illumination is 20°~40° higher than the outside temperature, so the output power of the battery is lower than that of the standard state. In addition, as the season and temperature changes, the output power is changing.
A
B
Fig. 5MATLAB simulation block diagram and parameter setting.aThe simulation block diagram of solar cells in MATLAB software: ramp and so on are input signals, The PV model is a mathematical model described in the chapter 2.2. I–V, and P–V are the oscilloscopes used to display the results.bParameter setting of simulation block
(2) If the intensity of illumination is the same, the output power is greater in winter than in summer. The illumination characteristics and temperature characteristics, constant temperature, where changes in light intensity, short-circuit current (Isc) and the light intensity is proportional to the
maximum power and the light intensity is roughly proportional to; when the illumination intensity is constant, the temperature rises, the open-circuit voltage (Voc) and maximum output power (Pm) decreased.
The above conclusions have practical application and guiding significance for solar cells as wireless sensor energy sources.
Abbreviations
AC:Alternating current; CPU: Central processing unit; DC: Direct current; MPPT: Maximum power point tracking; PN junction: Positive-negative junction; PV: Photo voltaic; RAM: Random access memory; SSD: Solid state drives
Acknowledgements
The authors would like to thank Dr. Wang Linwei of Chongqing University for providing some references of solar cells.
Funding
This work is supported by the China Chongqing Three Gorges University Youth Fund under grant 16QN11.
Authors’contributions
CL contributed to the main idea and designed the mathematical model. DN designed and carried out the simulation and wrote the code of the simulation program. TZ analyzed the results. All authors read and approved the final manuscript.
Competing interests
The authors declare that they have no competing interests.
Publisher’s Note
Springer Nature remains neutral with regard to jurisdictional claims in published maps and institutional affiliations.
Received: 26 January 2018 Accepted: 1 May 2018
References
1. XG Liu, WS Hua, X Liu, Experimental investigations of laser intensity and temperature dependence of single crystal silicon photovoltaic cell parameters. Chin. J. Lasers42(8), 0802011 (2015)
2. TS Babua, JP Rama, K Sangeethaa, Parameter extraction of two diode solar PV model using fireworks algorithm. Sol. Energy140(10), 265–276 (2016) 3. BS Xie, P Dai, XD Luo, SL Lu, IV characteristics and analysis for GaAs based
single junction solar cells with different back surface fields. Acta Opt. Sin.
37(2), 0223002 (2017)
4. Y Zheng, ZG Zhao, XF Gou, Modeling and the analysis of output feature of solar energy photovoltaic cell based on simulink. J. Lanzhou Jiaotong Univ.
32(1), 97–100 (2013)
5. JD Chen, SH Huang, Simulation of photovoltaic module characteristics in arbitrary solar radiation and temperature. Laser Optoelectron. Prog.53(2), 188–196 (2016)
6. ZY Zhong, H Wang, JH Gu, Effect of illumination intensity and internal resistance on photovoltaic performance of solar cells. J. S. Cent. Uni. Natl. (Nat. Sci. Edition)31(1), 62–79 (2012)
7. Y Li, RH Shi, An intelligent solar energy-harvesting system for wireless sensor networks. EURASIP J. Wirel. Commun. Netw.2015(1), 179 (2015) 8. AR Jordehi, Parameter estimation of solar photovoltaic (PV) cells: a review.
Renew. Sust. Energ. Rev.61(1), 354–371 (2016)
9. MAM Caporal, JDR Magdaleno, IC Vega, RM Caporal, Improved grid-photovoltaic system based on variable-step MPPT, predictive control, and active/reactive control. IEEE Lat. Am. Trans.15(11), 2064–2070 (2017) 10. DT Cotfas, PA Cotfas, D Ciobanu, OM Machidon, Characterization of photovoltaic-thermoelectric-solar collector hybrid systems in natural sunlight conditions. J. Energy Eng.143(6), 04017055 (2017)
A
B
Fig. 6Measurement curve of photovoltaic power generation characteristics.aI-V curve which means the current-voltage curve. Thex-axis is the output voltage and the unit is volt. They-axis is the output current and the unit is ampere. The two curves represent the current under different light intensity and different temperatures.
bP-V curve which means the power-voltage curve, Thex-axis is the output voltage and the unit is volt. They-axis is the output power and the unit is Watt. The two curves represent the power under different light intensity and different temperatures
11. KA Wang, XJ Wu, FJ Deng, F Liu, A dynamic power distribution strategy for large-scale cascaded photovoltaic systems. J. Power Electron.17(5), 1317– 1326 (2017)
12. T Kropp, M Berner, L Stoicescu, JH Werner, Self-sourced daylight electroluminescence from photovoltaic modules. IEEE J. Photovoltaics7(5), 1184–1189 (2017)